REVISION DATE: 02-Jun-2016 11:19:35
The data for this page all NET signals (lite-dark)
The Day 11 data was Mike trying to reproduce Habauzit Fig.5. All the data where taking using a lamp (rather than a laser, which was used in the paper) and at 1 sec with the PD monitor keeping track of lamp levels. Different lamp levels where acheived by closing an iris. Mike when from high to low a number of times with 7 1 sec repeats with the iris fully open.
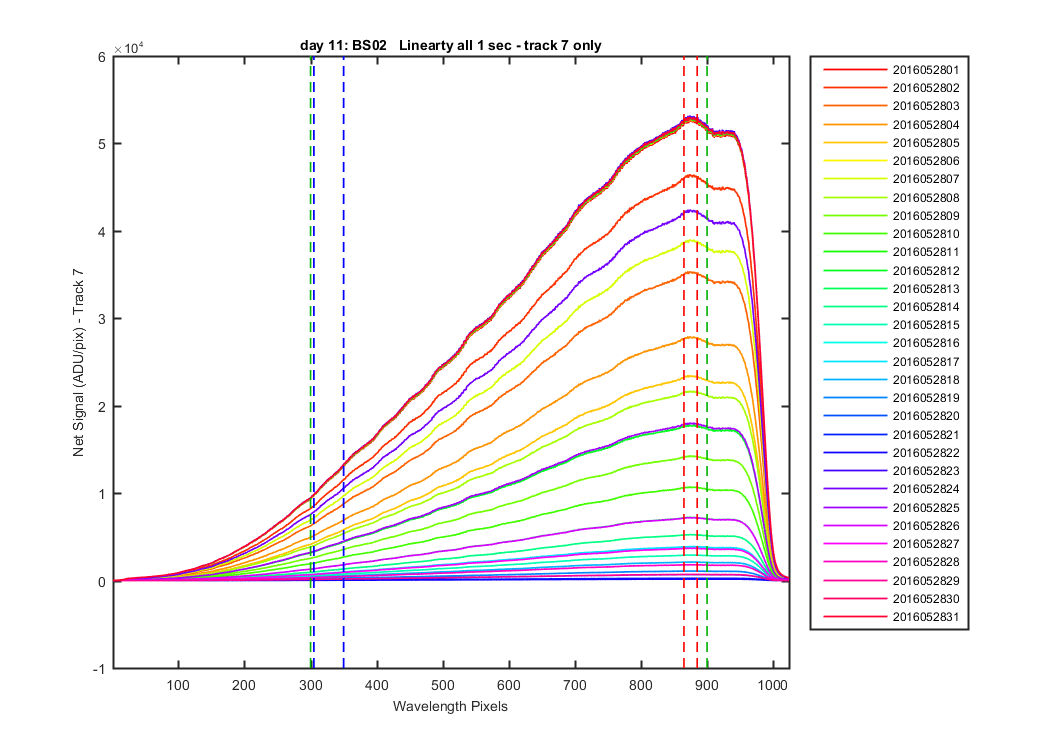
All the spectral track 7 lamp data collected. You can see the repeats at the top and the number of ups and downs Mike did with the lamp levels. The colored dashed lines show the pixel ranged avereaged for each file to create the different graphs below. Green = 300-900, Blue = 305-350 and red = 865-885.
Figure 1
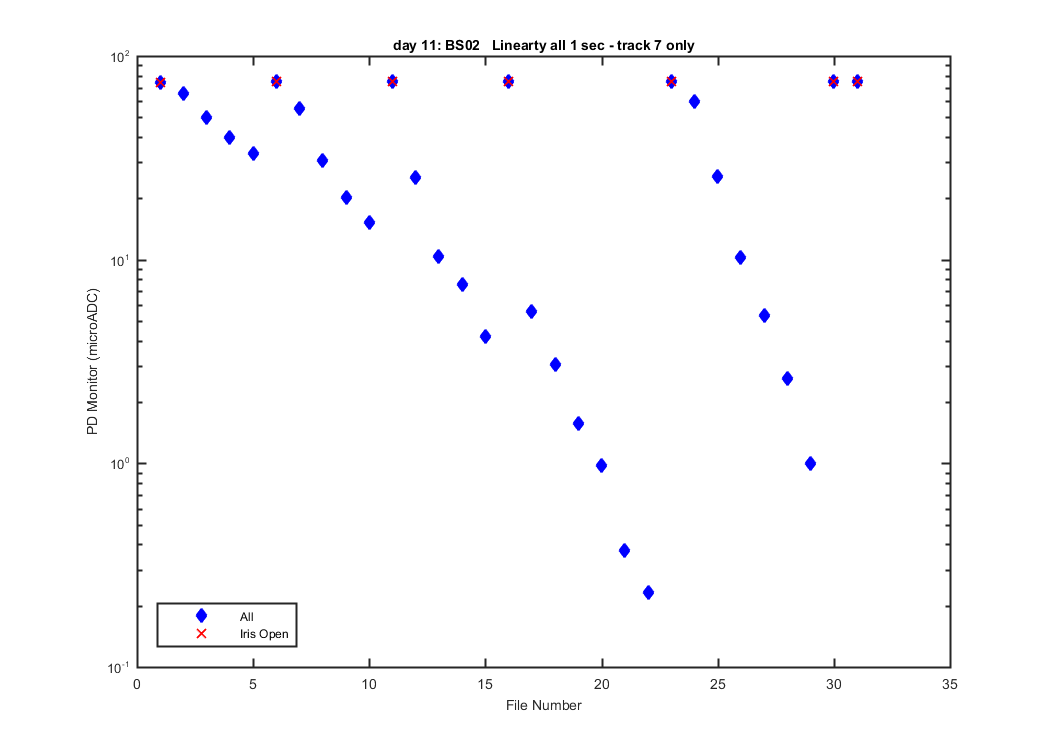
All the averaged PD monitor data for each file. The red cx show the repeats with the iris fully open. These will give us and idea of the stability of this setup.
Figure 2
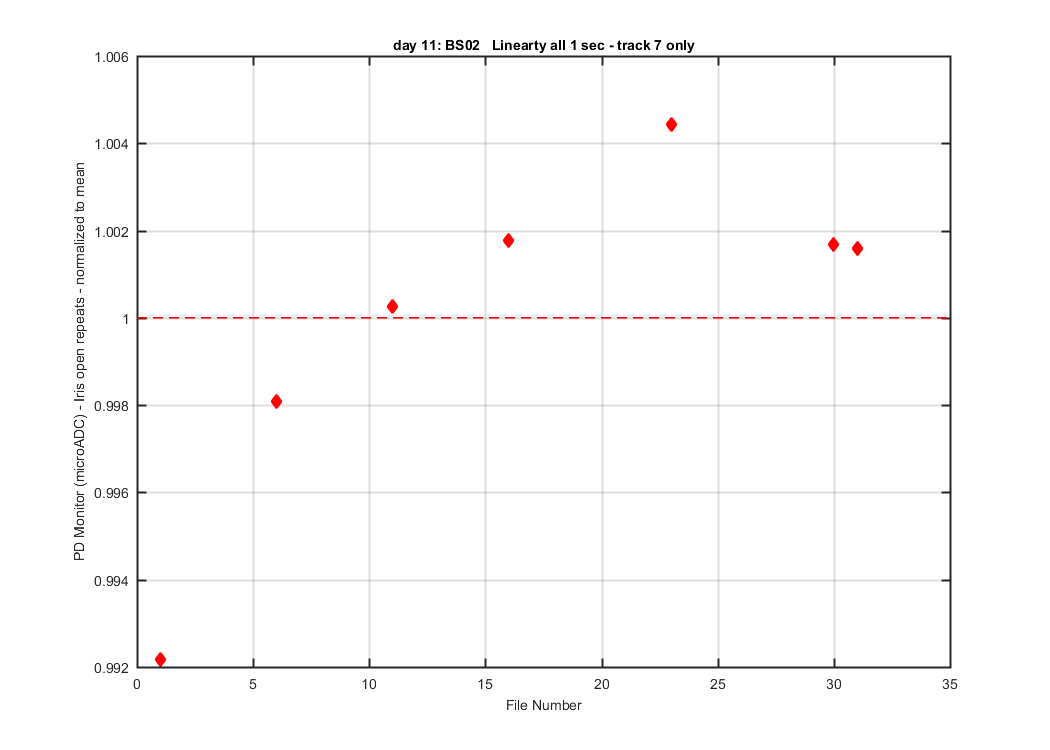
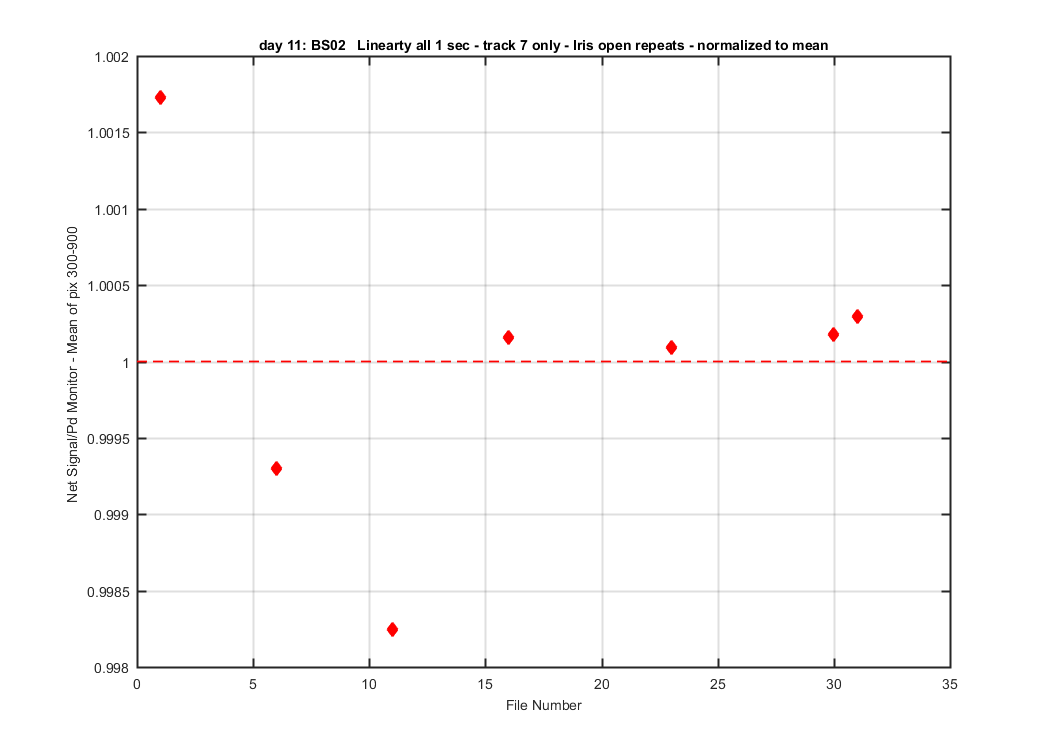
The PD monitor data with just the repeat plotted divided by the mean of the repeats. So you can see the variation from the mean.
Figure 3
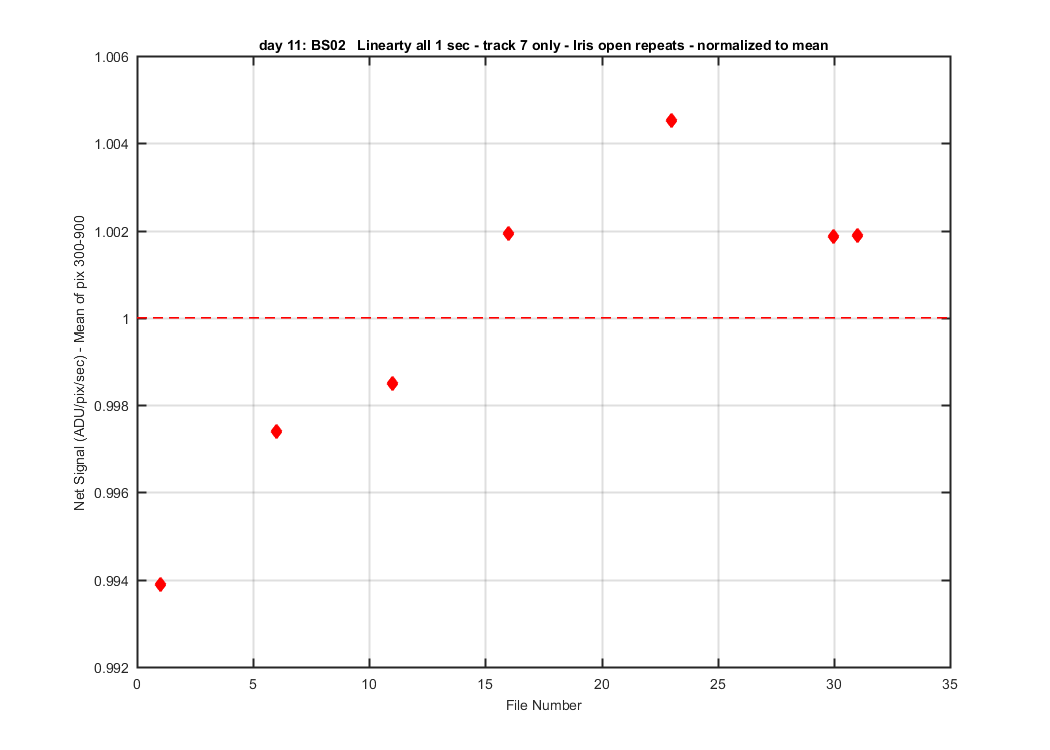
The net signal data for the iris fully open repeats divided by the mean of the repeats. THe result is a similar pattern as the PD monitor data.
Figure 4
THe same data as above only normalized the to PD monitor data to take out the lamp changes. Looks pretty stable.
Figure 5
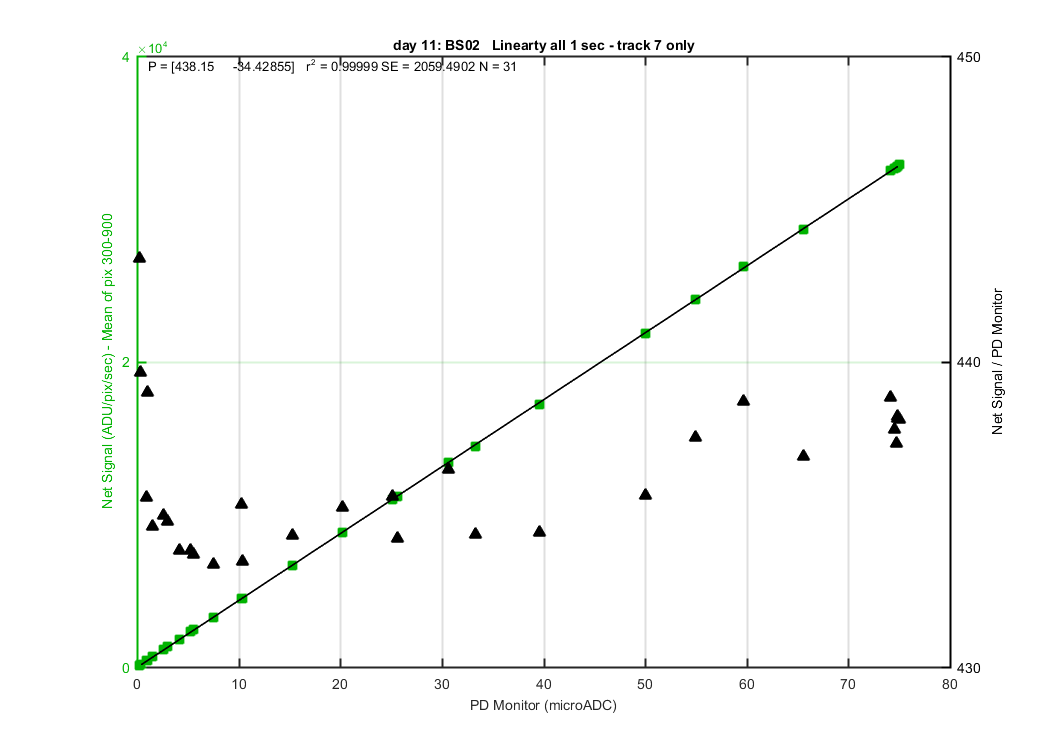
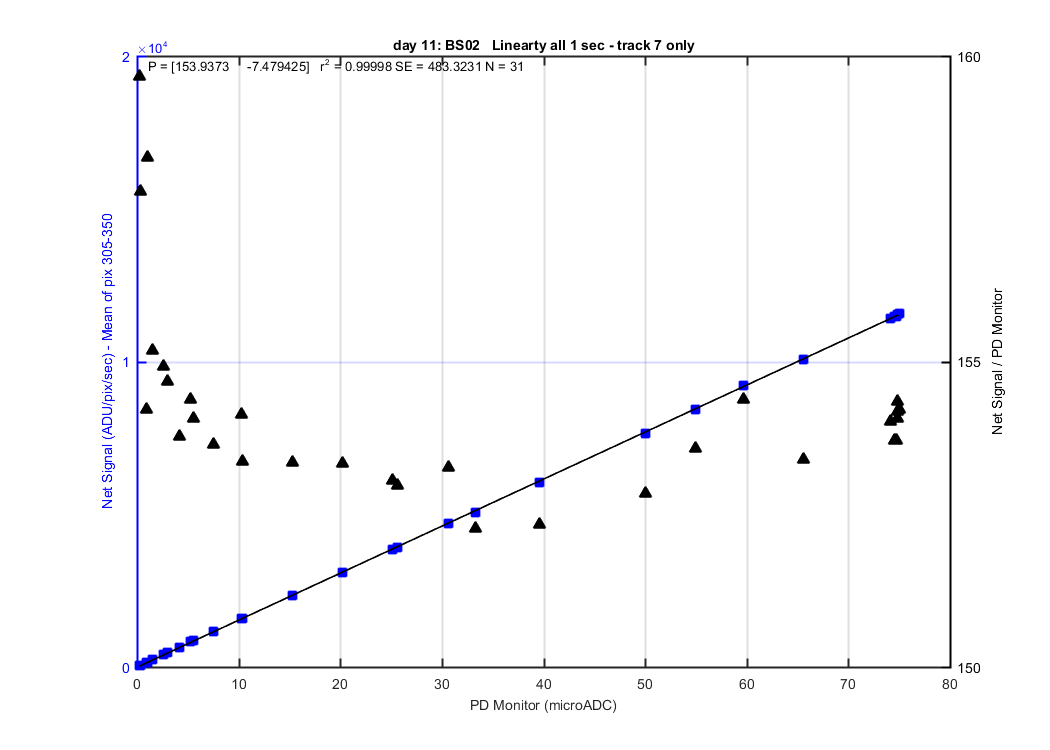
My first attempt at recreating Figure 5 from the Habauzit 2003 paper. The squares are the mean of the Net signal for the pixels noted in the ylabel vs PD monitor. The triangles are the Net signal/PD Monitor verses the PD monitor. I created these graphs for three different pixel ranges (See figure 1) the ylabel denotes the pixel range averaged. I wanted to see what effect different pixel ranges had on the data. I have added the linear fit coeff and the r^2 value.
Figure 6
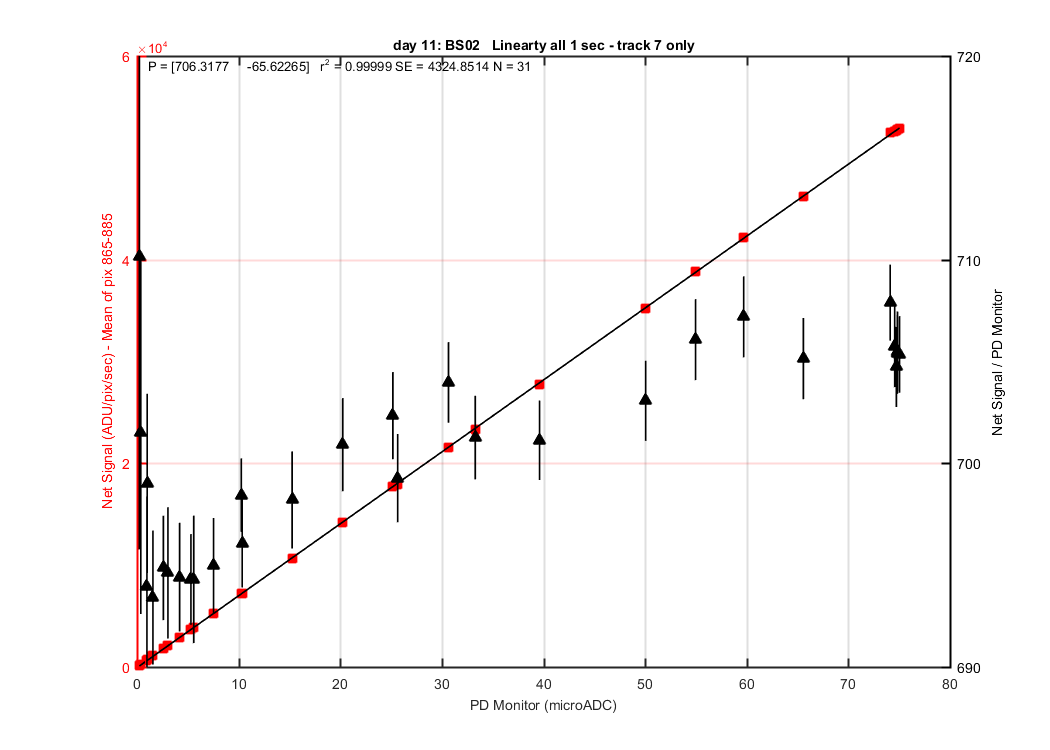
Same as figure 6 but for narrower pixel range at the max lamp signal. I have added to this graph the Habauzit 2003 Eqn.4 (Mikes interpretation) of the uncertainty of each triangle.
Figure 7
Same as figure 6 but for a pixel range at a lower light level and a narrower range.
Figure 8
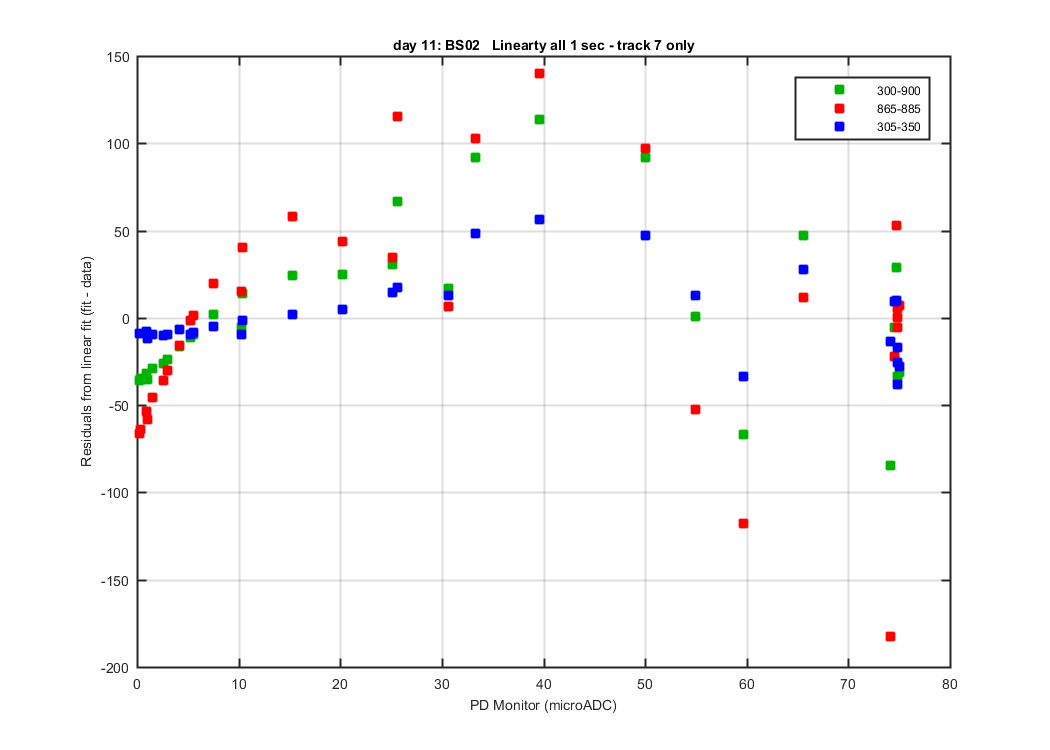
This is the residuals from the linear fit for each of the three fits above.
Figure 9