REVISION DATE: 10-Feb-2016 10:25:24
Mike tooks some laser data with only track 8 on to get a approximate wavelength cal. I found the pixel for each track and wavelength three ways. The simplest was to just find the maximum value for the track (this does not take into account that the wavelength may not be centered on the pixel. The second two ways are using Gausiann fitting programs: mygaussfit and gaussfit. They where downloaded from the Matlab userfiles so not guarantees of how they work. This should find a truier center pixel for the laser data. One other issue is how accurate the laser wavelengths are.
All the graphs just shows the data for track 8 only. The secondset of graphs shows the laser data taken and is zoomed in on the peaks. The last three shows the relationship between the Laser wavelength and its pixel for the three ways to get the laser pixels. A second order polynomial was used and I liked the laser peaks from the mygaussfit programs so that was the one I used create the wavelength cal. The bottom of the page is a listing of the tracks, laser wavelength and laser pixels used in the polynomial fits.
2nd order polynomial regressions
P(8,:) = [1.24873e-05 0.33684 343.19 ];
Track 8 [min/max nm] = [343.527 701.208 ];
Figure 1
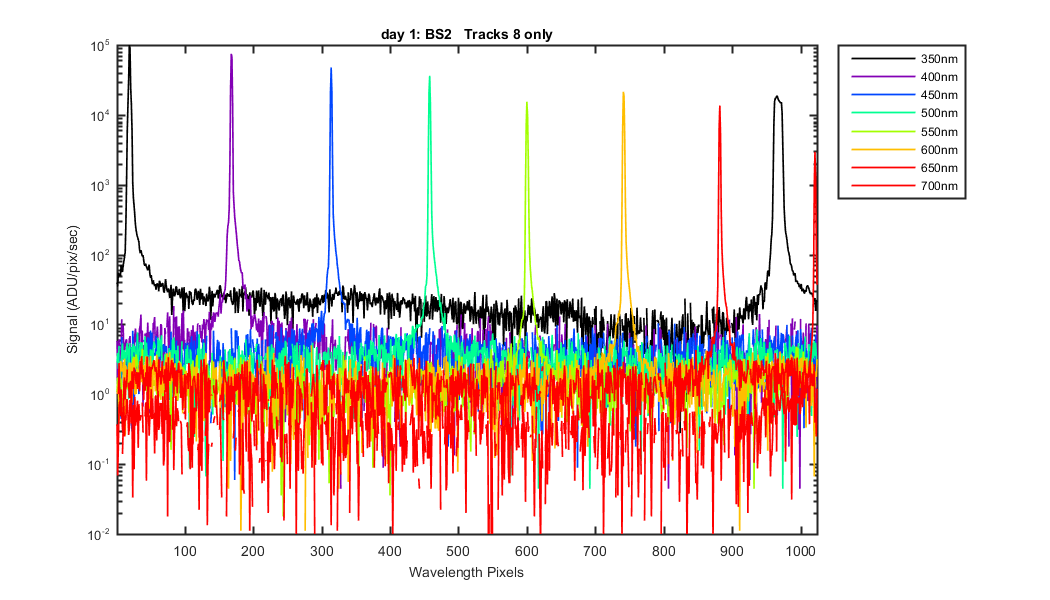
Figure 2
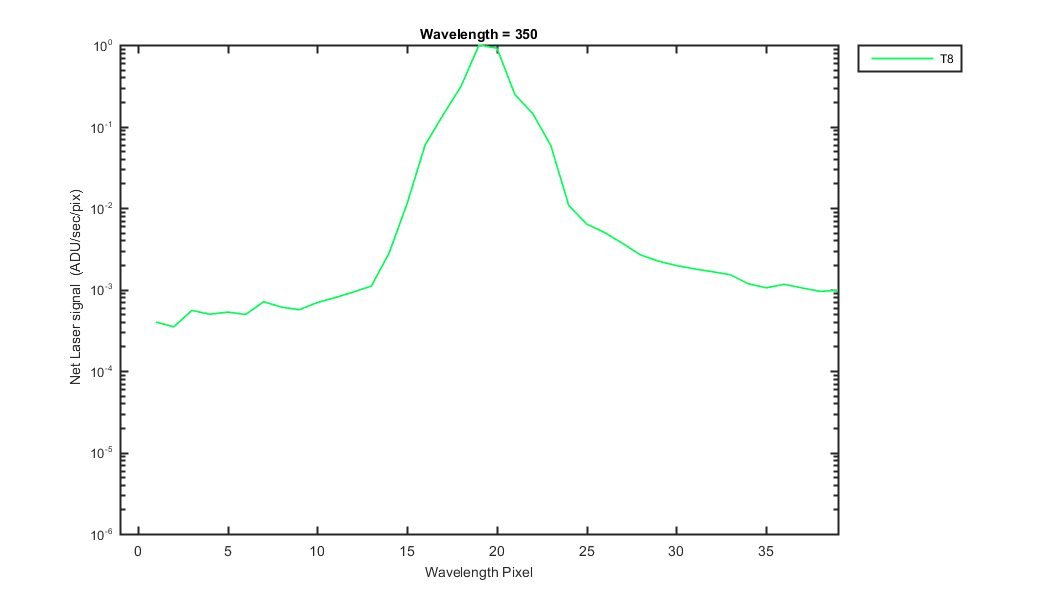
Figure 3
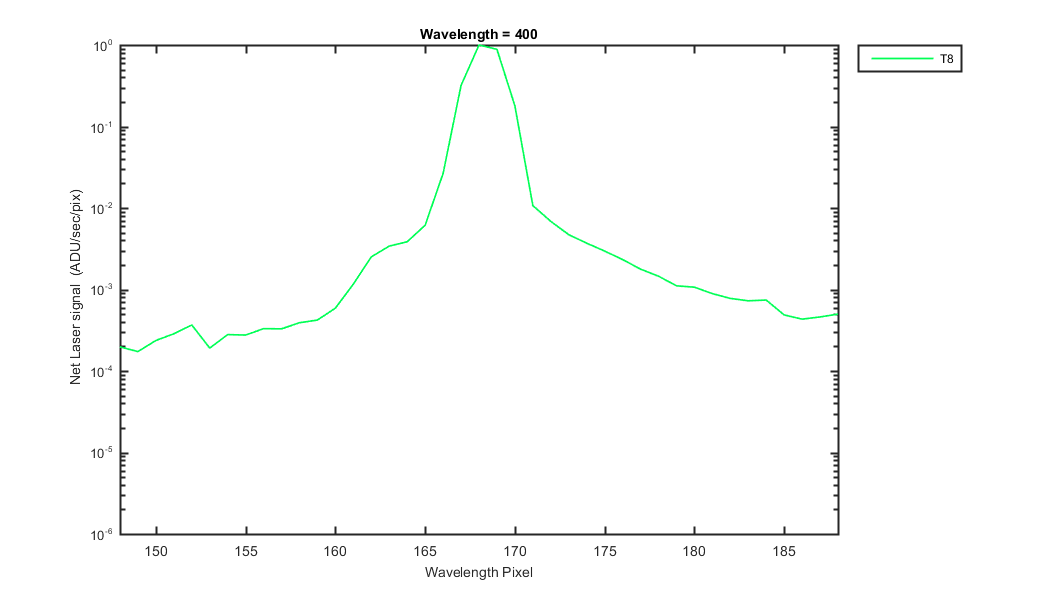
Figure 4
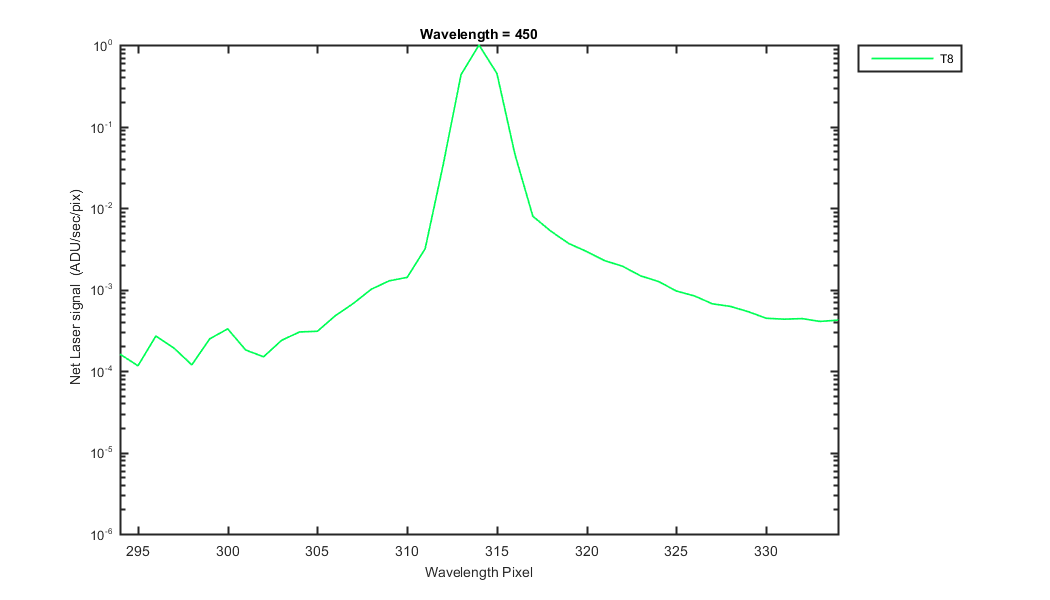
Figure 5
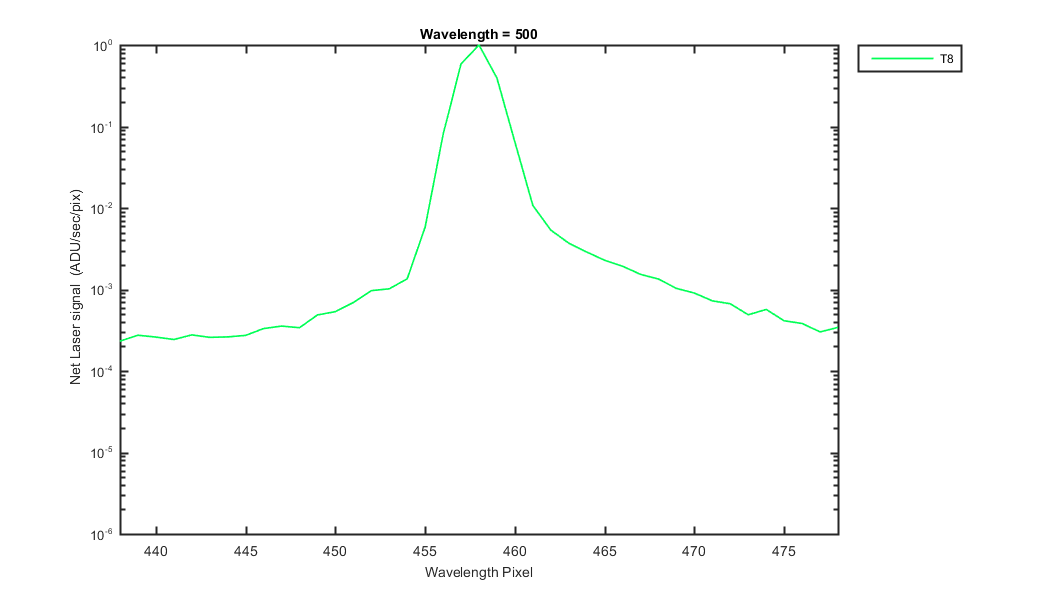
Figure 6
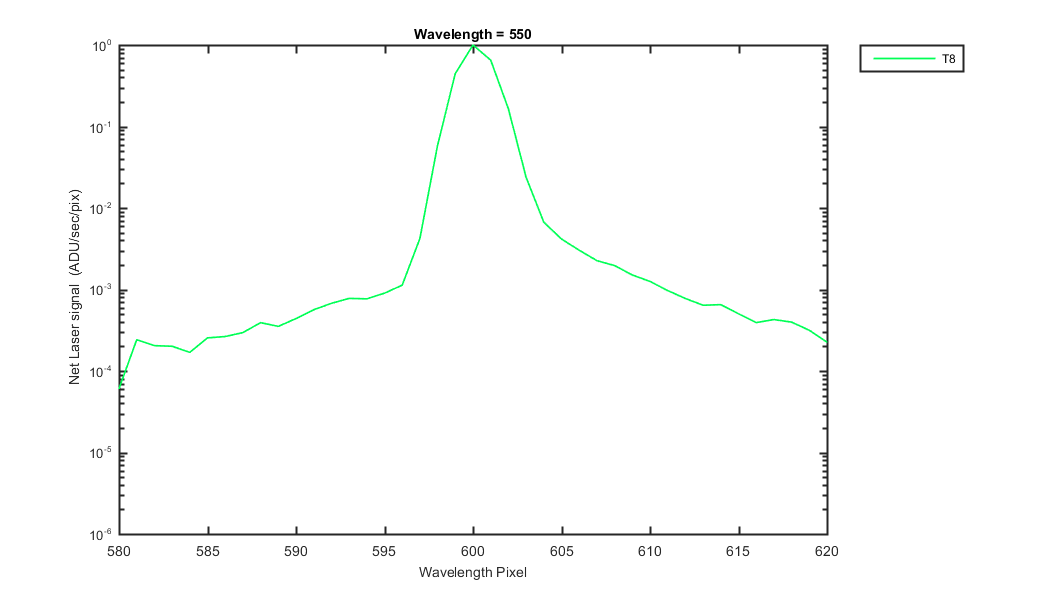
Figure 7
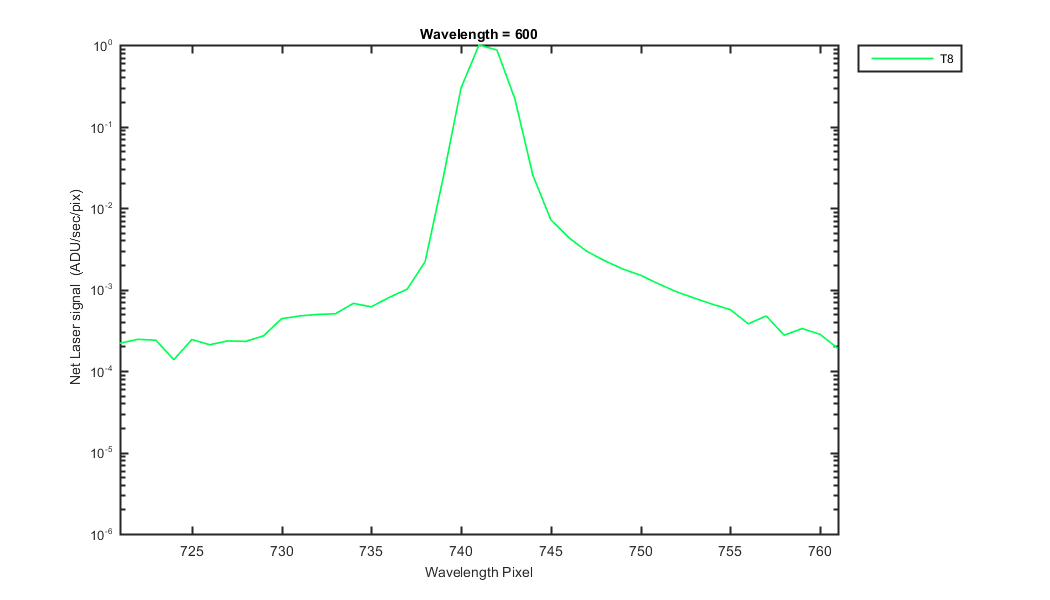
Figure 8
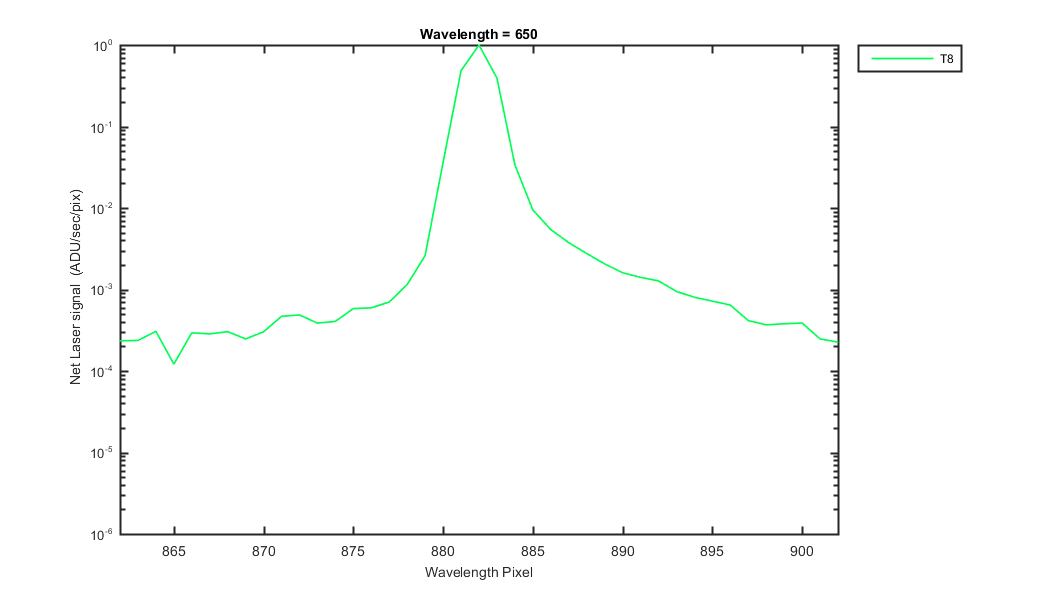
Figure 9
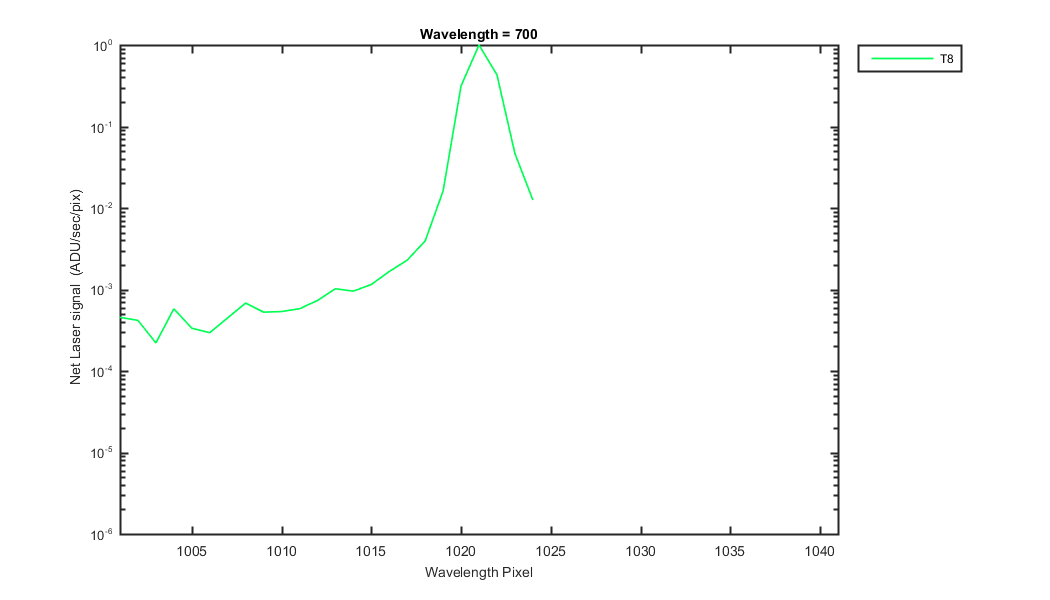
Figure 10
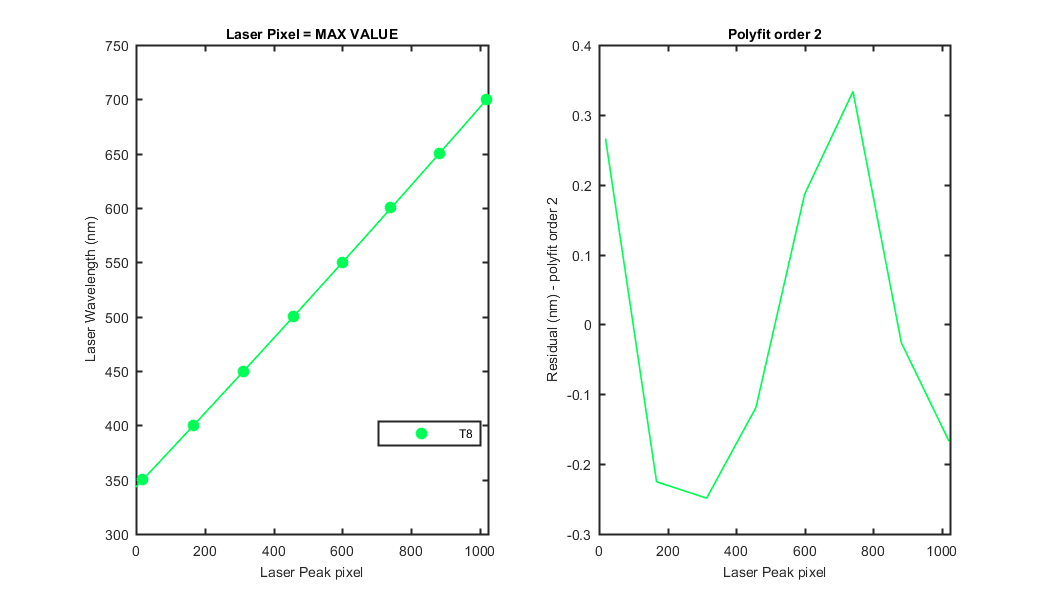
Figure 11
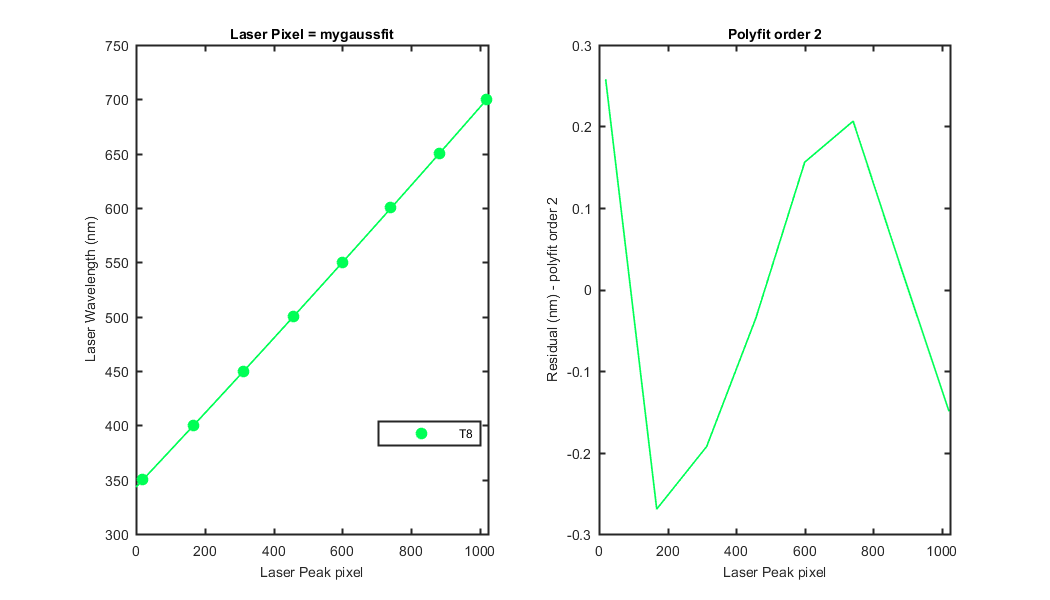
Figure 12

Track = The Resonon Track number
Lwave = Laser Wavelength
Lpix1 = Laser Pixel found using the max value of the track
Lpix2 = Laser Pixel found using mygaussfit to fit the laser peak
Lpix3 = Laser Pixel found using gaussfit to fit the laser peak

Track Lwave Lpix1 Lpix2 Lpix3
    8    350       19      19.44      19.43
    8    400      168     168.40     168.39
    8    450      314     314.01     314.01
    8    500      458     457.86     457.87
    8    550      600     600.15     600.17
    8    600      741     741.42     741.40
    8    650      882     881.94     881.94
    8    700     1021    1021.08    1021.08