REVISION DATE: 10-Feb-2016 09:38:31
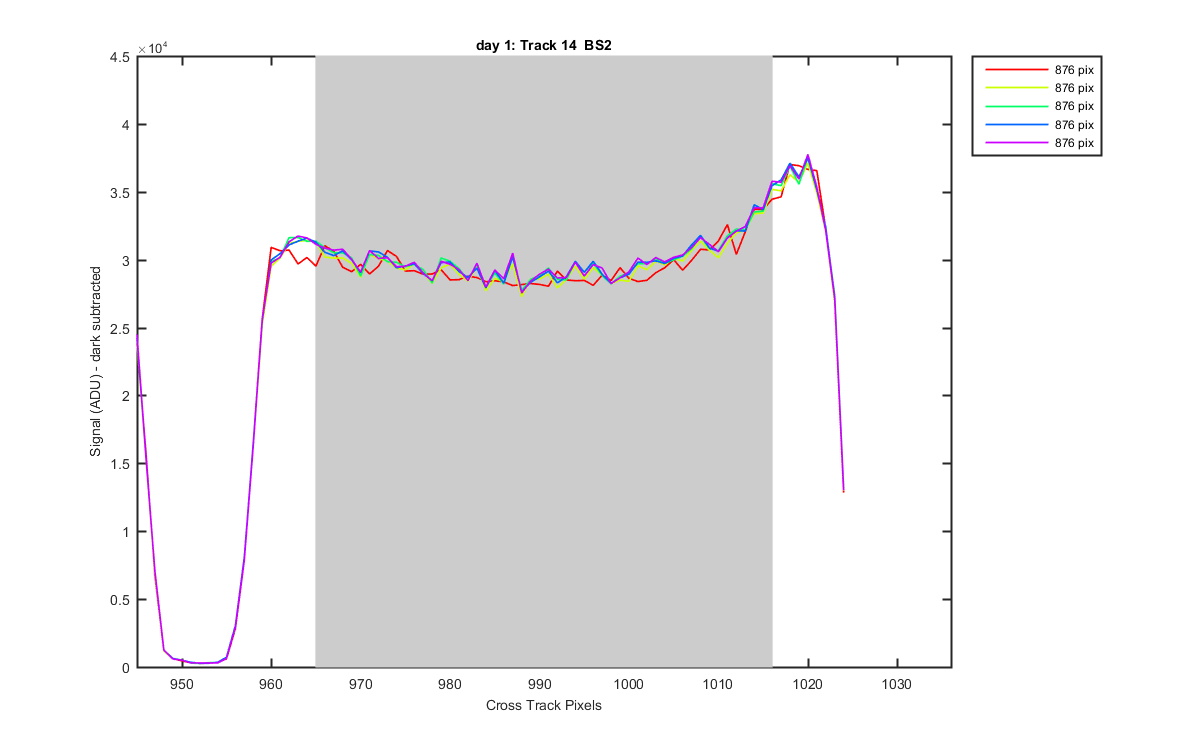
The graphs below show how I defined the tracks. Grey patches are what is averaged for each track. These are created from Oriel Lamp data, 5 data sets.
Track pixels:
Track:  1       2       3       4       5       6       7       8       9      10      11      12      13      14
Left:   16      88     164     239     311     386     455     529     600     671     743     817     890     965
Right:  61     136     210     282     354     426     503     573     646     717     789     866     938    1016
Figure 1
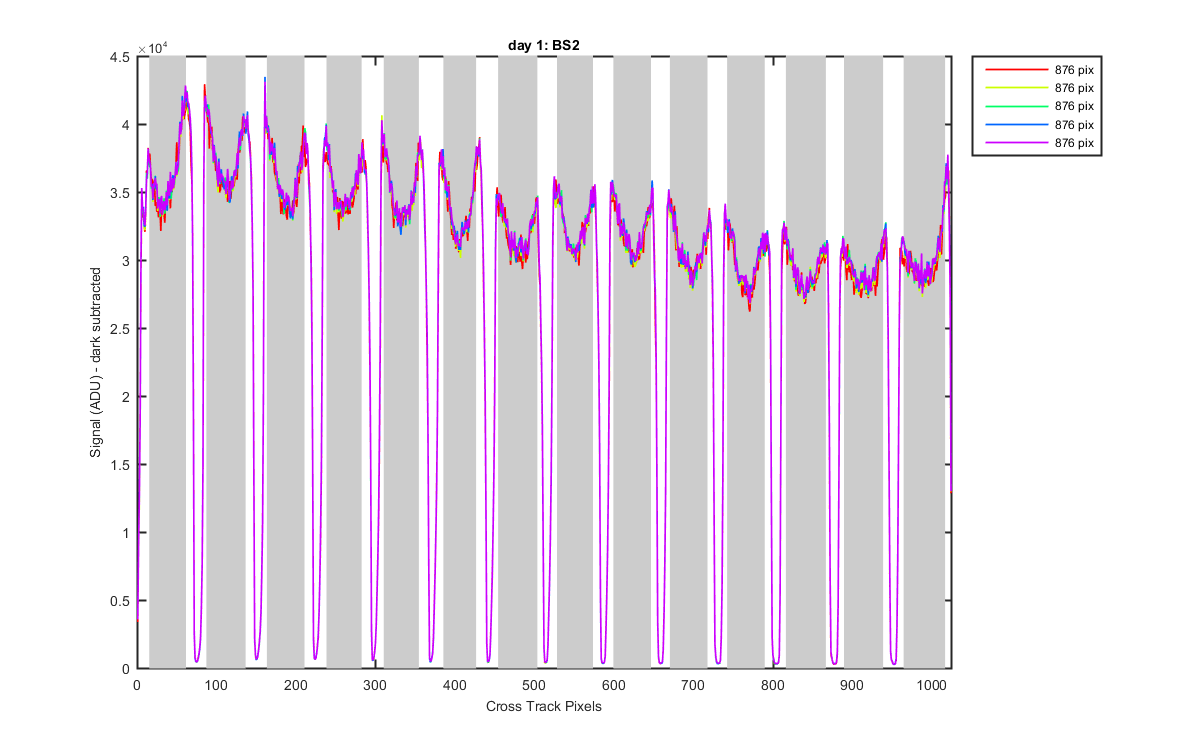
Figure 2
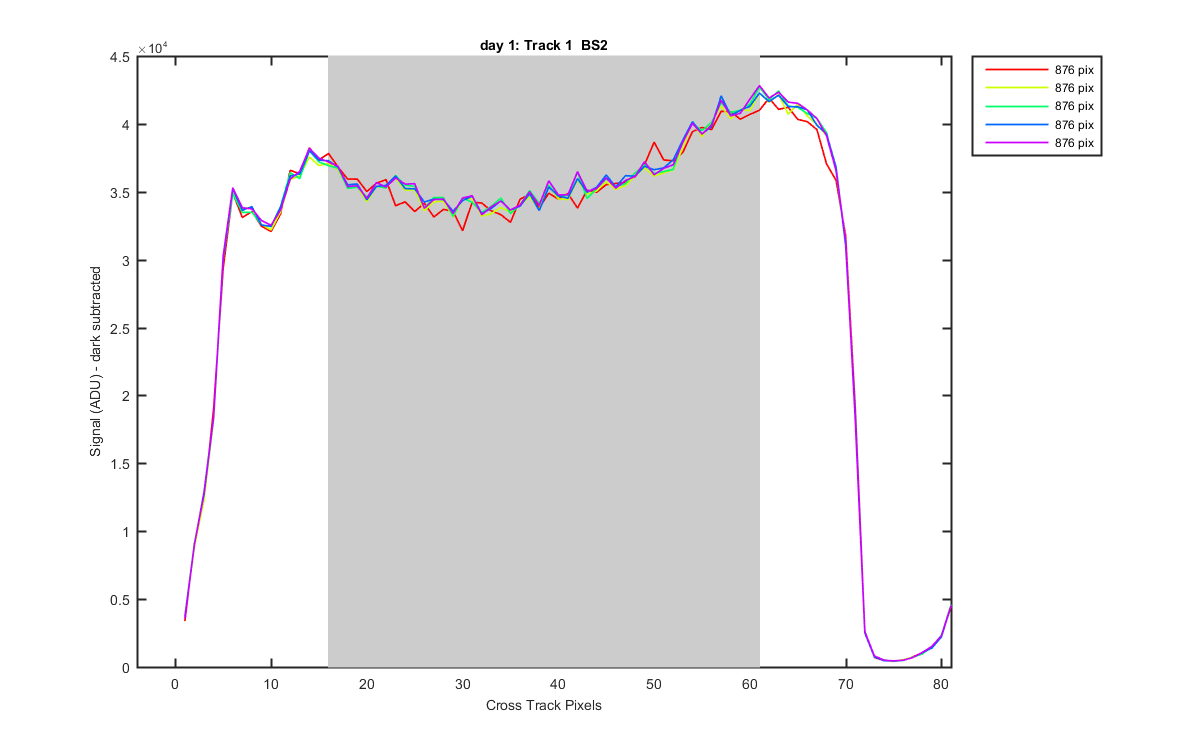
Figure 3
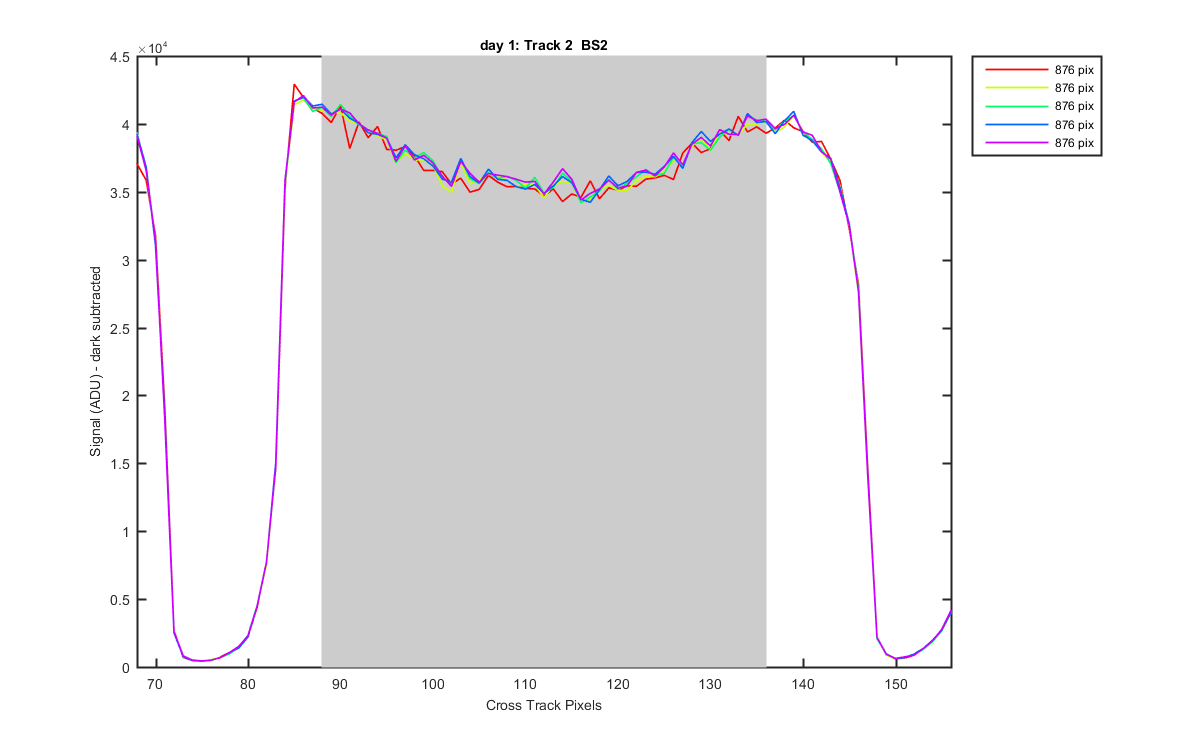
Figure 4
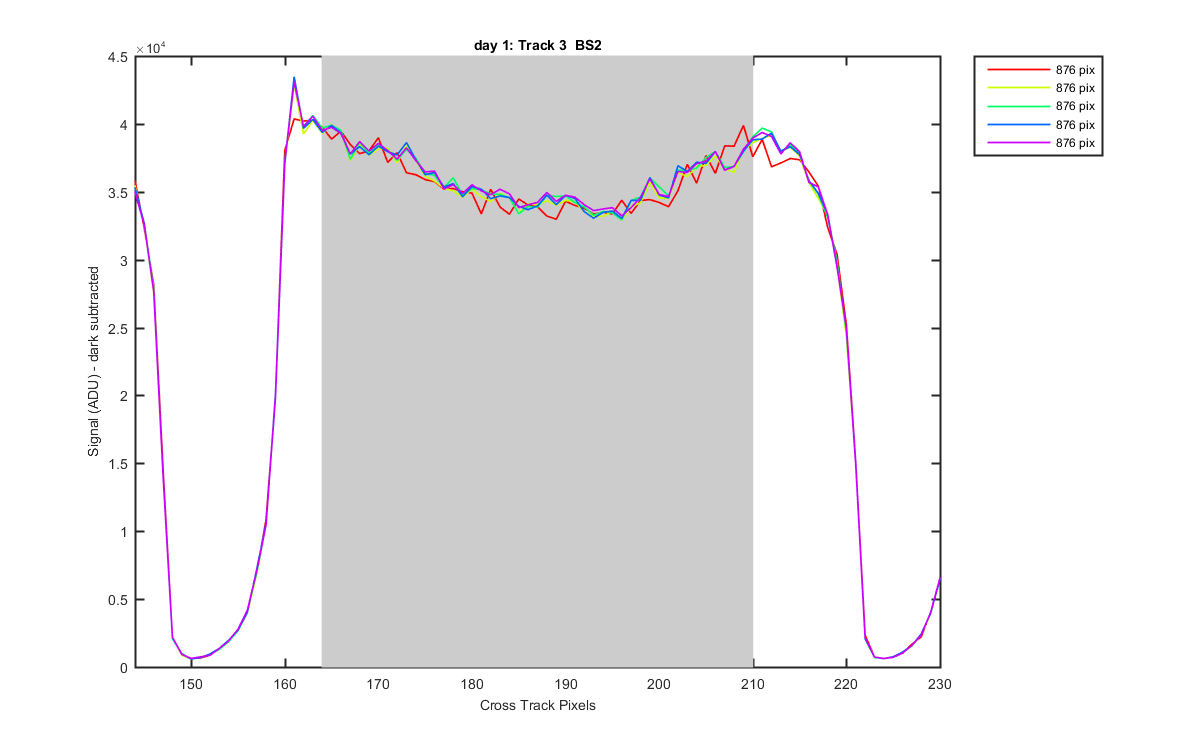
Figure 5
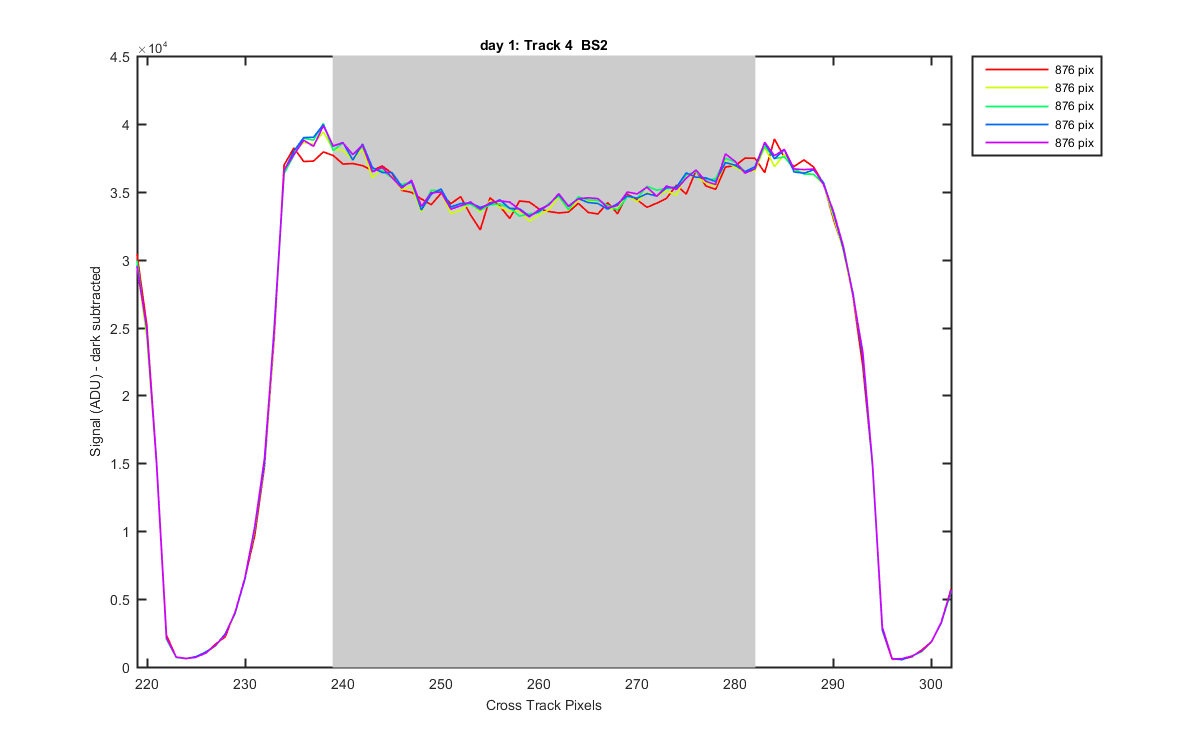
Figure 6
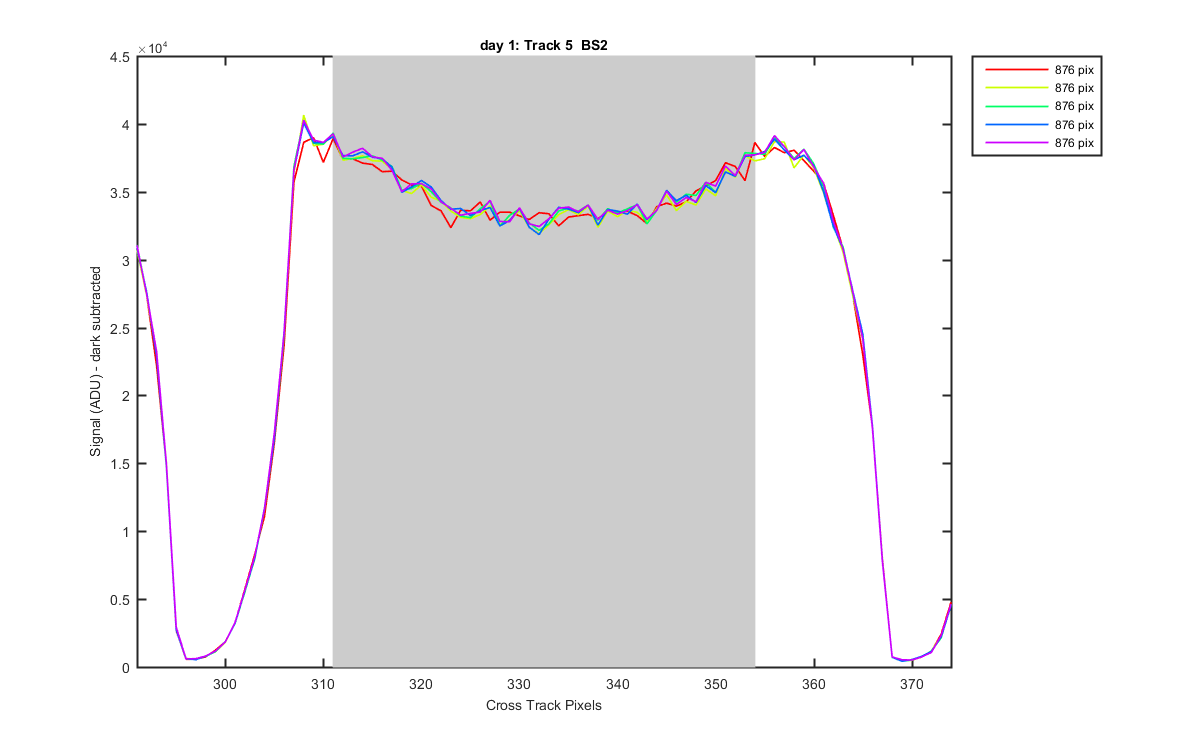
Figure 7
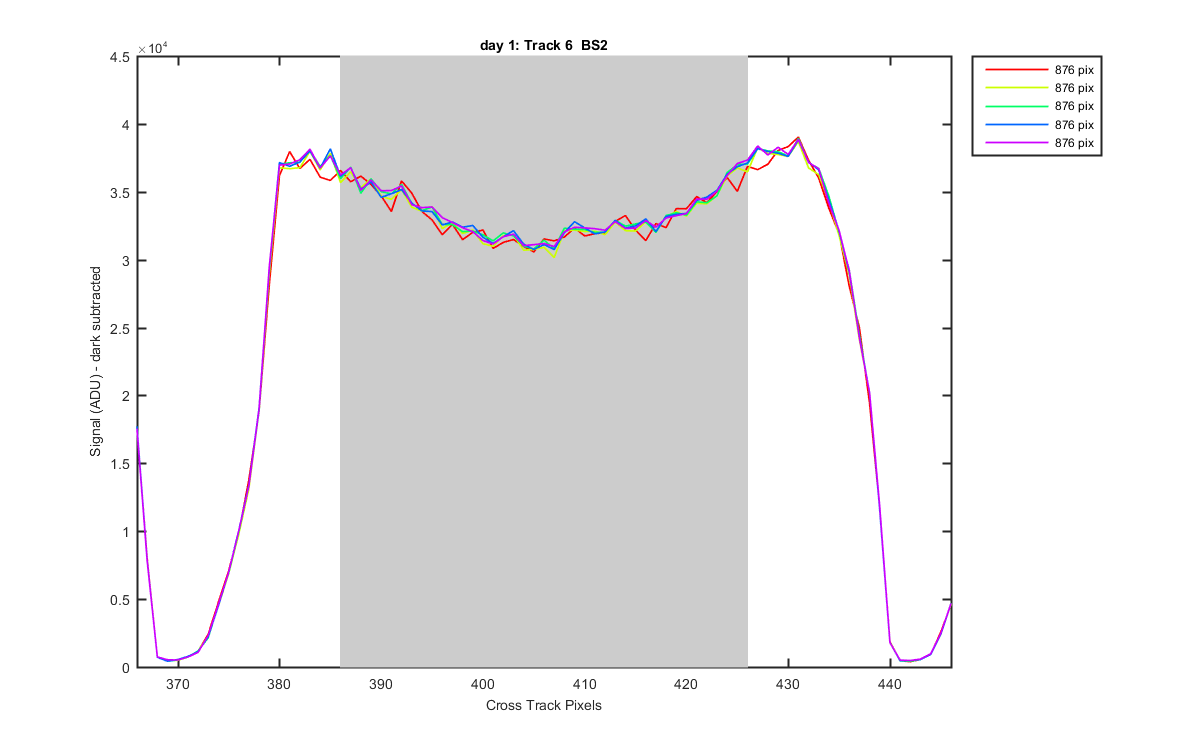
Figure 8
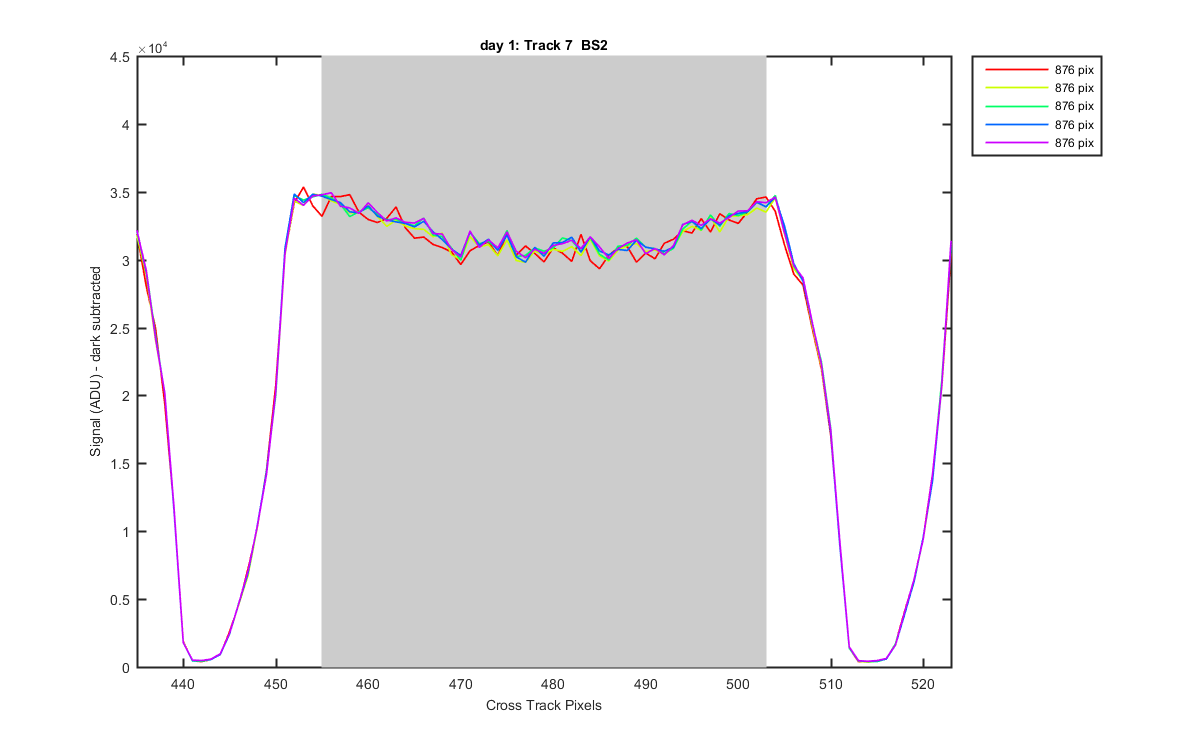
Figure 9
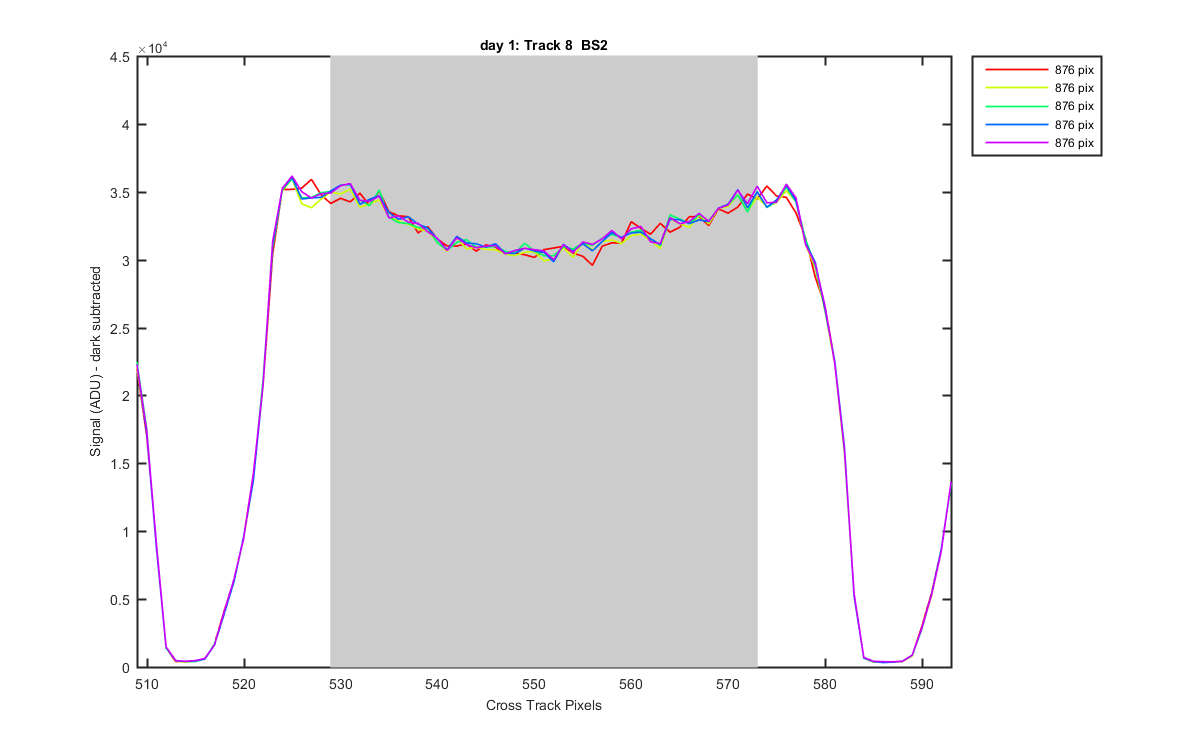
Figure 10
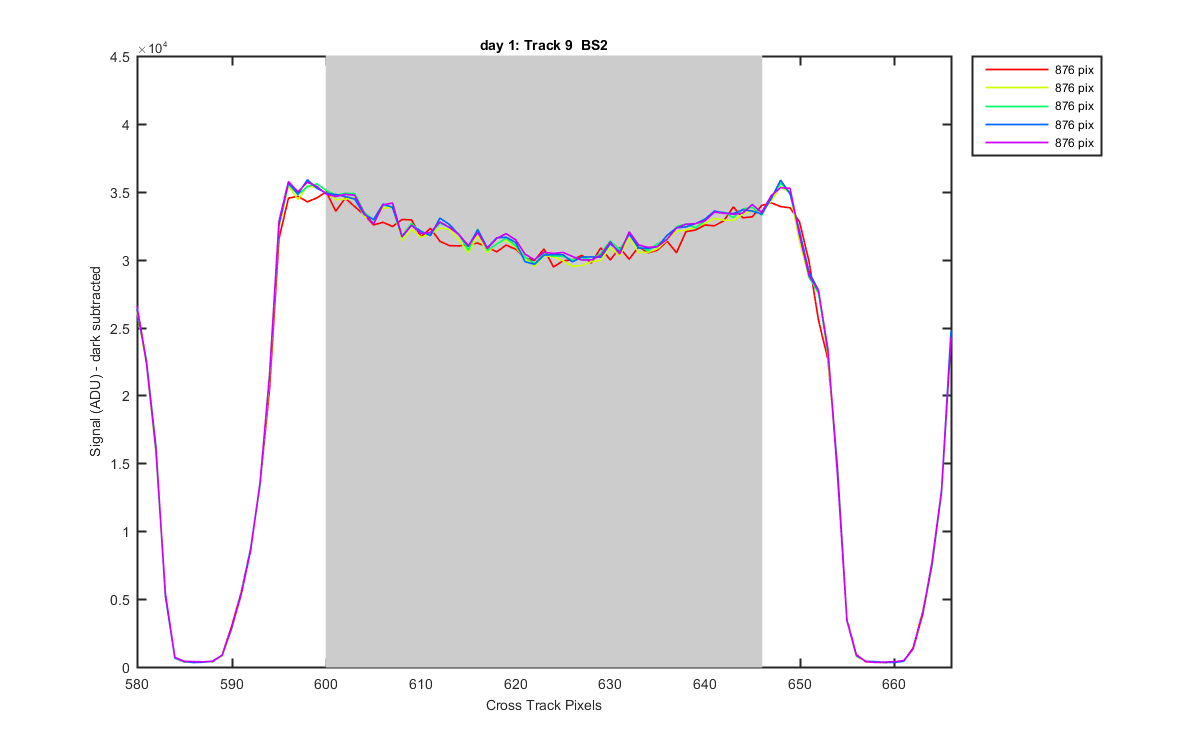
Figure 11
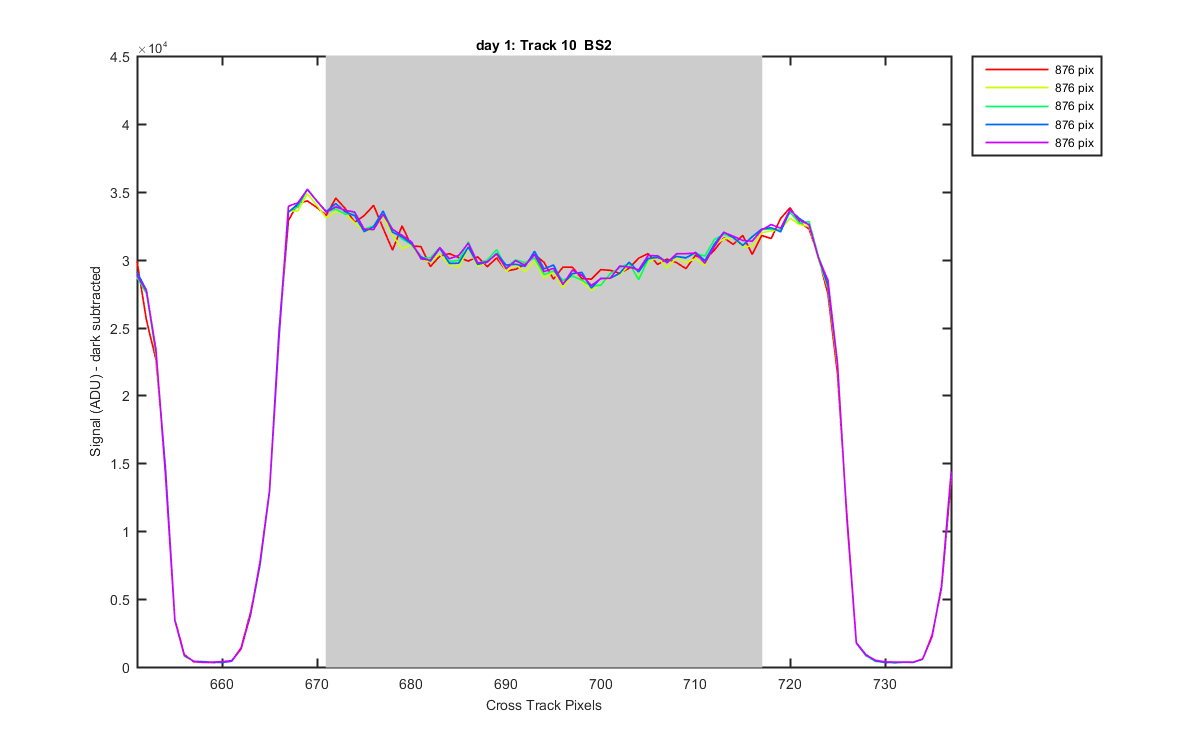
Figure 12
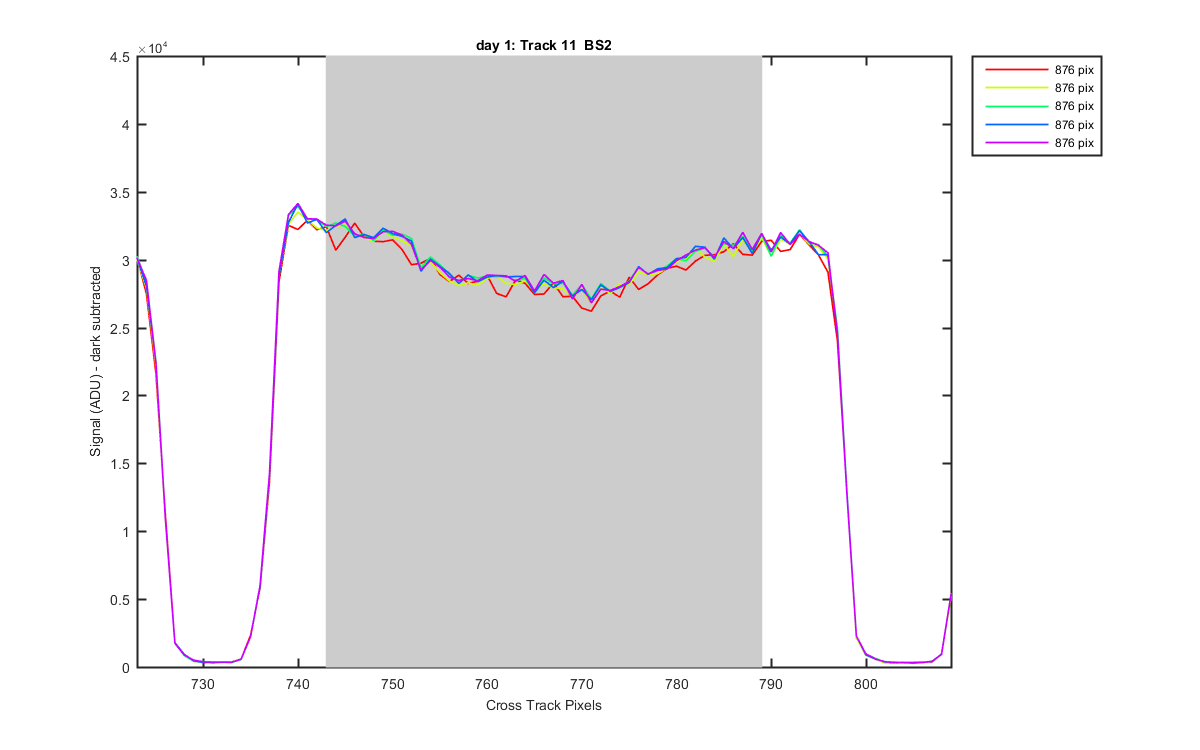
Figure 13
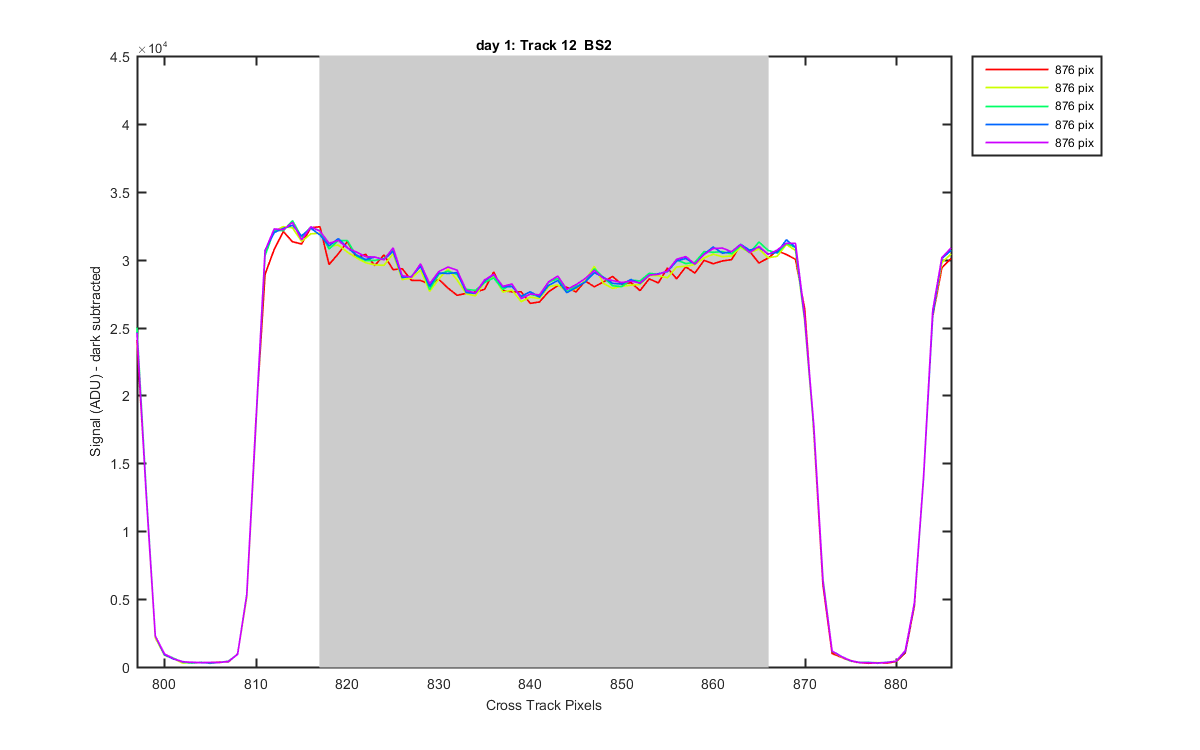
Figure 14
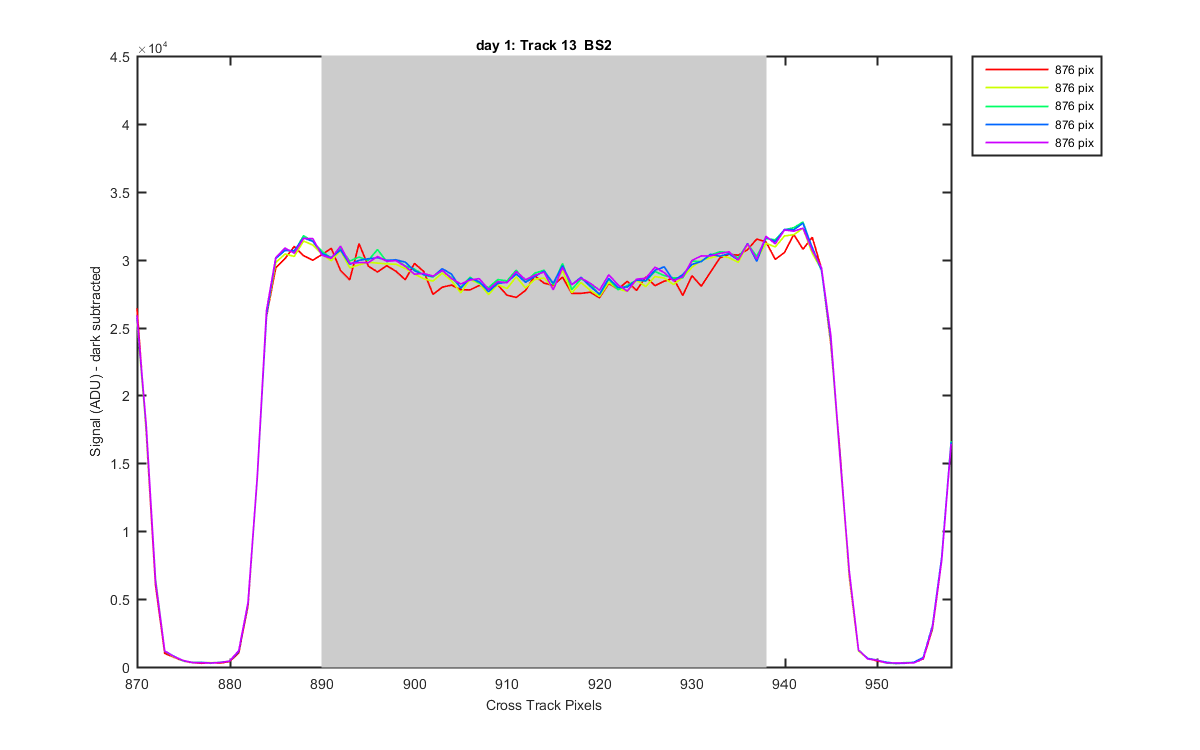
Figure 15