REVISION DATE: 10-Feb-2016 09:46:35
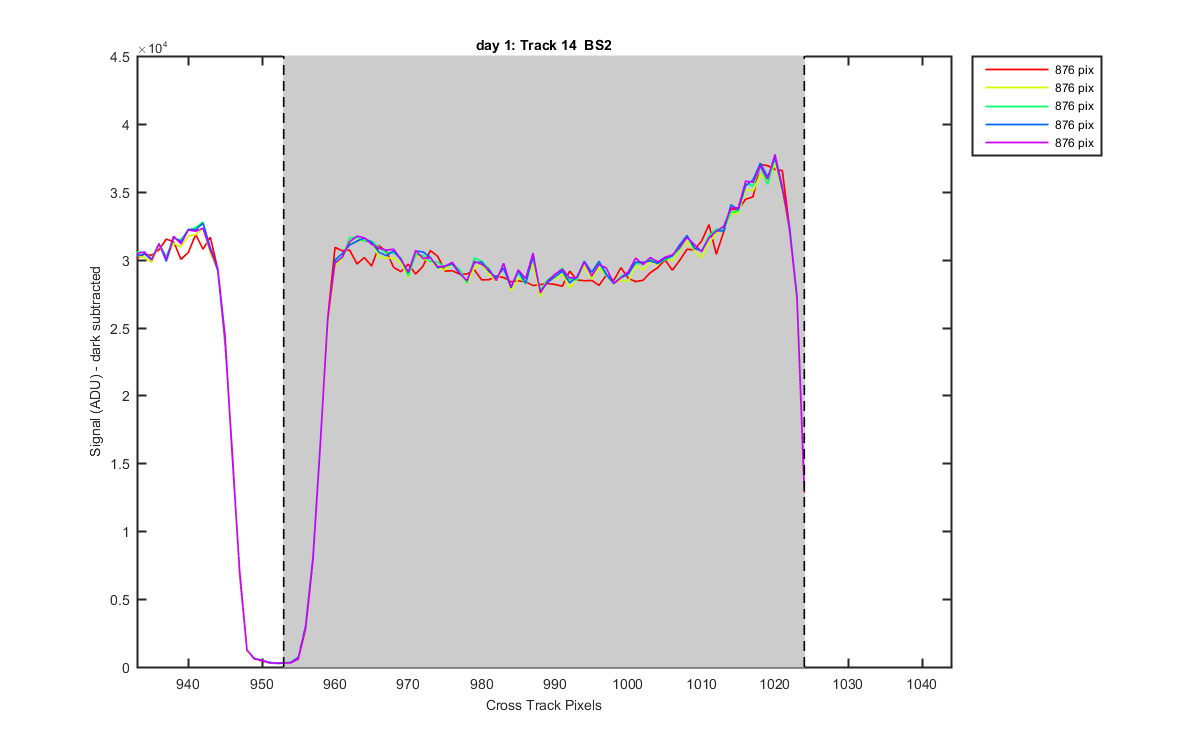
The graphs below show how I defined the tracks. Grey patches are what is averaged for each track. These are created from Oriel data, with 5 data sets.
Track pixels:
Track:  1       2       3       4       5       6       7       8       9      10      11      12      13      14
Left:   1      75     151     225     299     370     442     515     586     660     731     804     878     953
Right:  75     151     225     299     370     442     515     586     660     731     804     878     953    1024
Figure 1
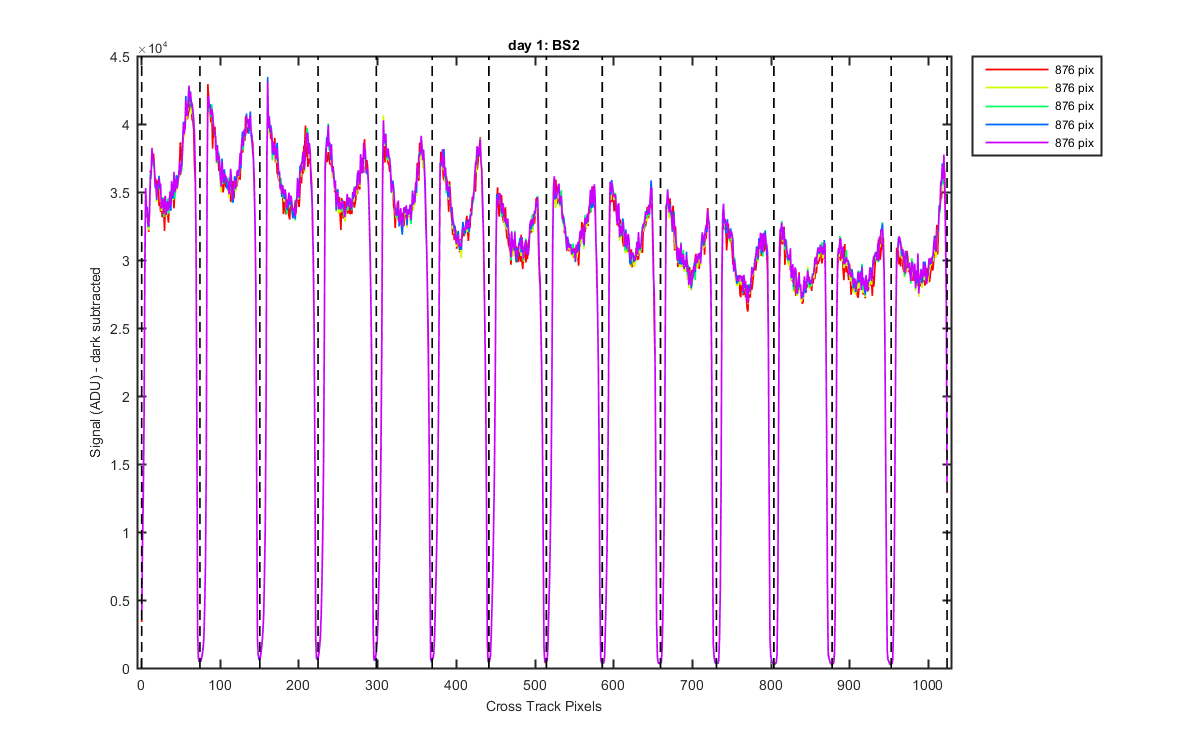
Figure 2
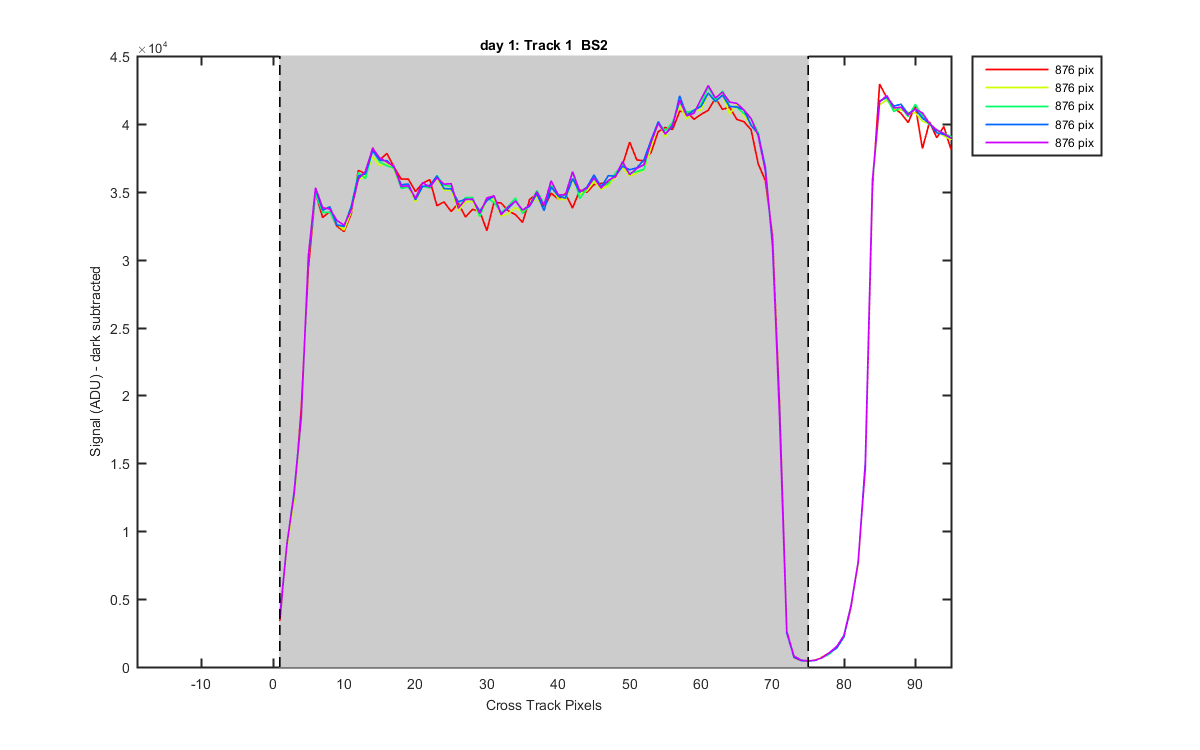
Figure 3
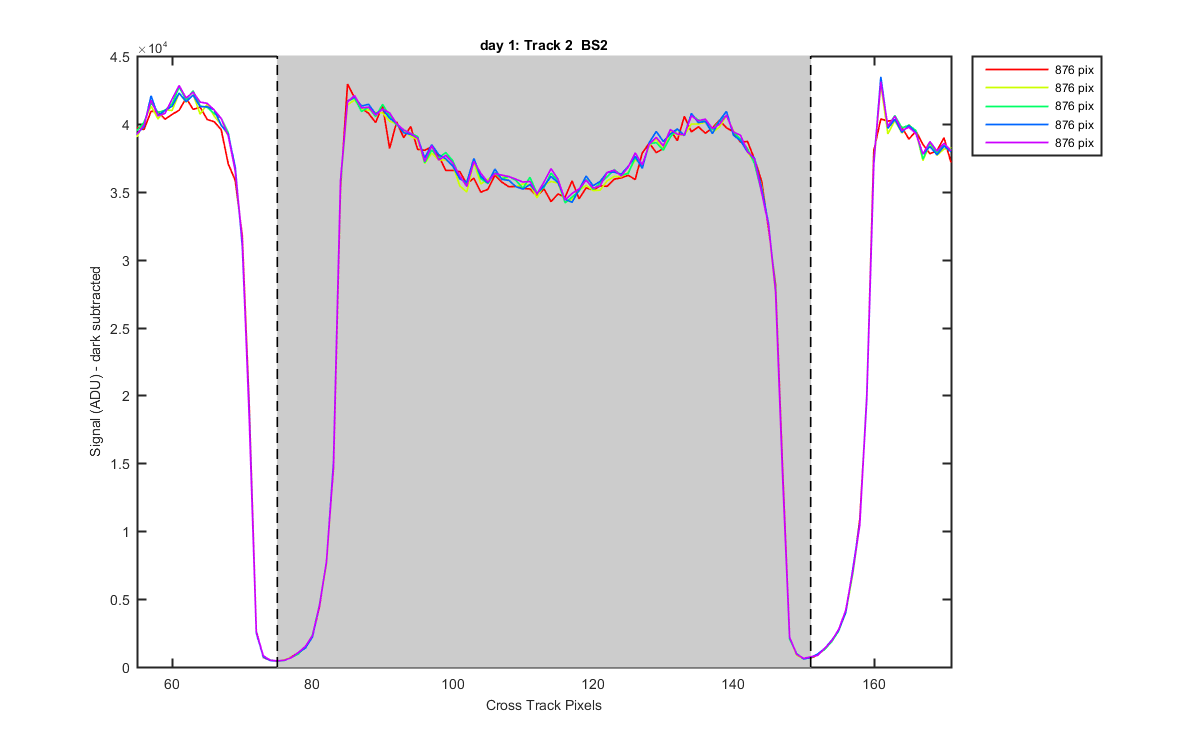
Figure 4
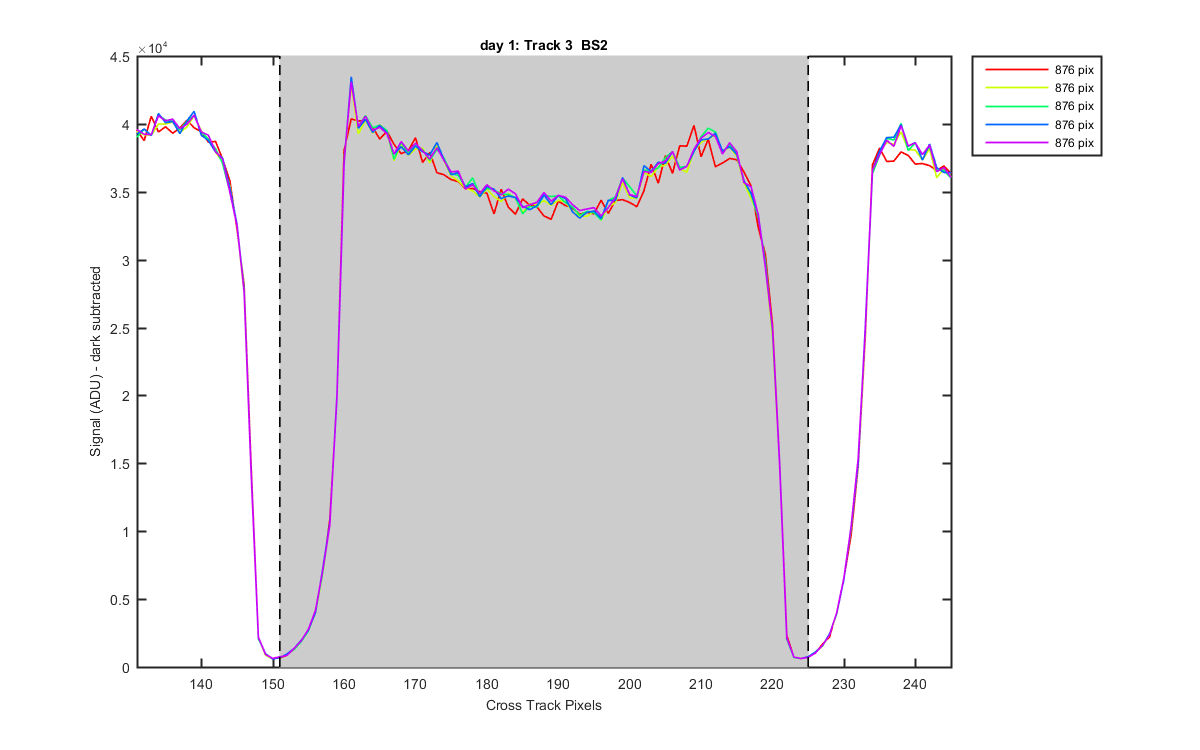
Figure 5
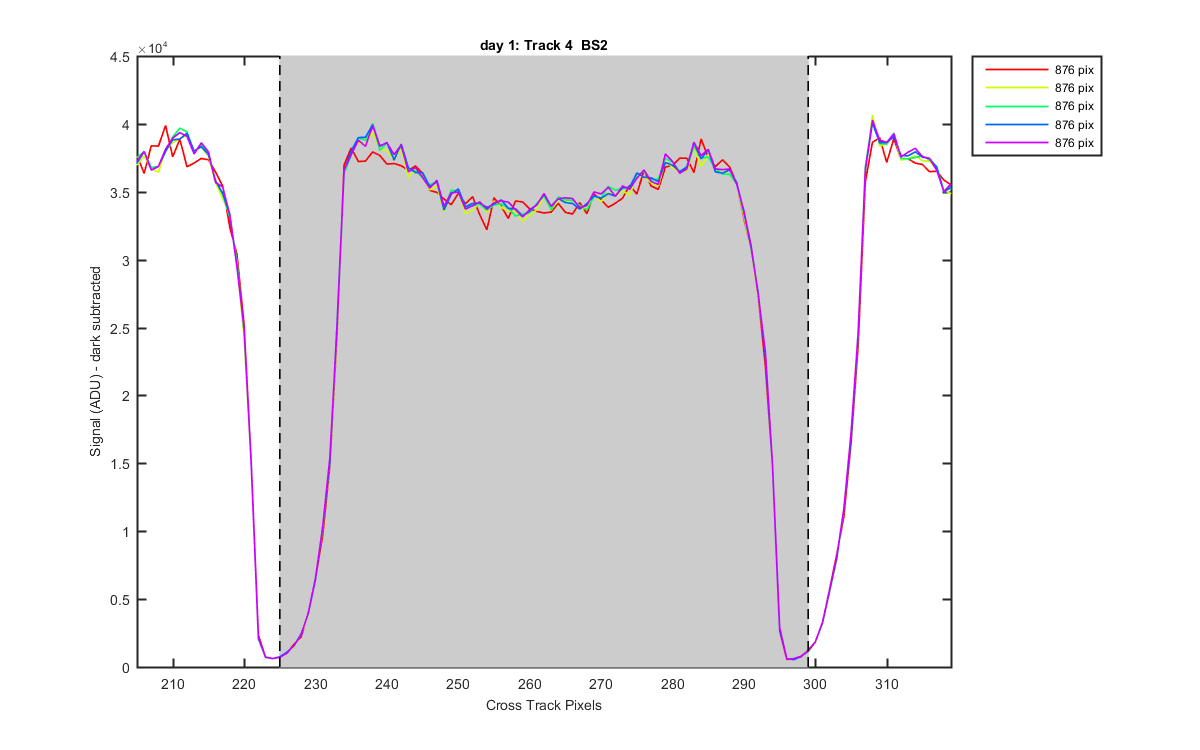
Figure 6
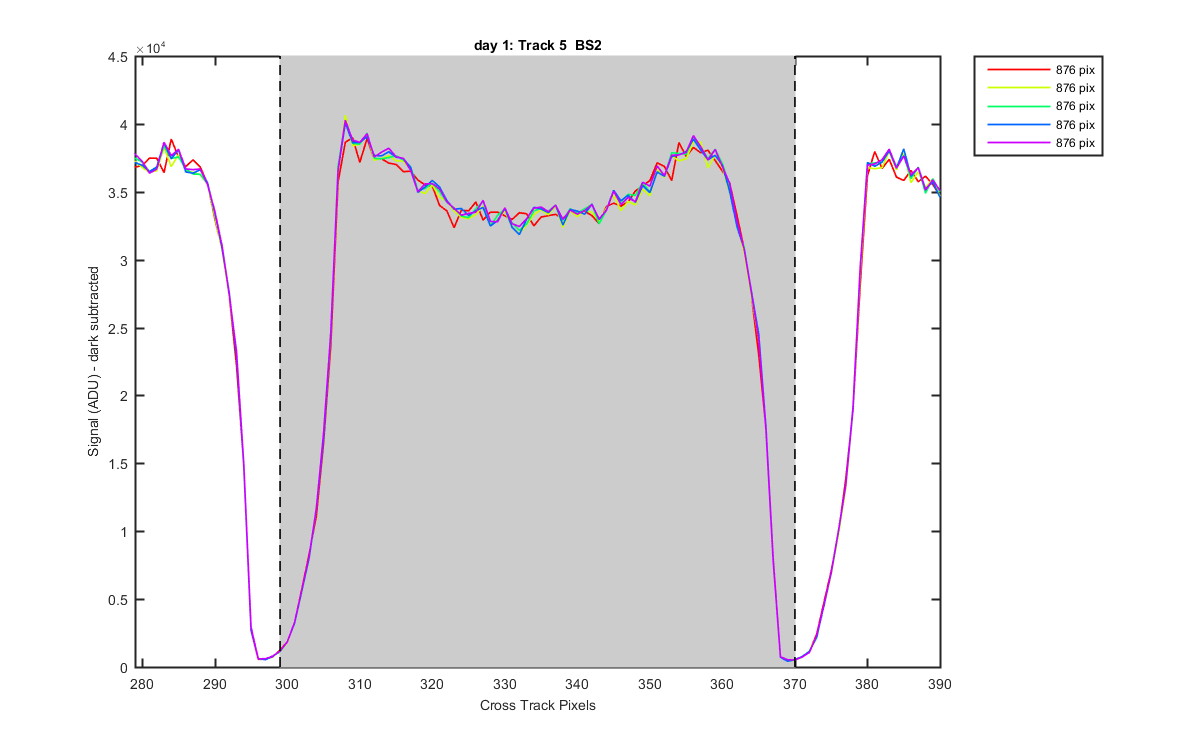
Figure 7
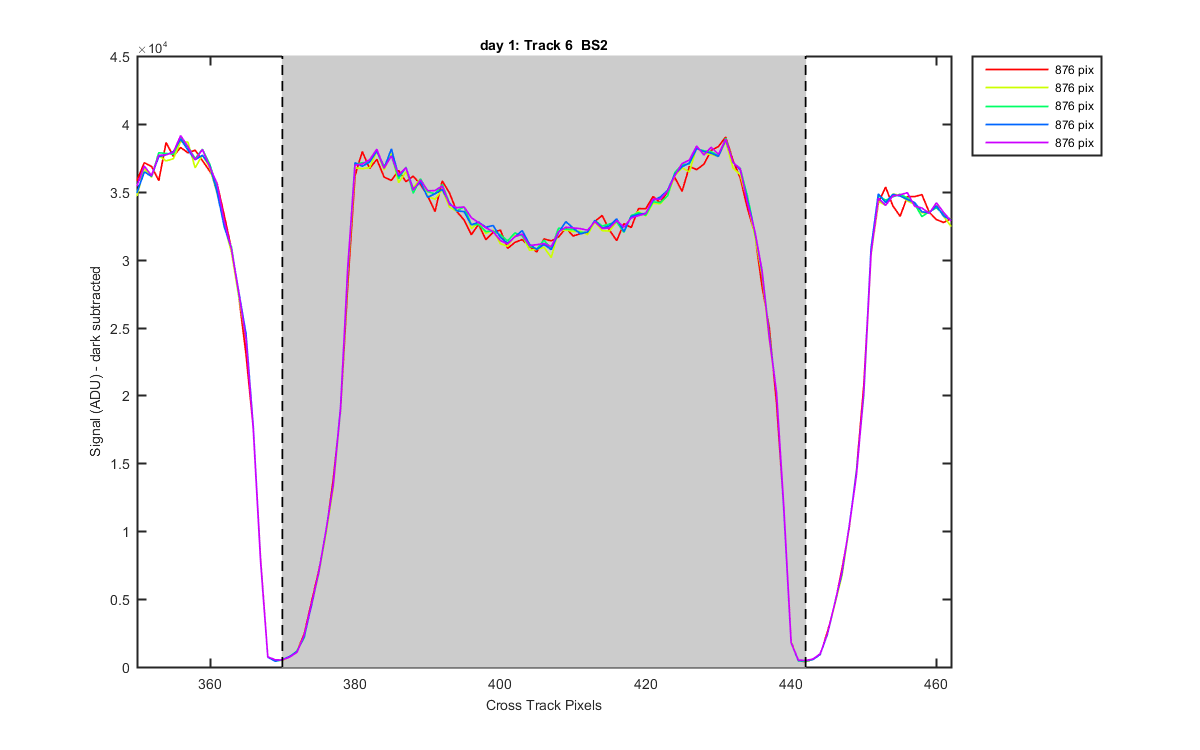
Figure 8
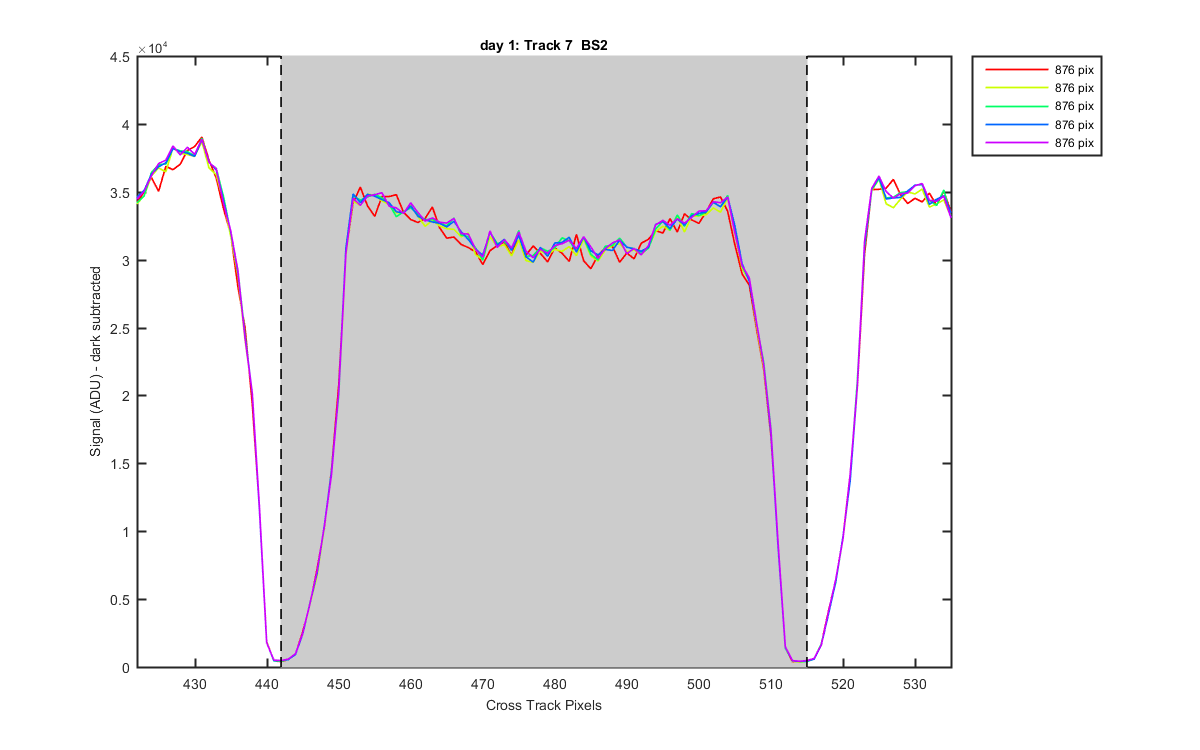
Figure 9
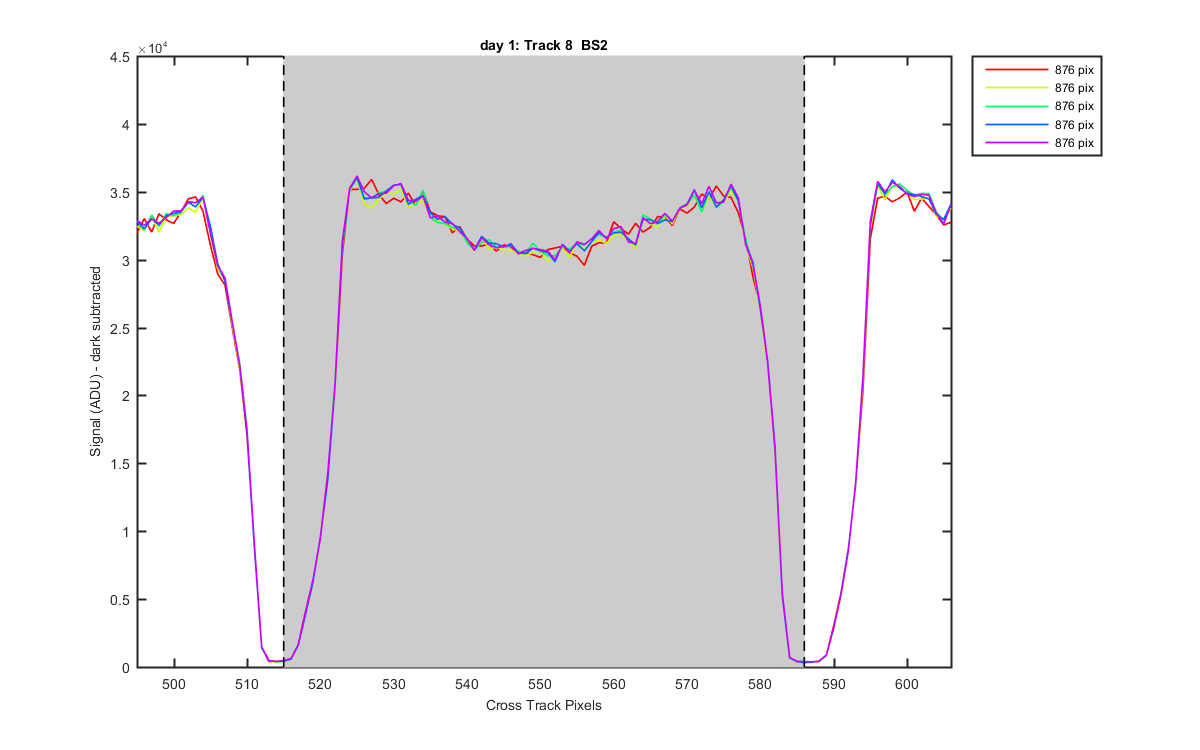
Figure 10
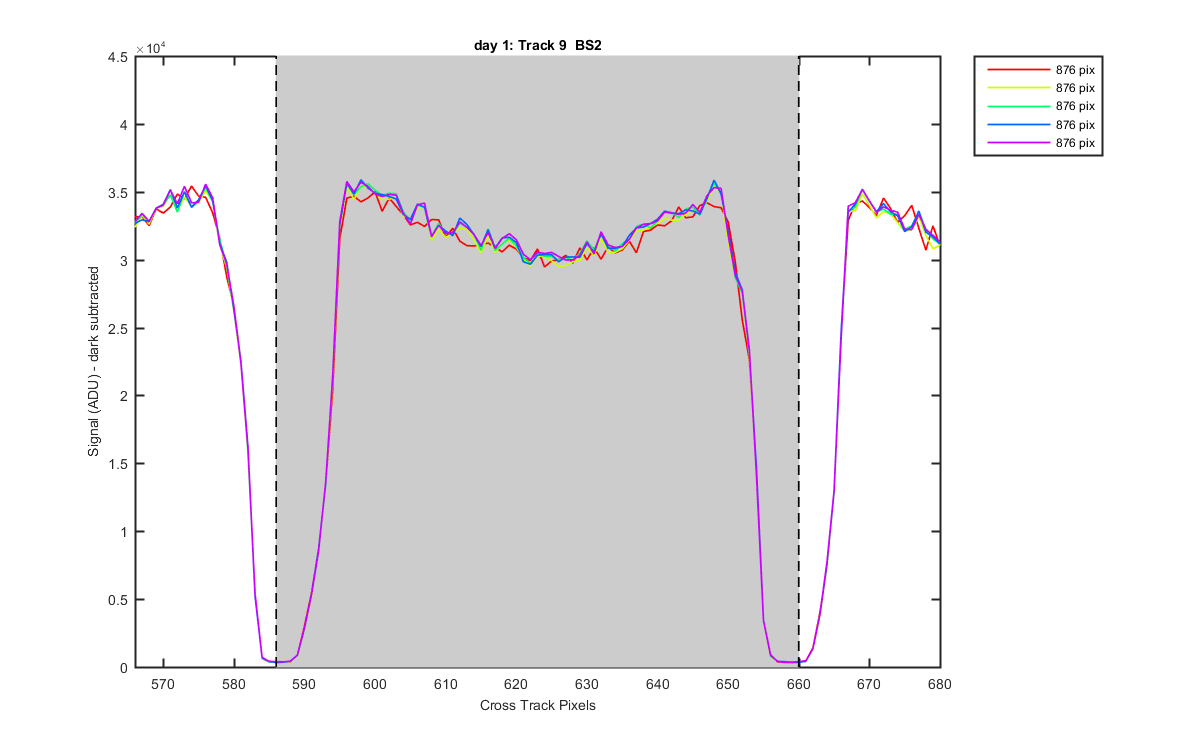
Figure 11
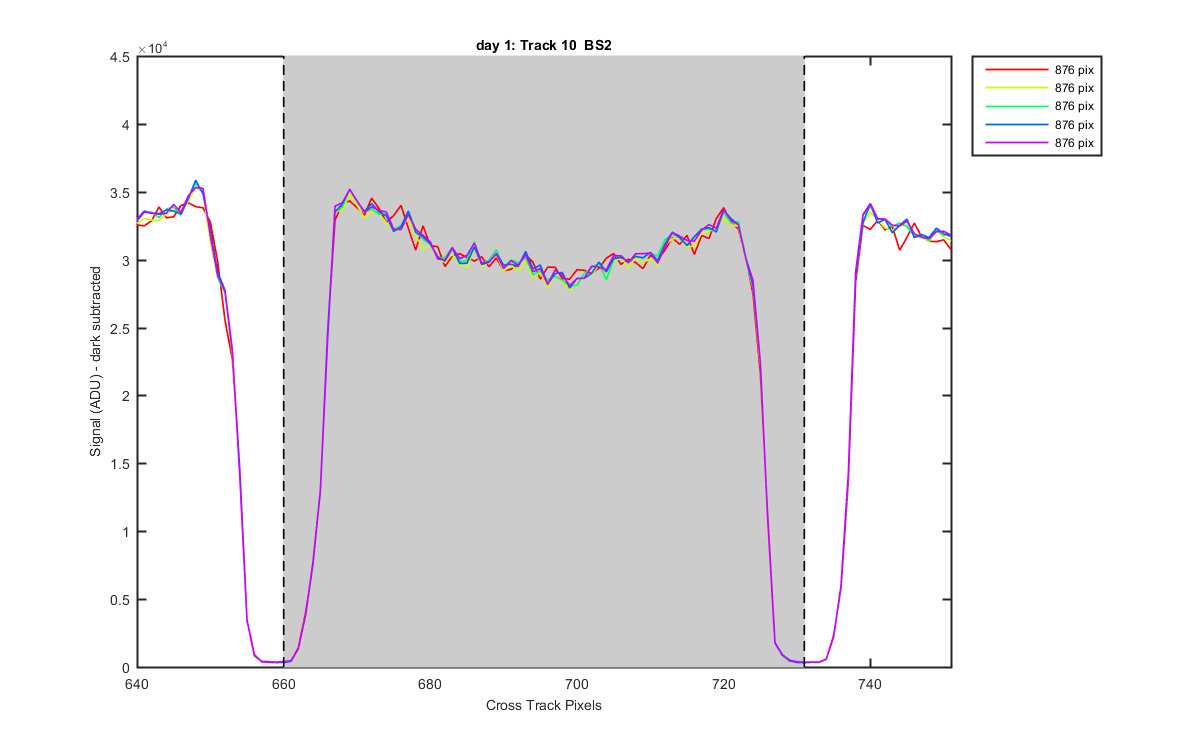
Figure 12
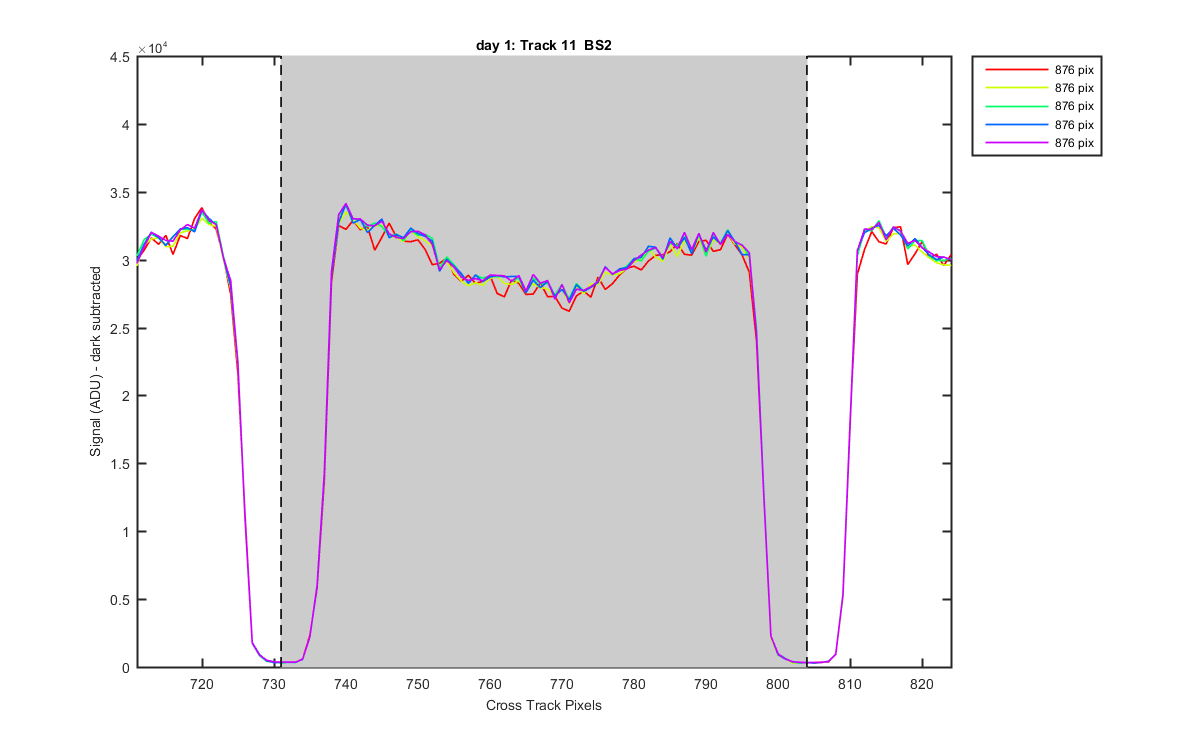
Figure 13
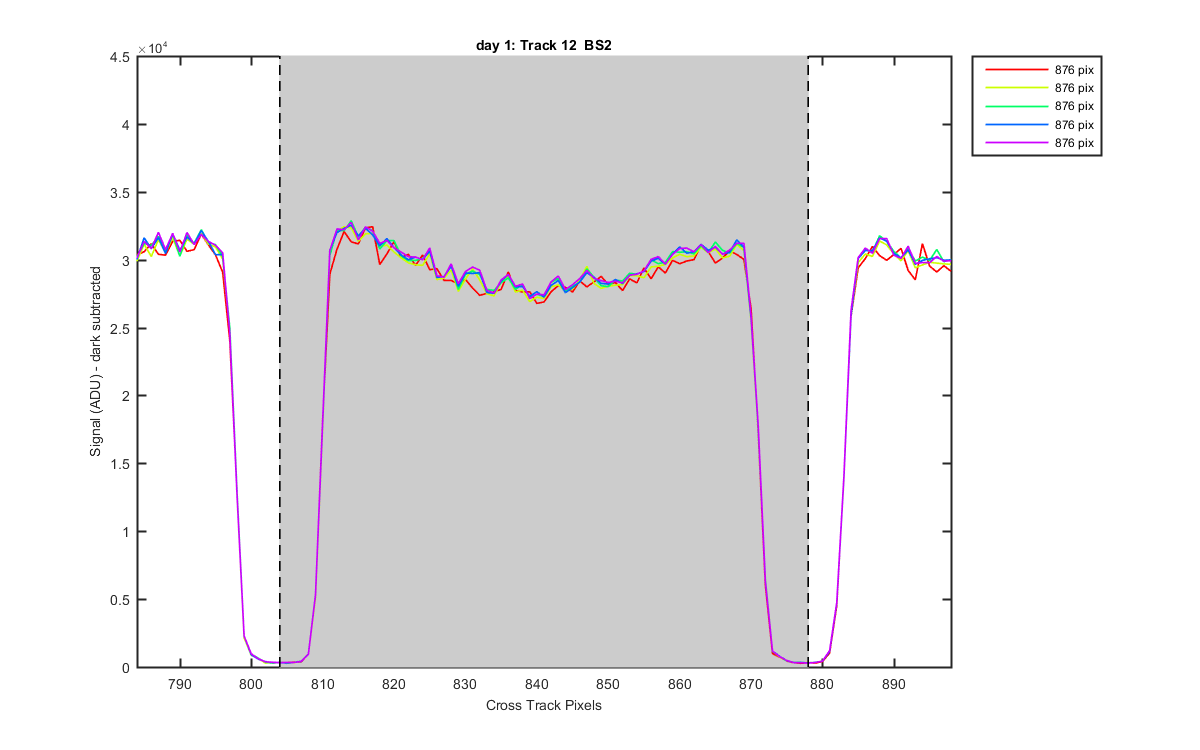
Figure 14
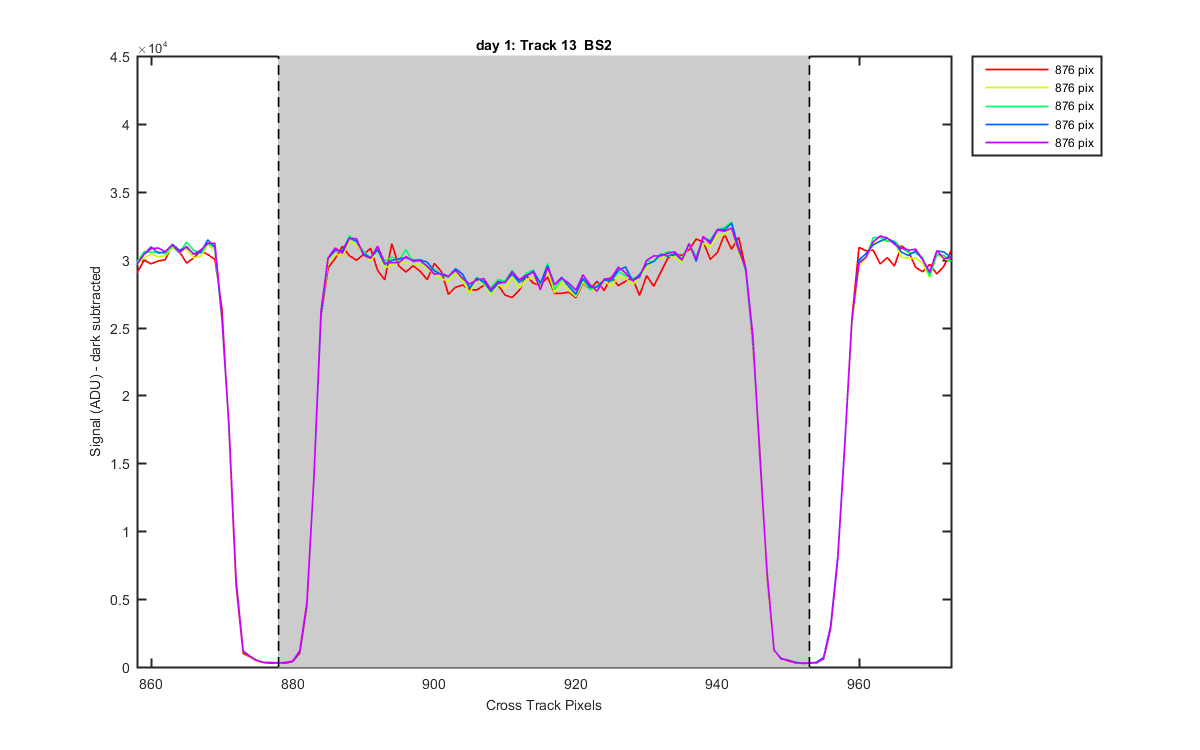
Figure 15