REVISION DATE: 10-Feb-2016 20:07:51
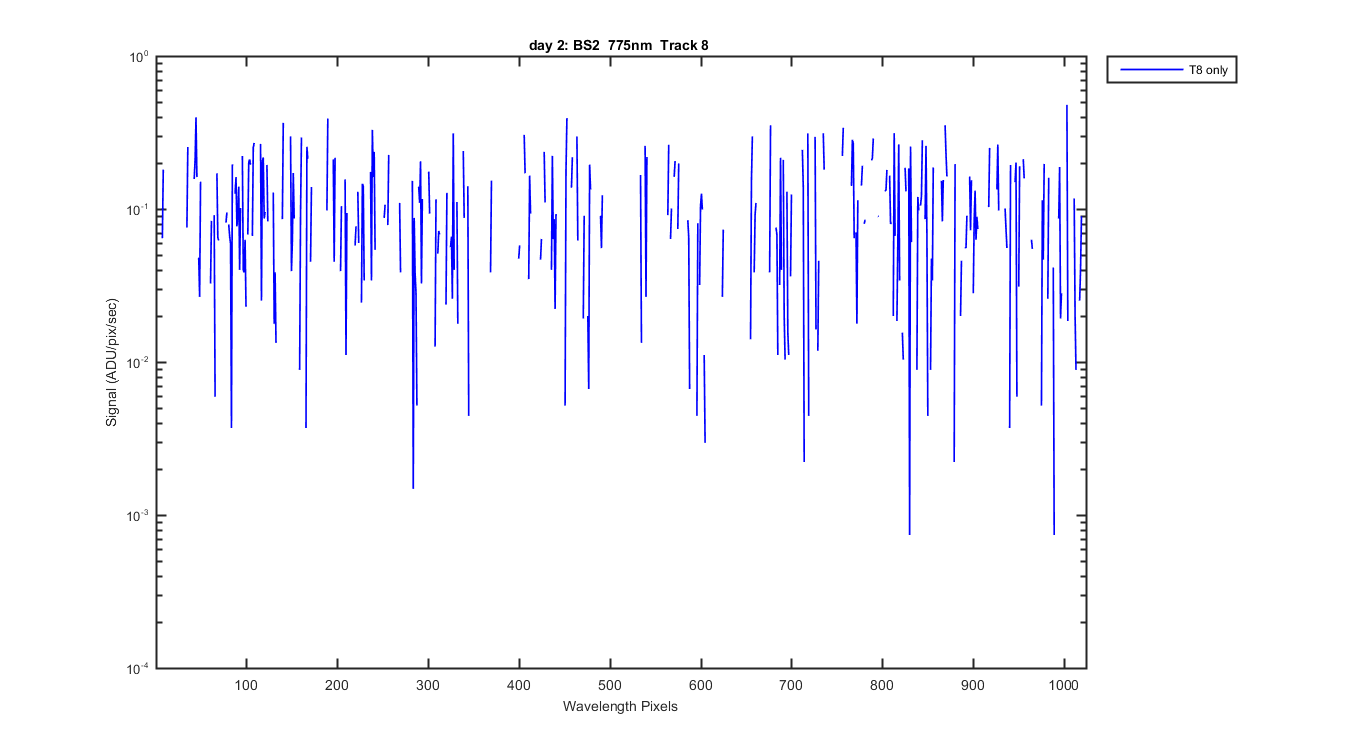
This shows the laser data collected by Mike on day 2. Data was collected with only track 8 on. Mike spent some time trying to pin down the 2nd order signal, via laser lines between 339 to 360 nm. The rest of todays lines fill in Kens request for "300-800, every 25 or 50 nm or so". There is still a lot of signal coming from off the UV end of the CCD. I thought the new filter was suppose to take care of that?
Figure 1
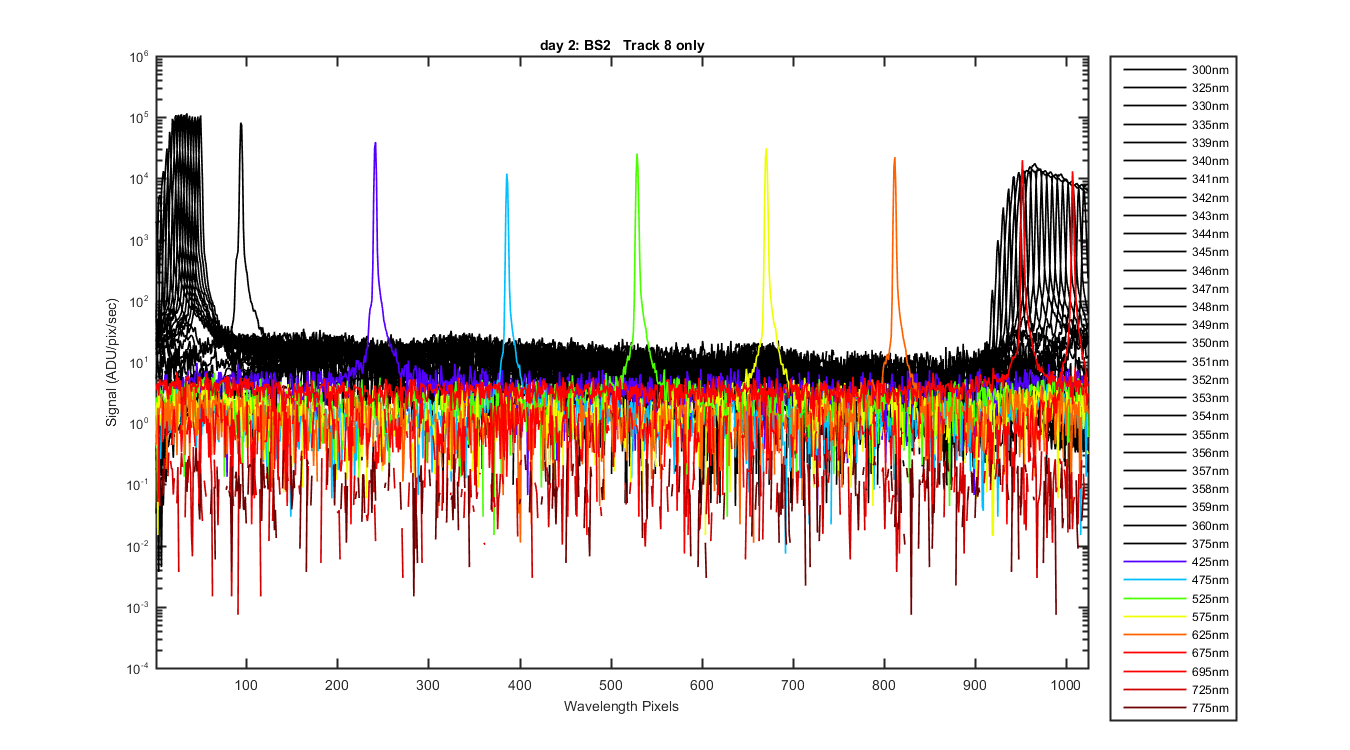
Figure 2
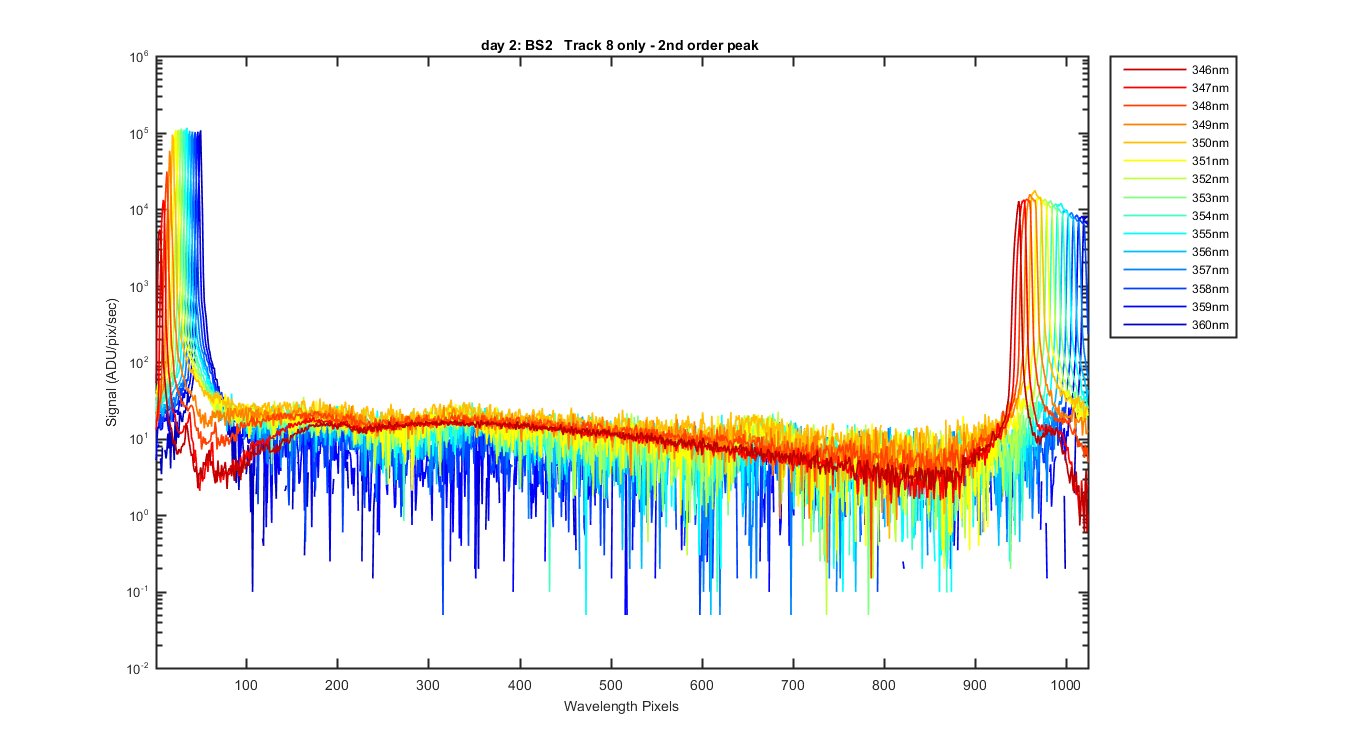
Figure 3
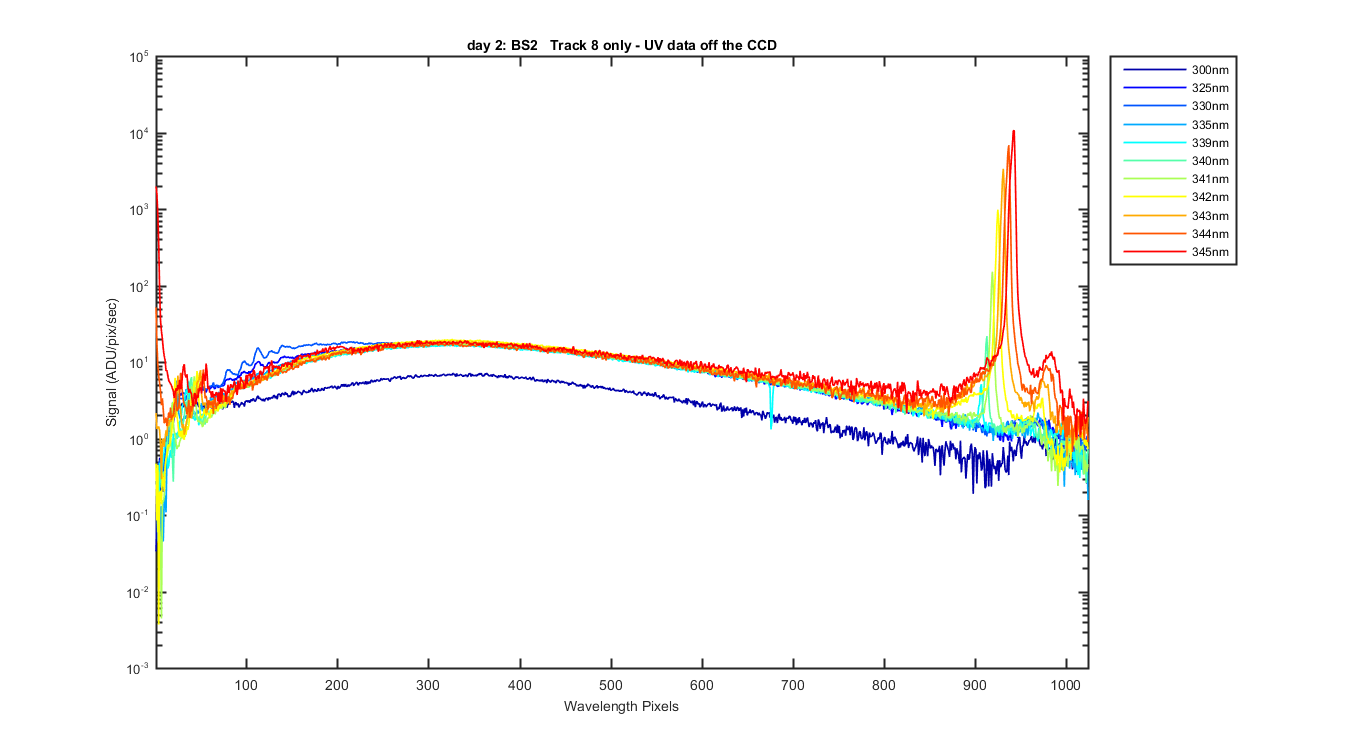
Figure 4
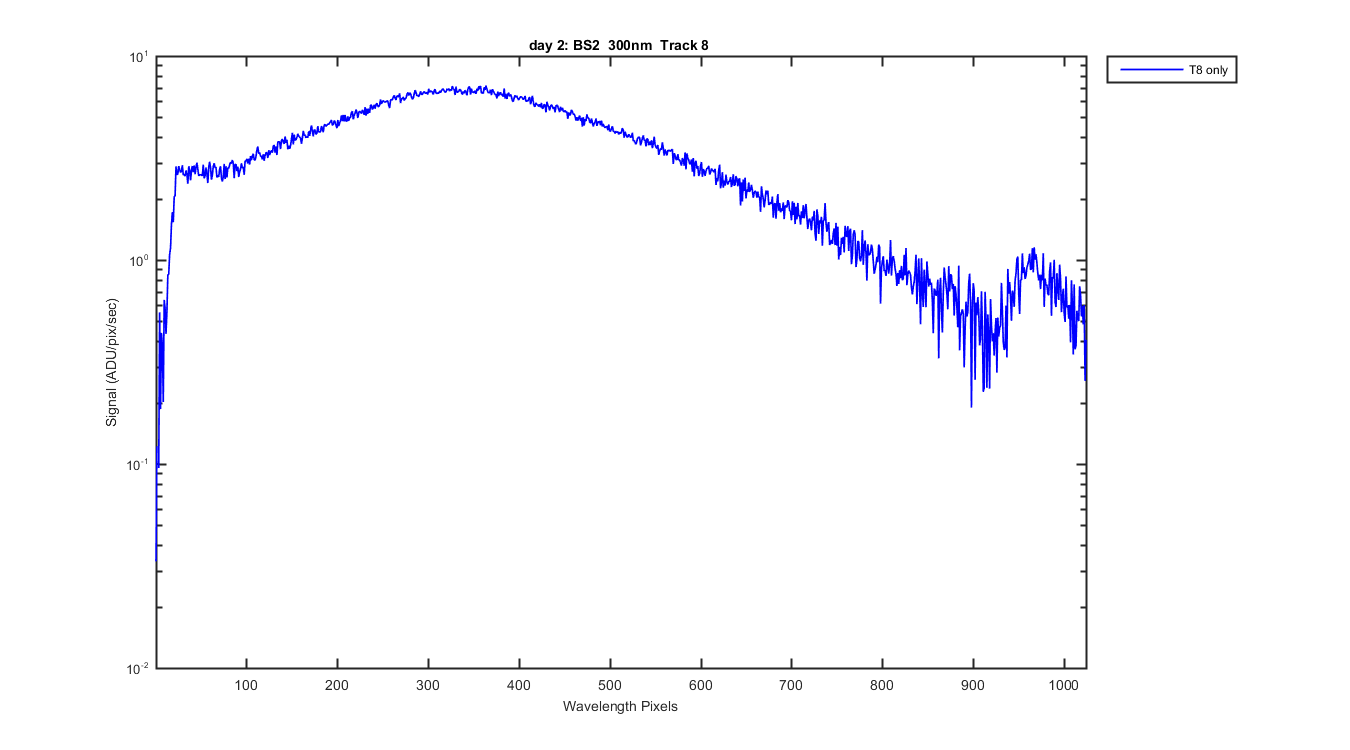
Figure 5
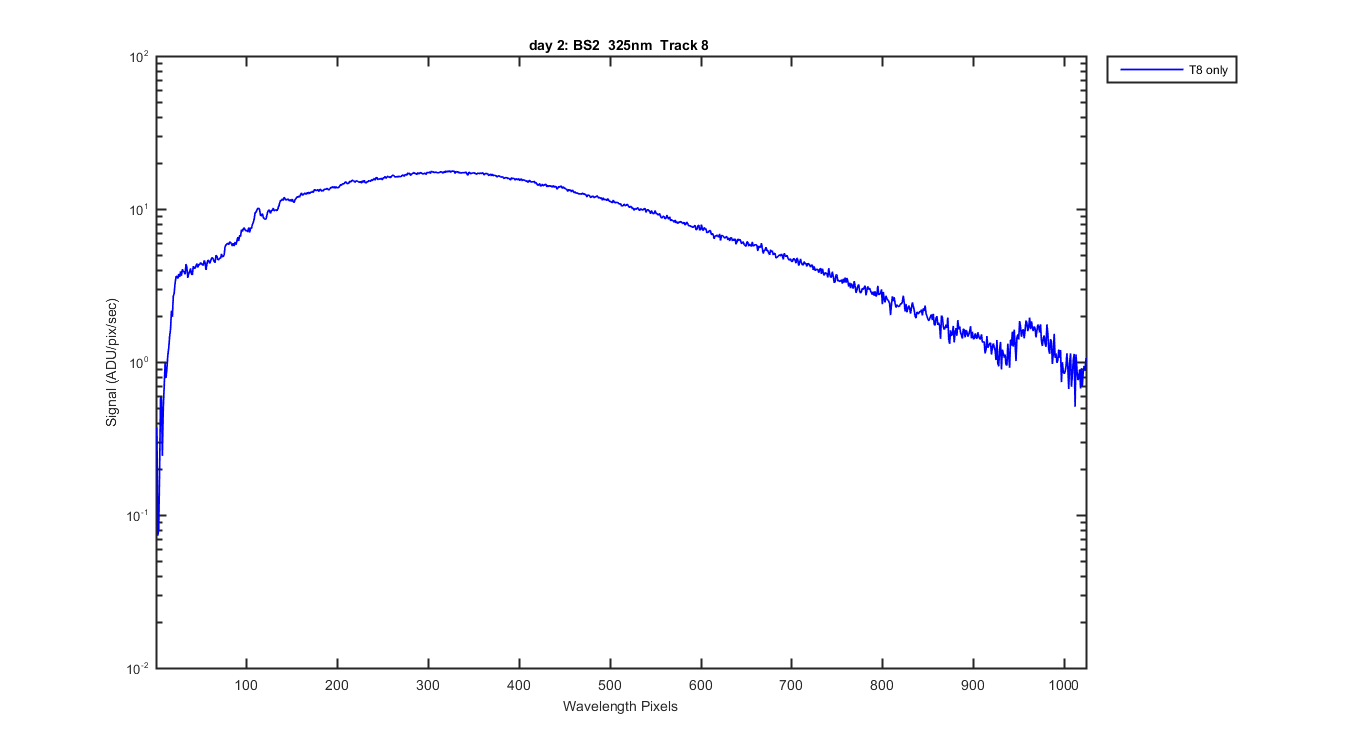
Figure 6

Figure 7
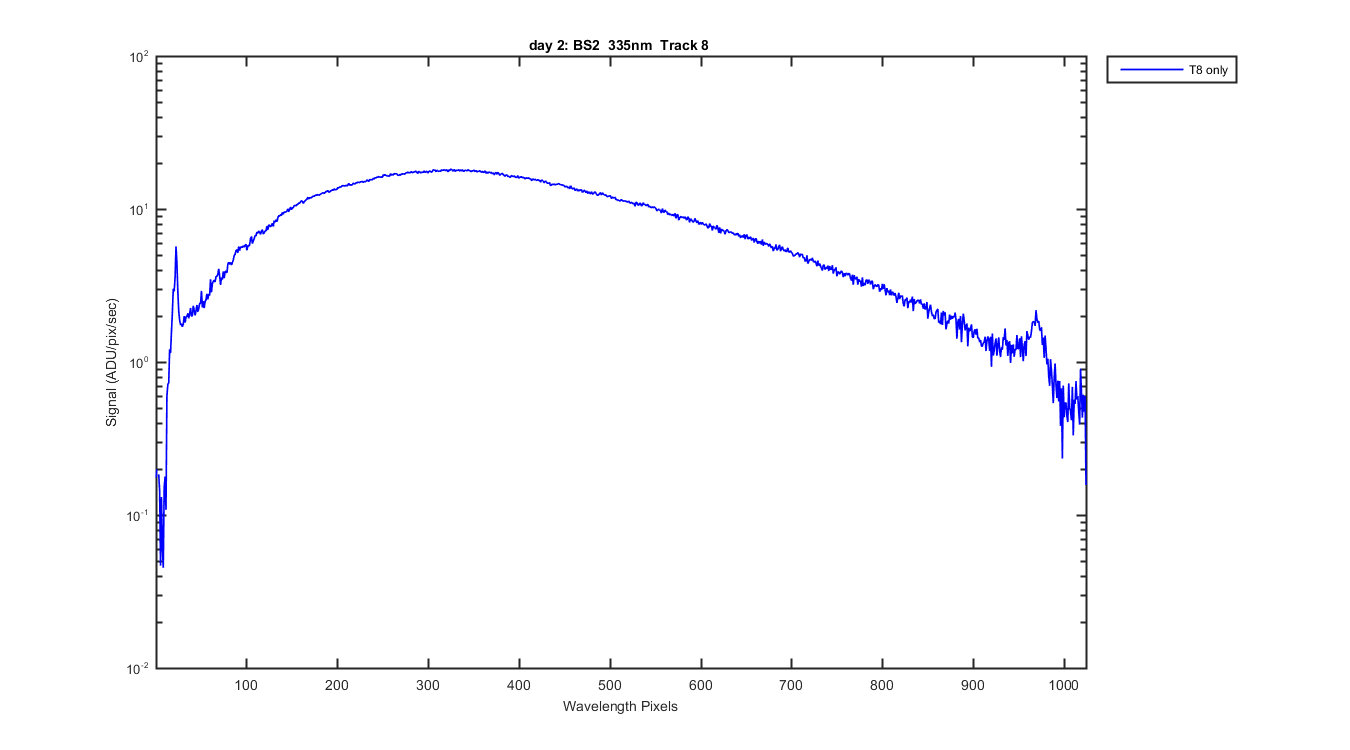
Figure 8
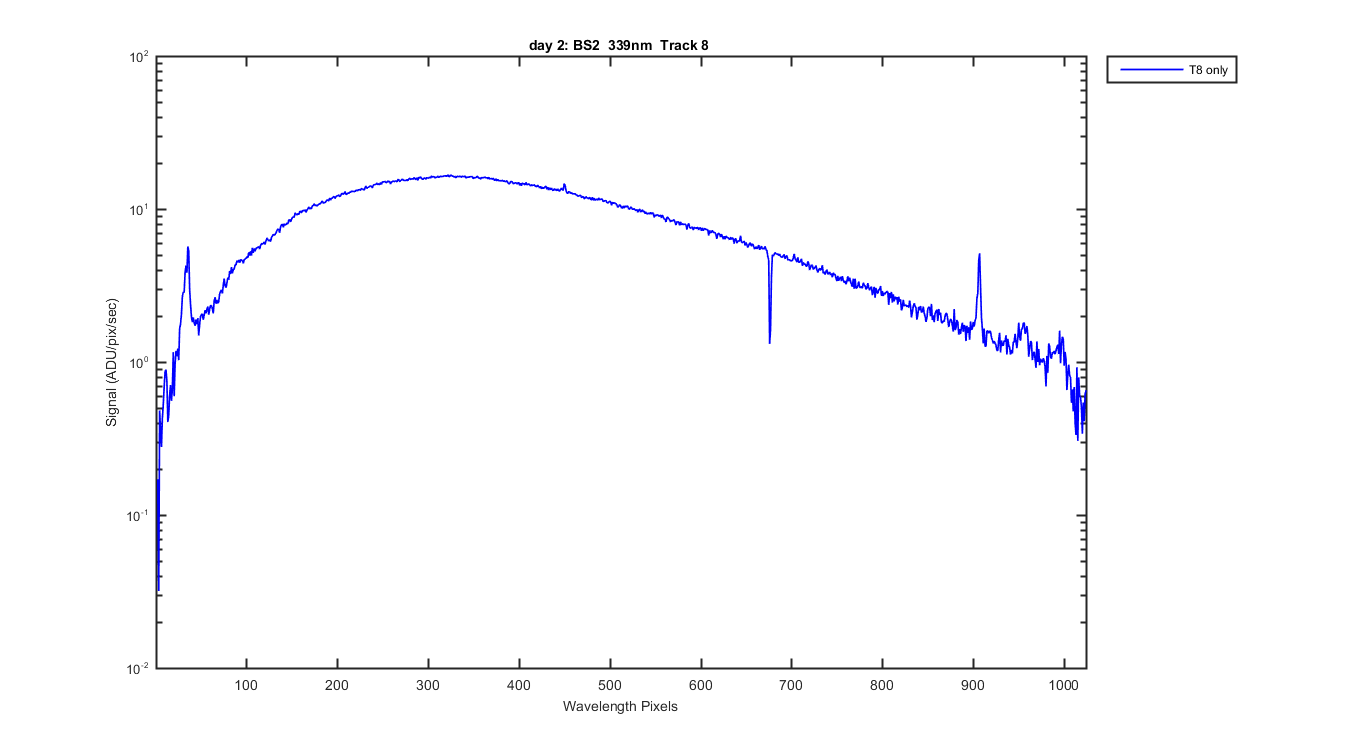
Figure 9
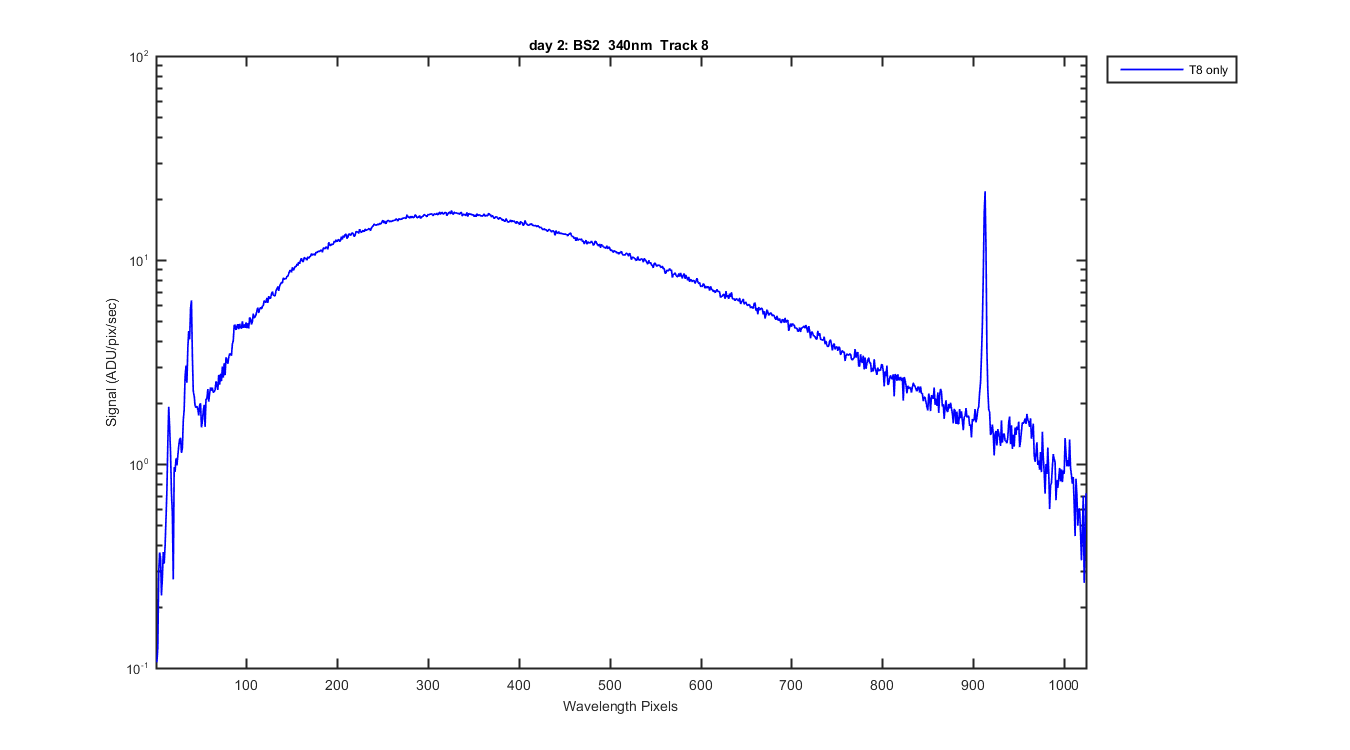
Figure 10
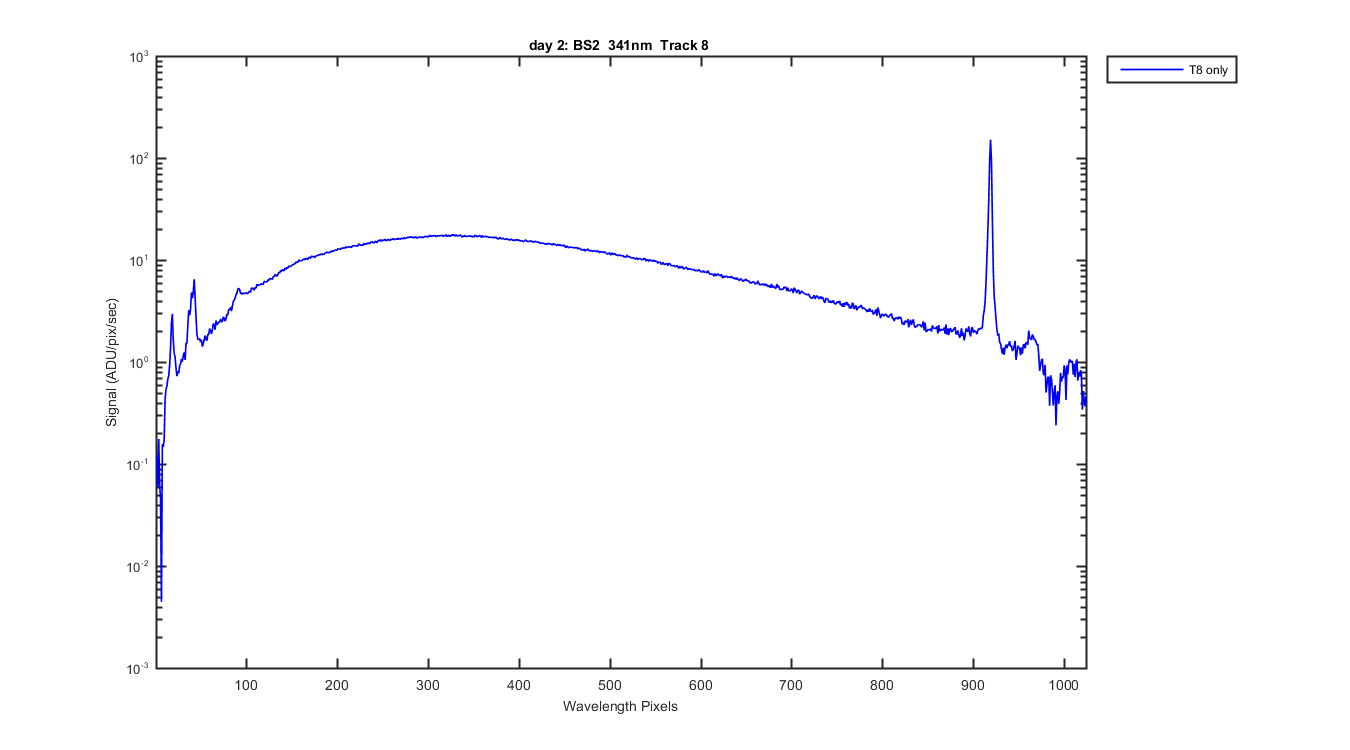
Figure 11
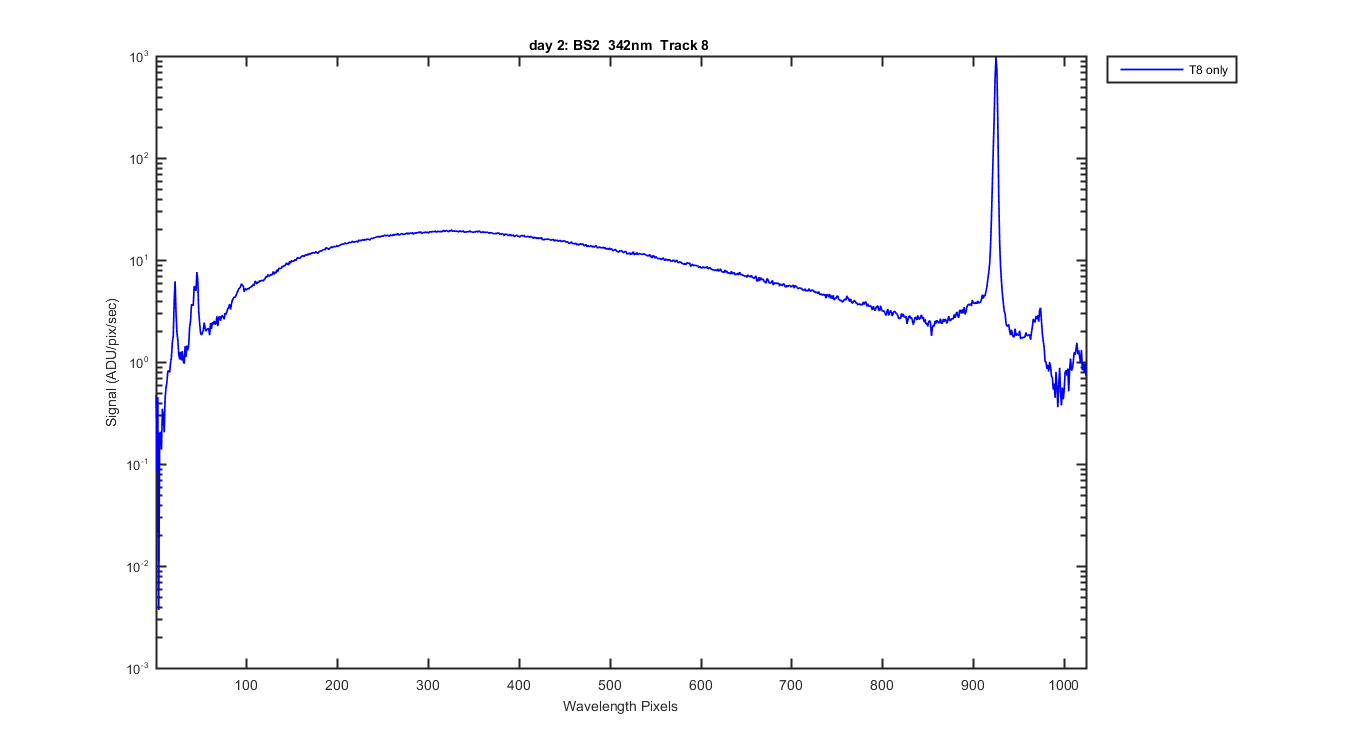
Figure 12
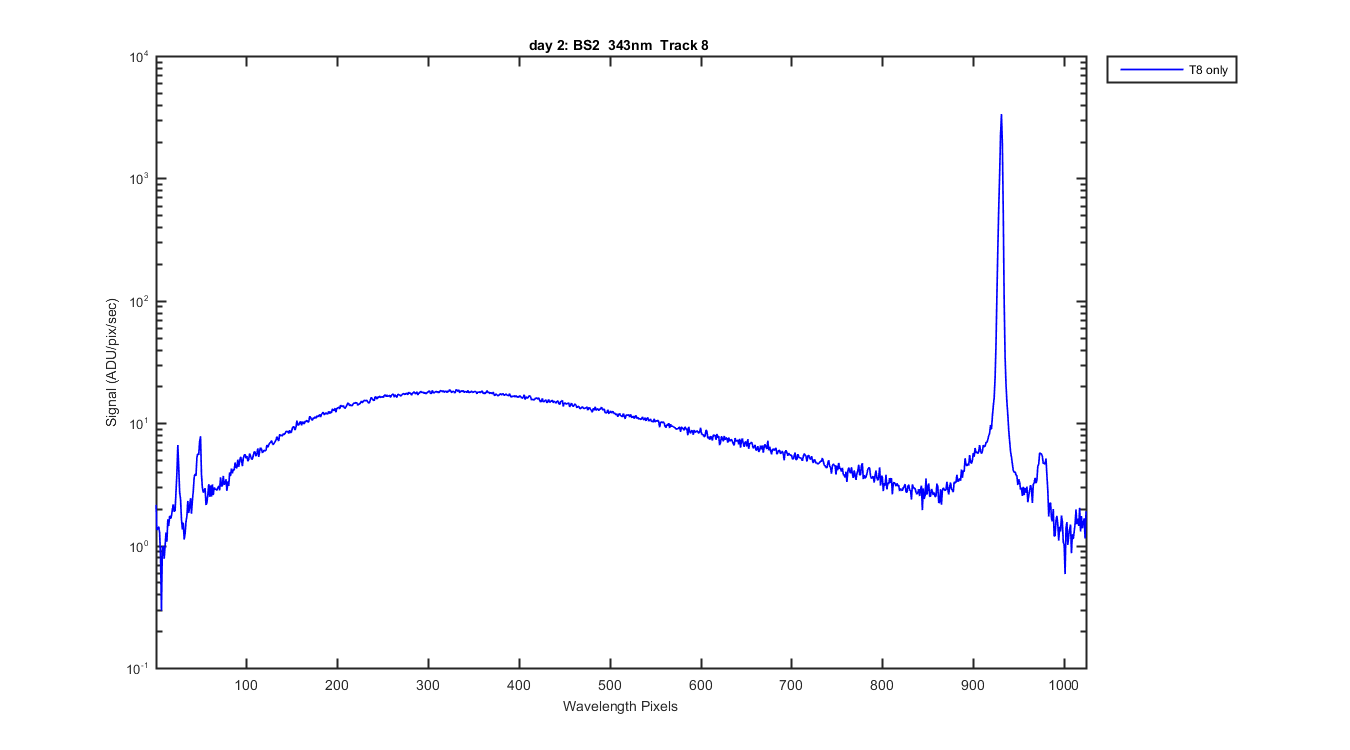
Figure 13
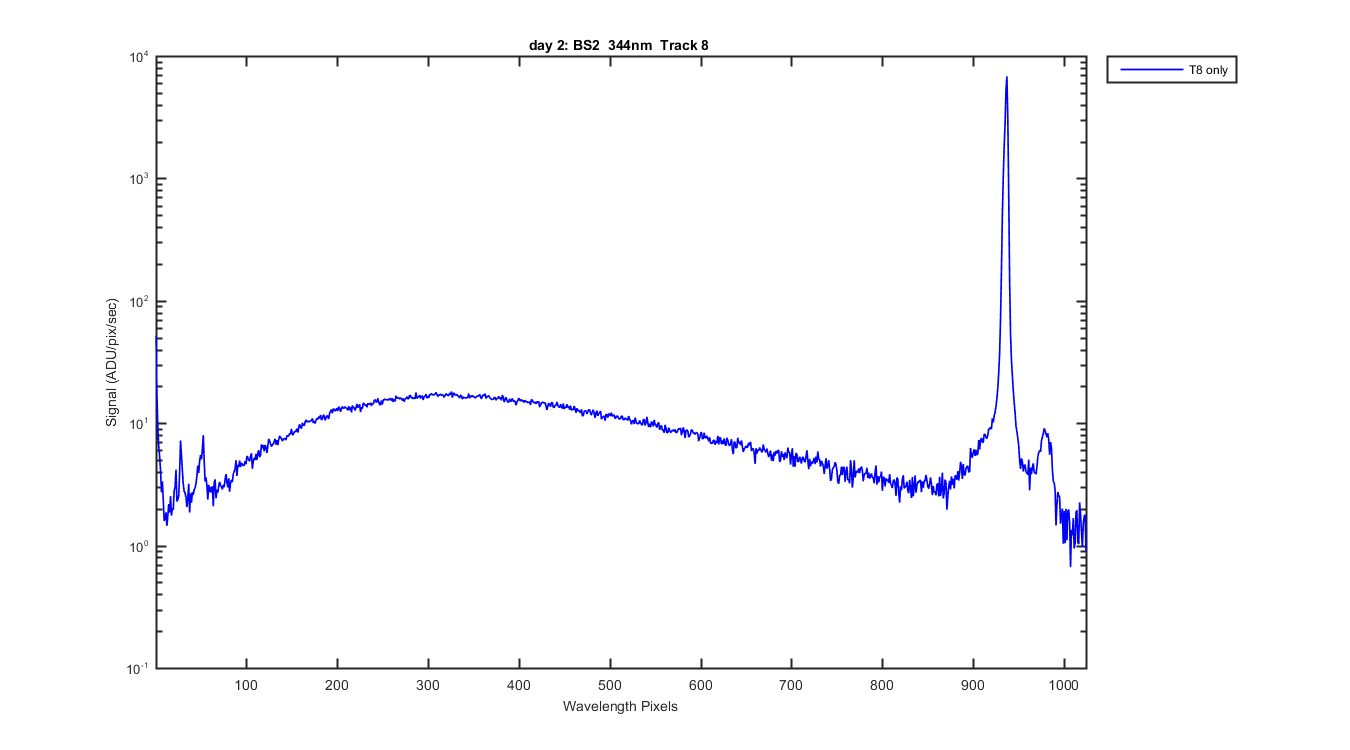
Figure 14
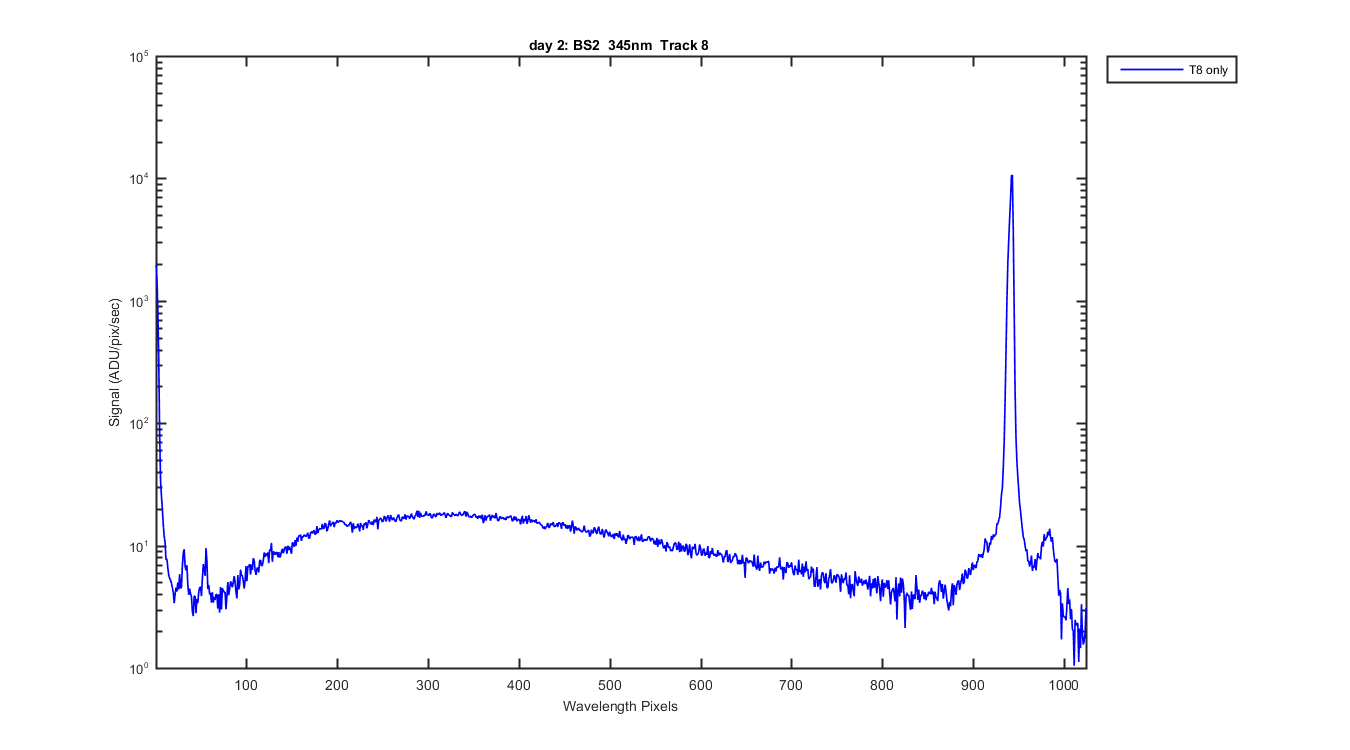
Figure 15
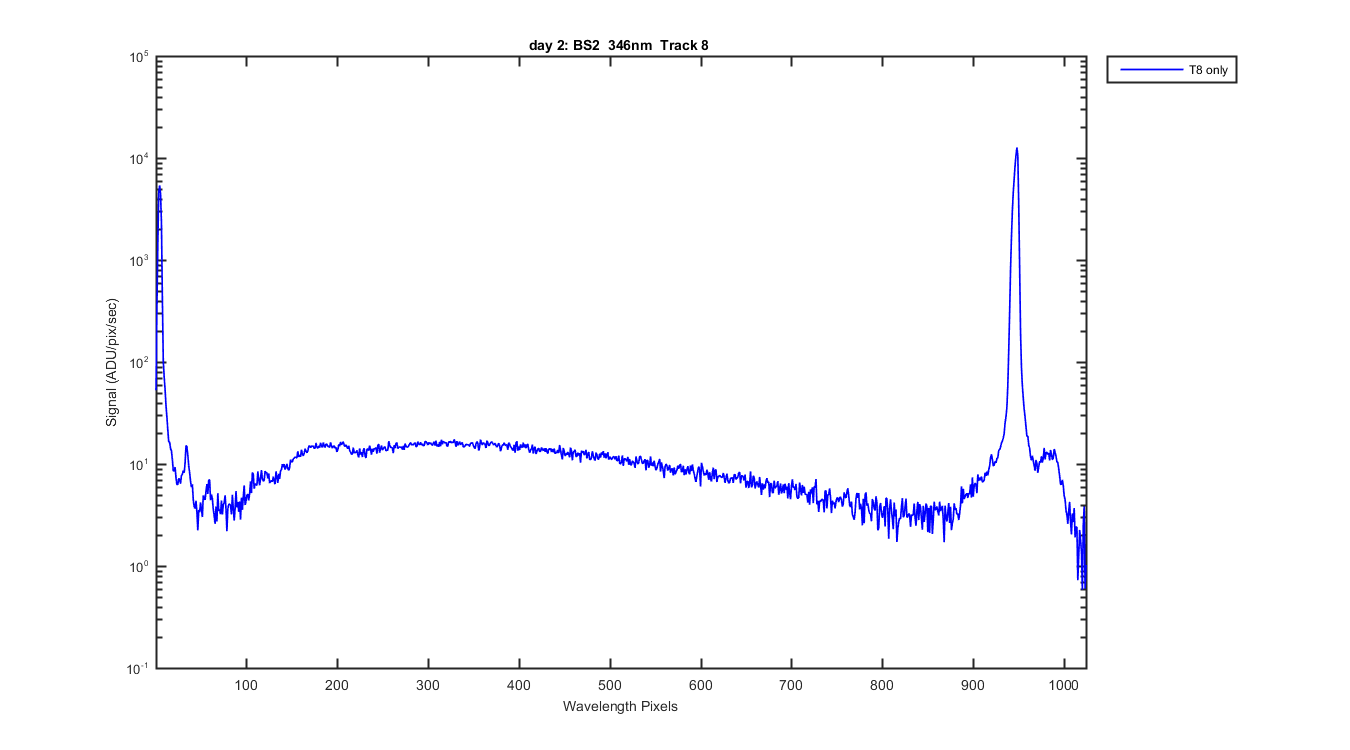
Figure 16
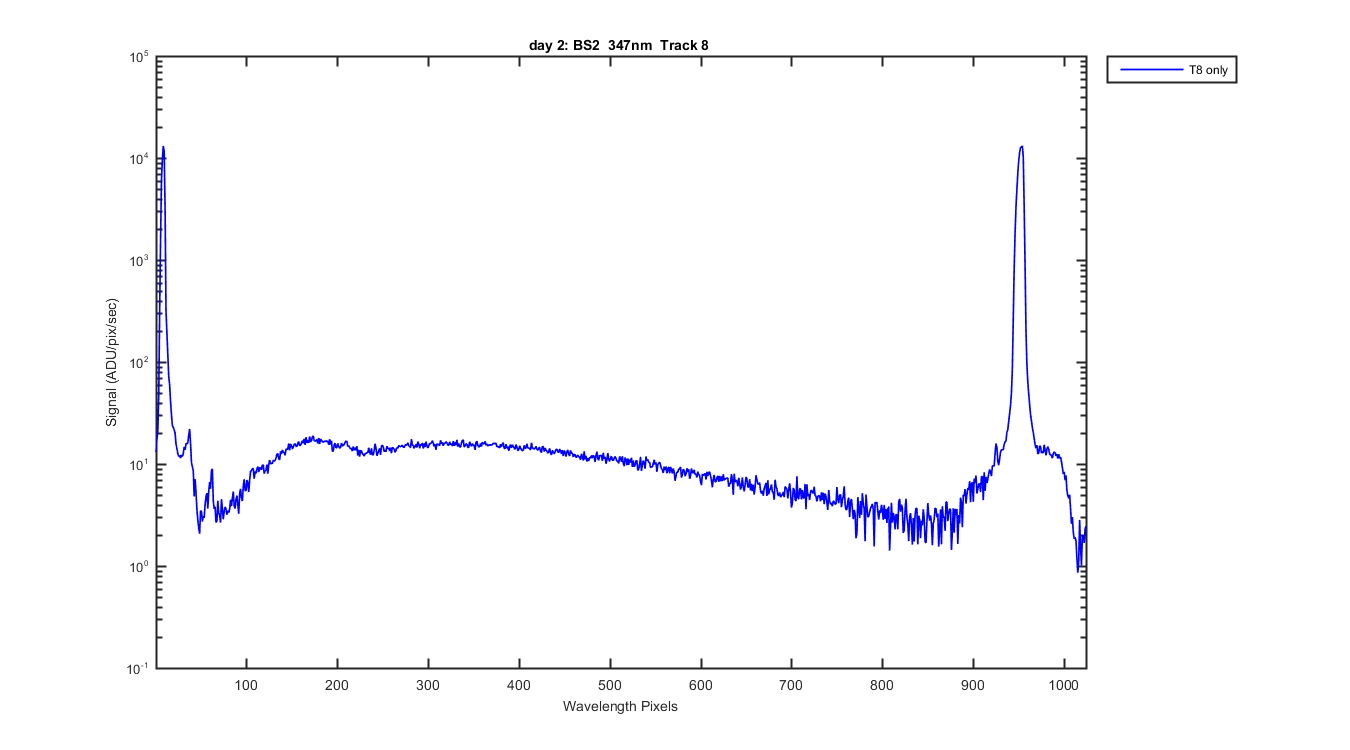
Figure 17
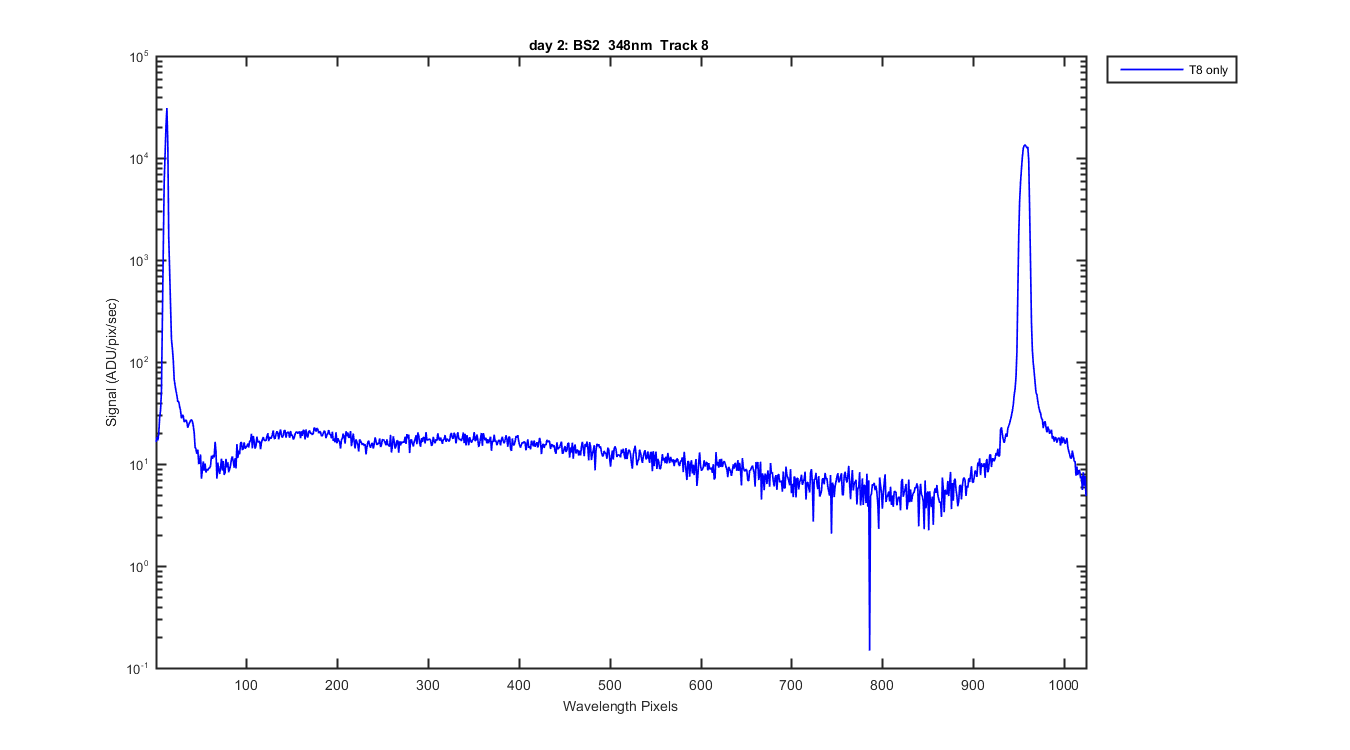
Figure 18
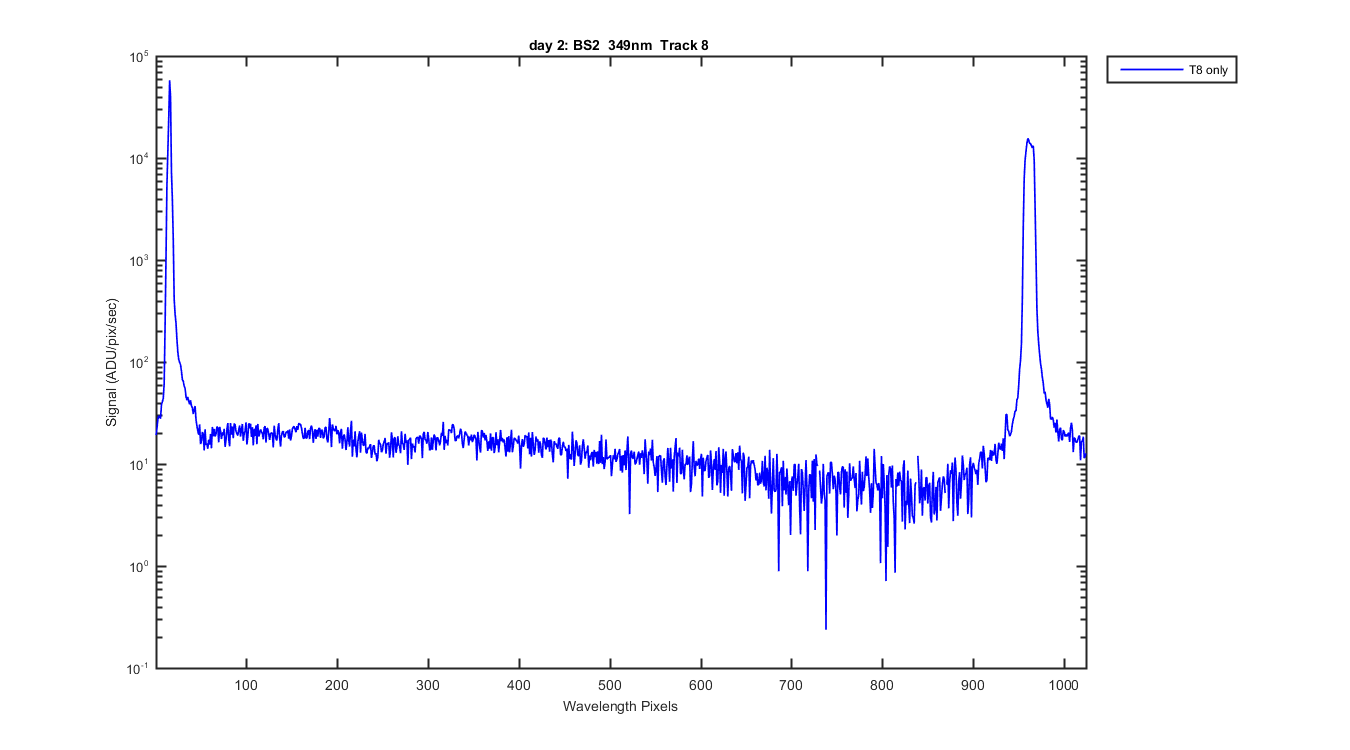
Figure 19
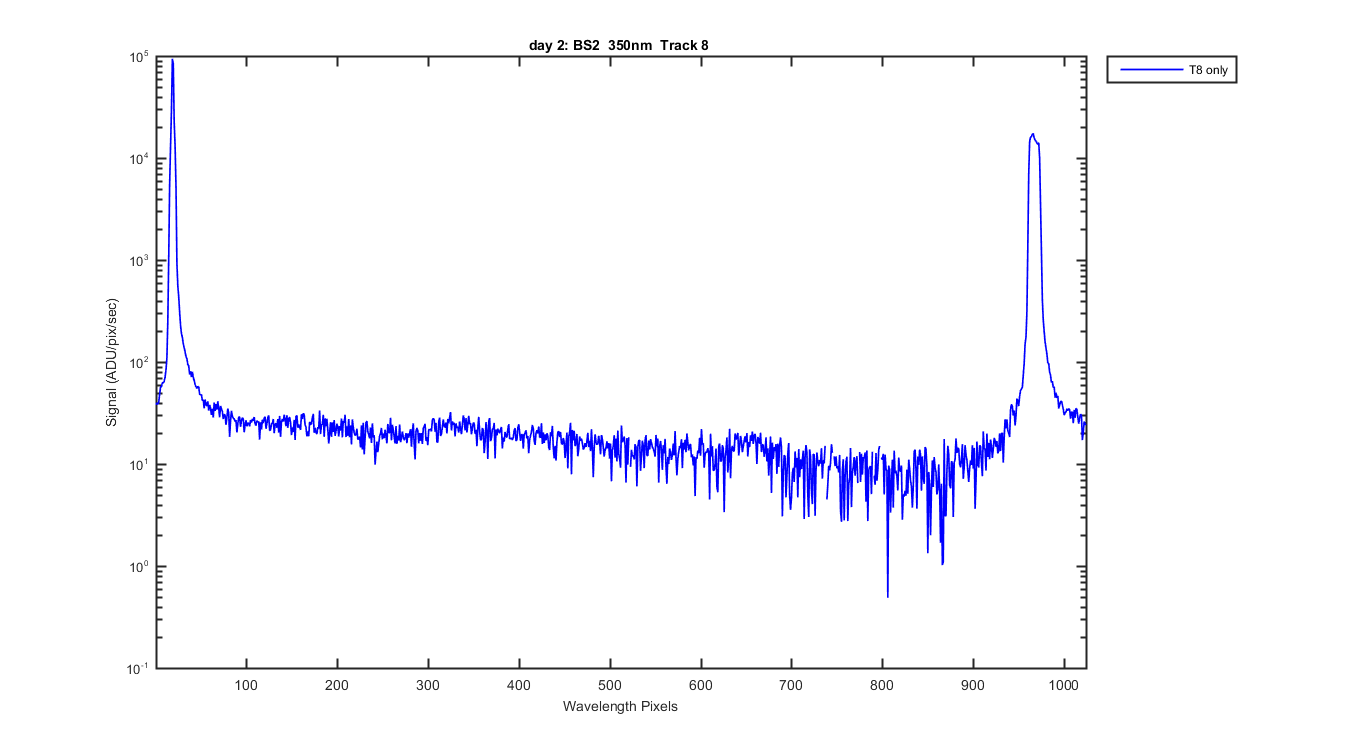
Figure 20
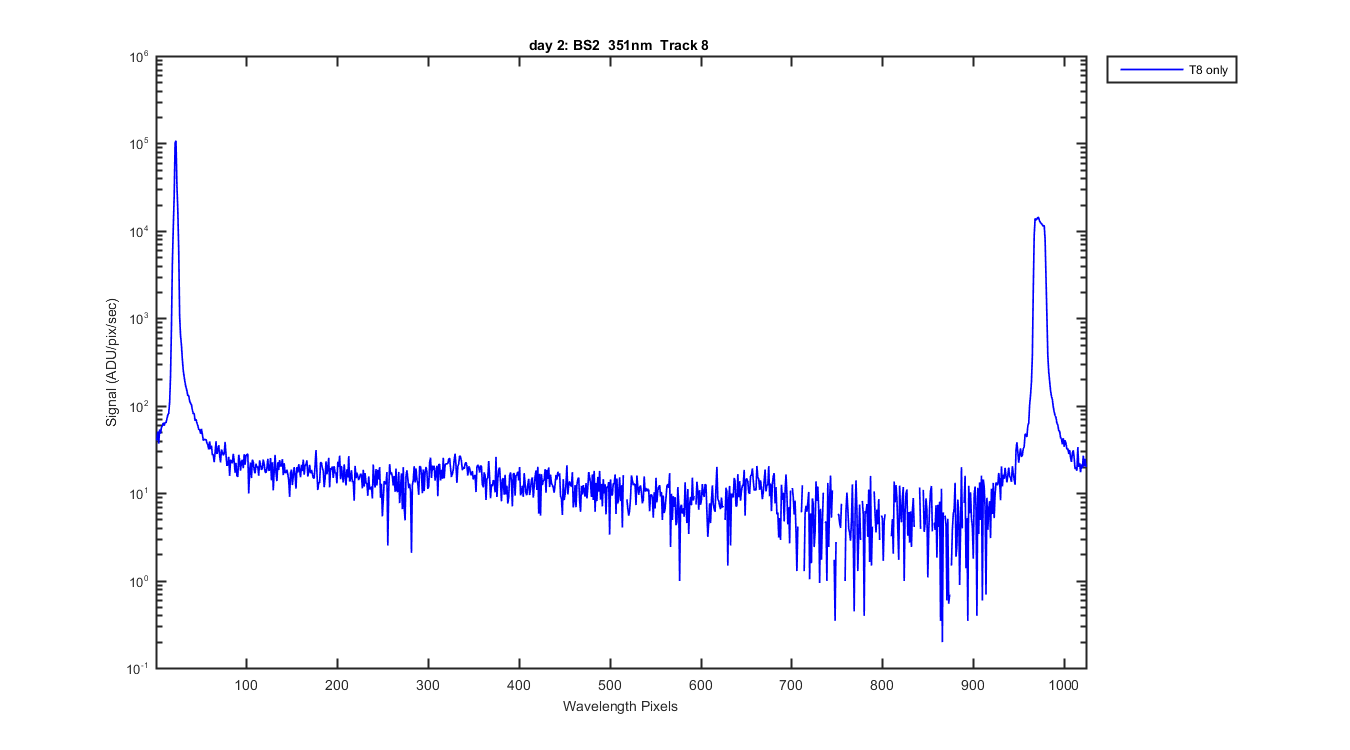
Figure 21
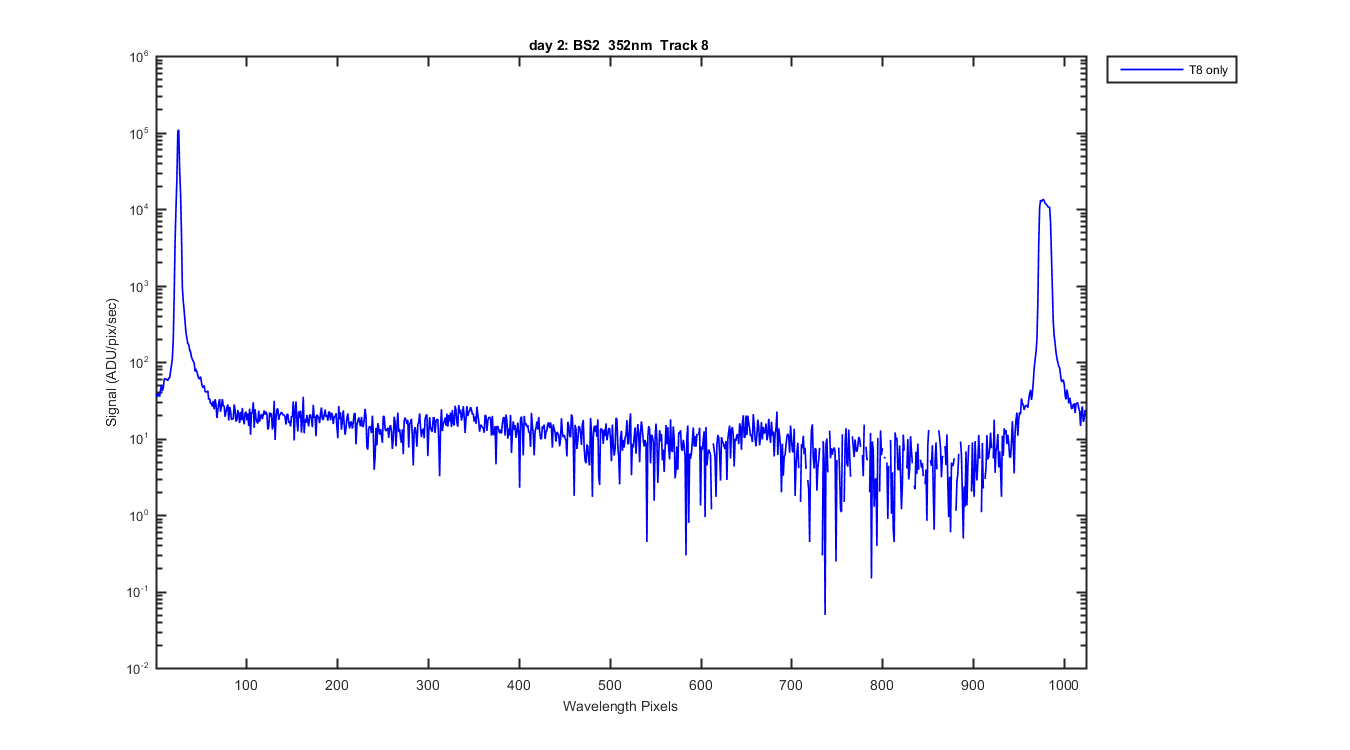
Figure 22
Figure 23
Figure 24
Figure 25
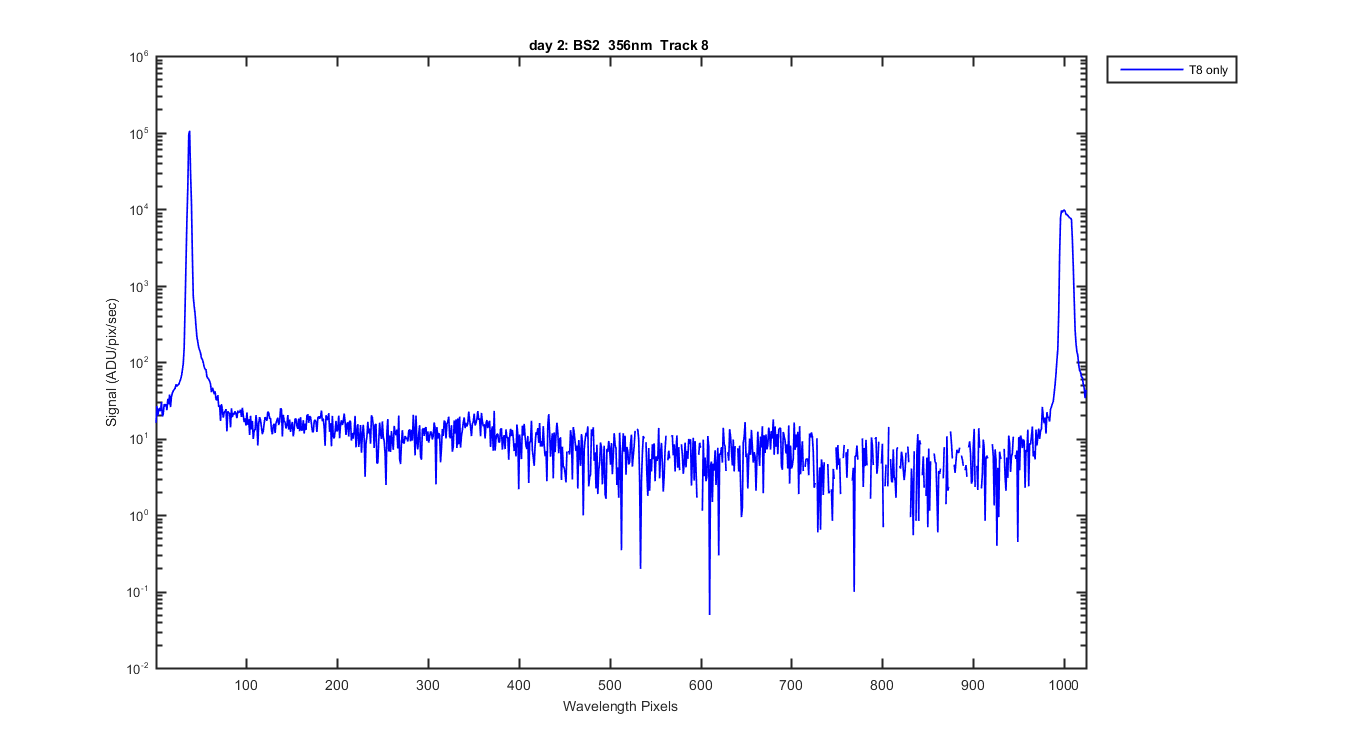
Figure 26
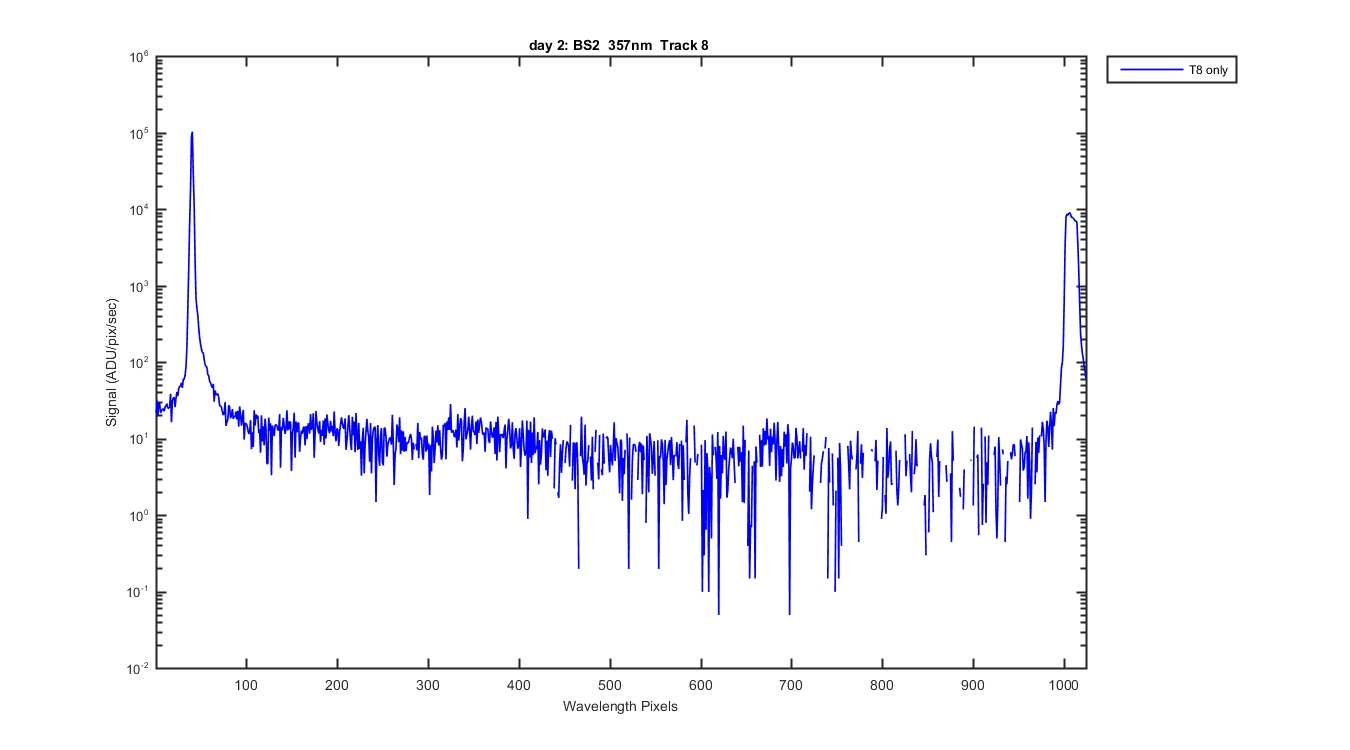
Figure 27
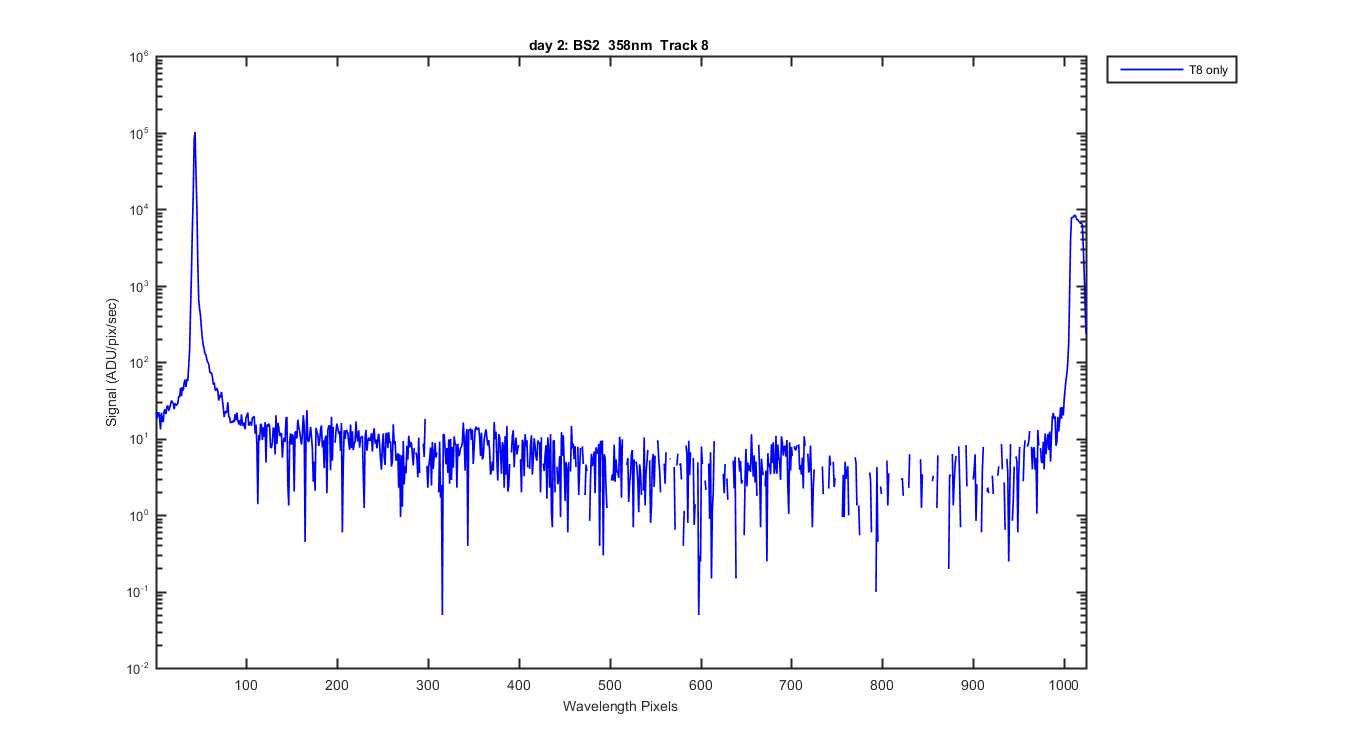
Figure 28
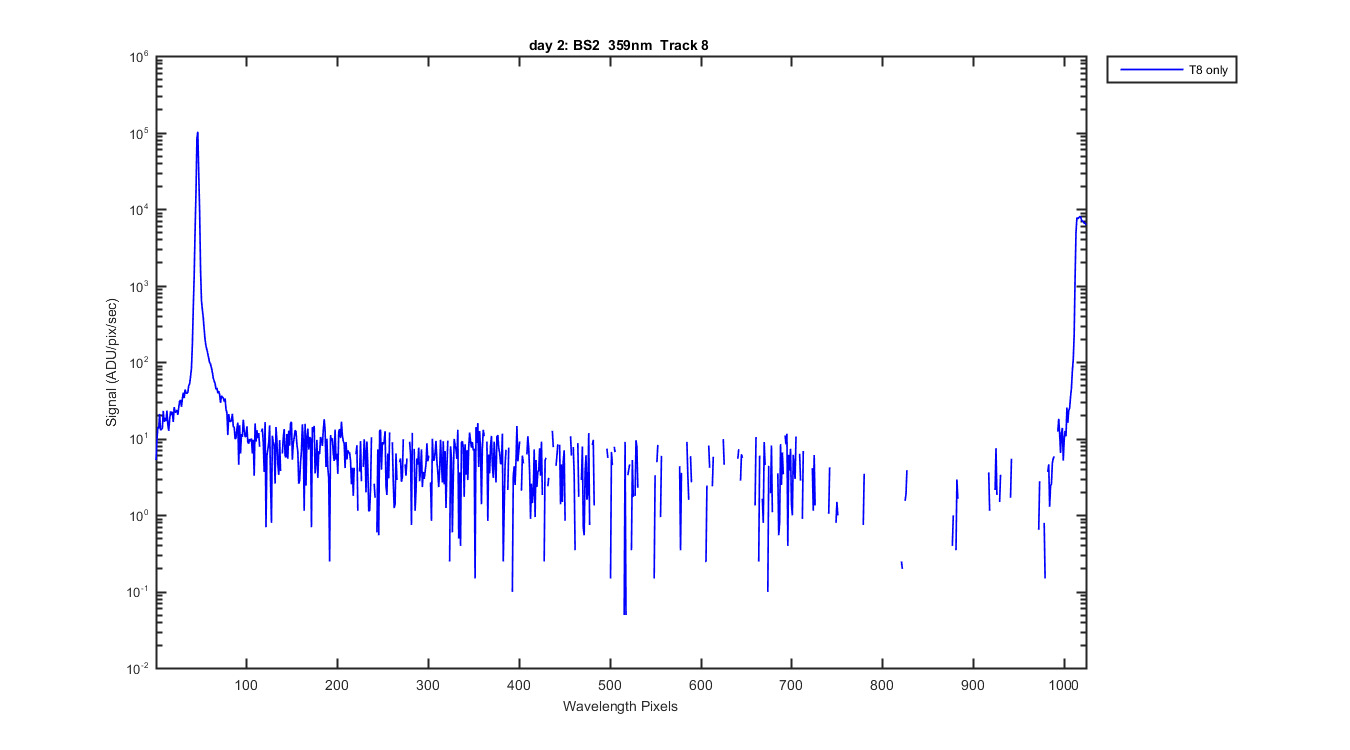
Figure 29
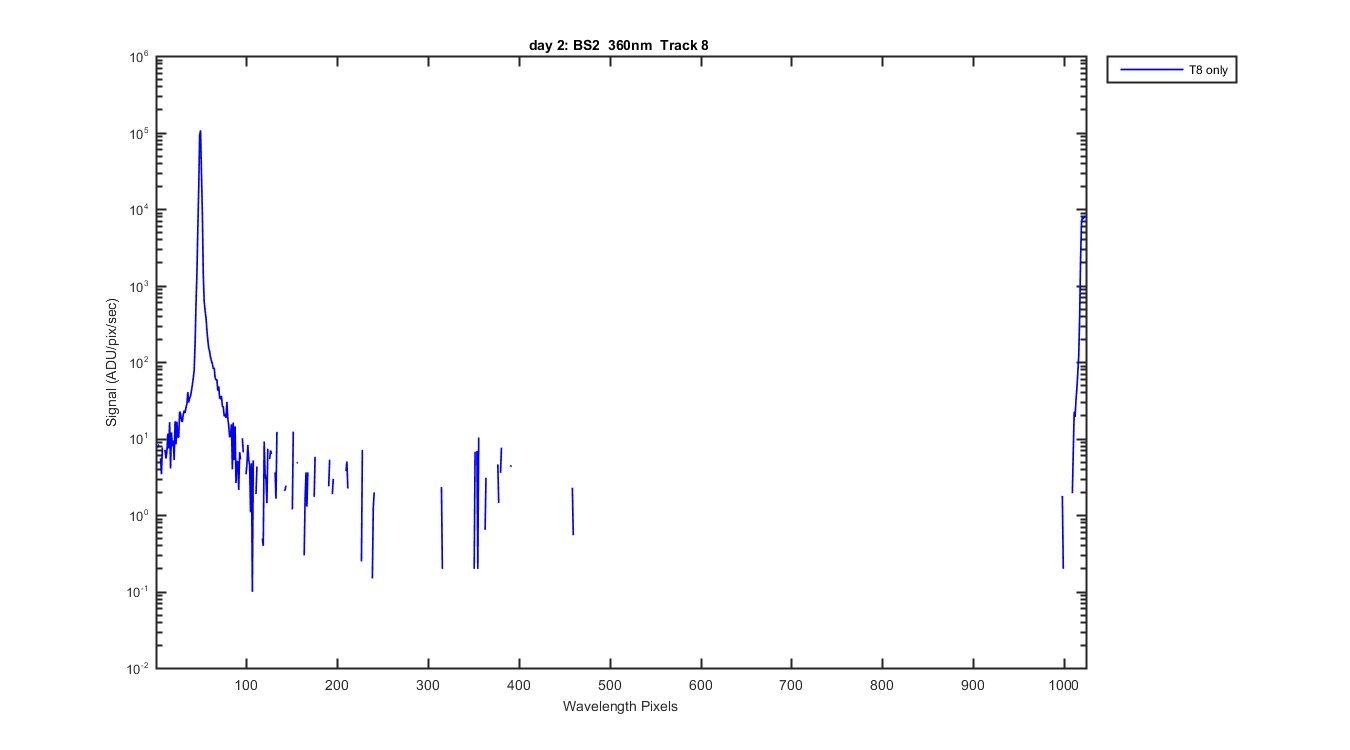
Figure 30
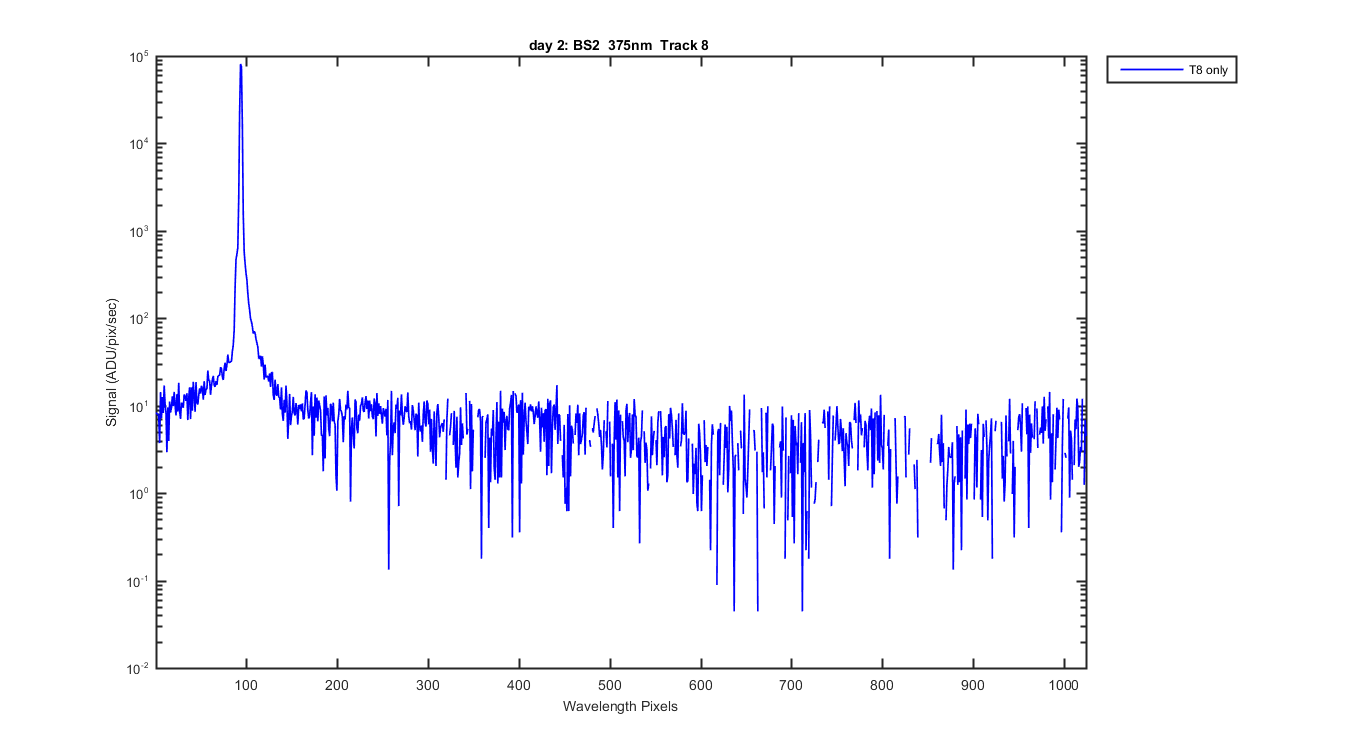
Figure 31
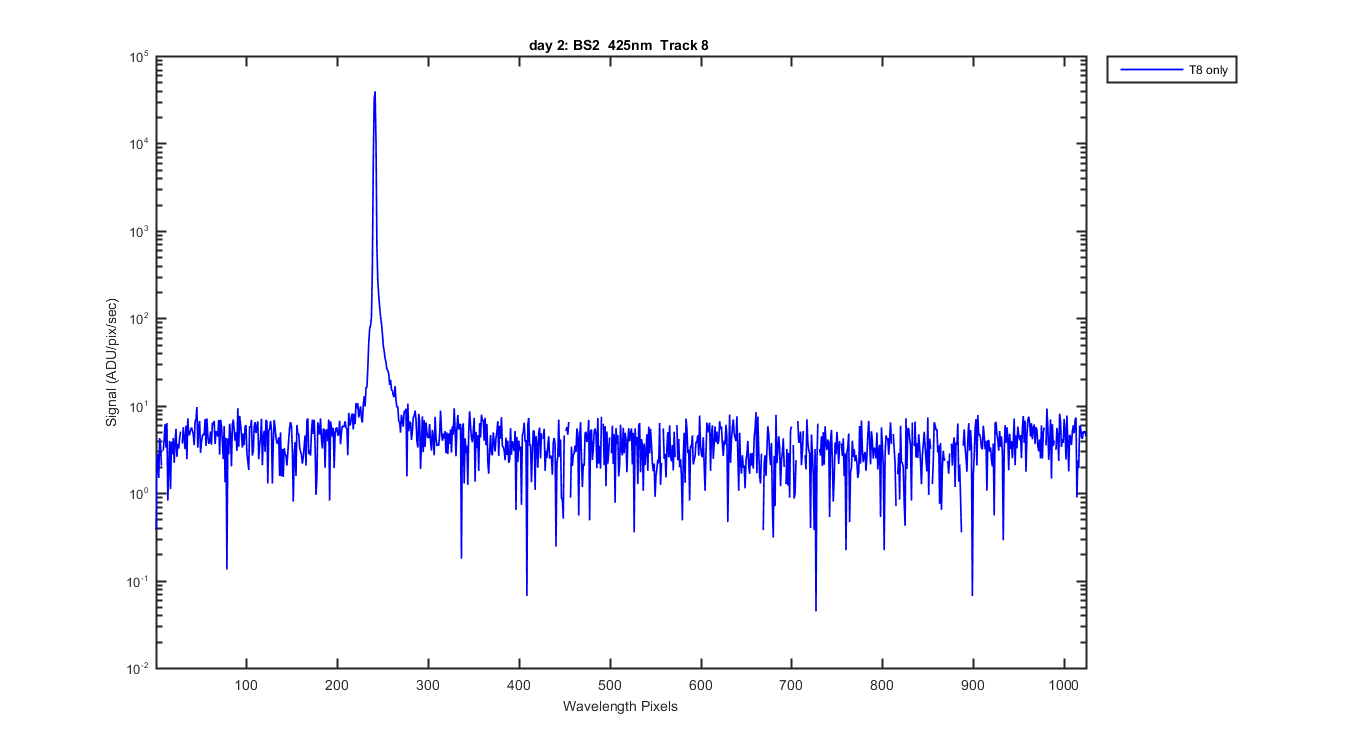
Figure 32
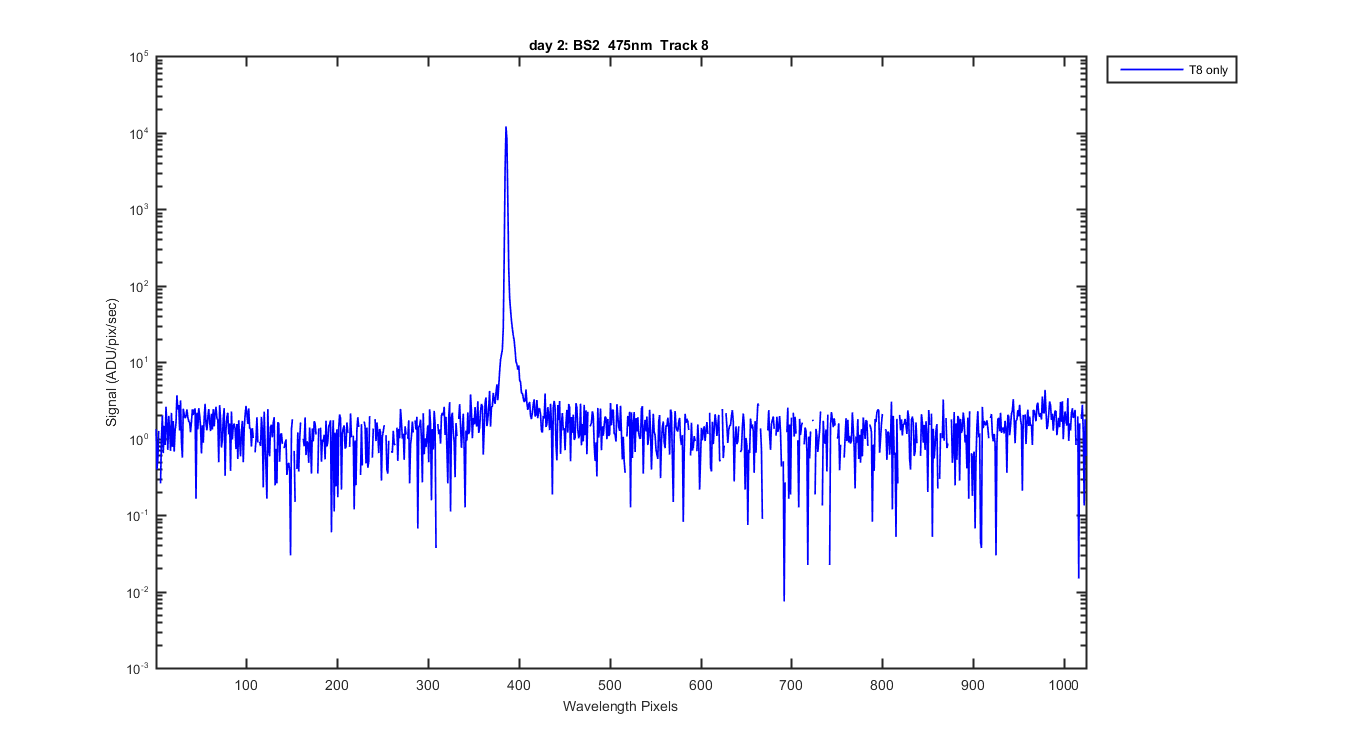
Figure 33
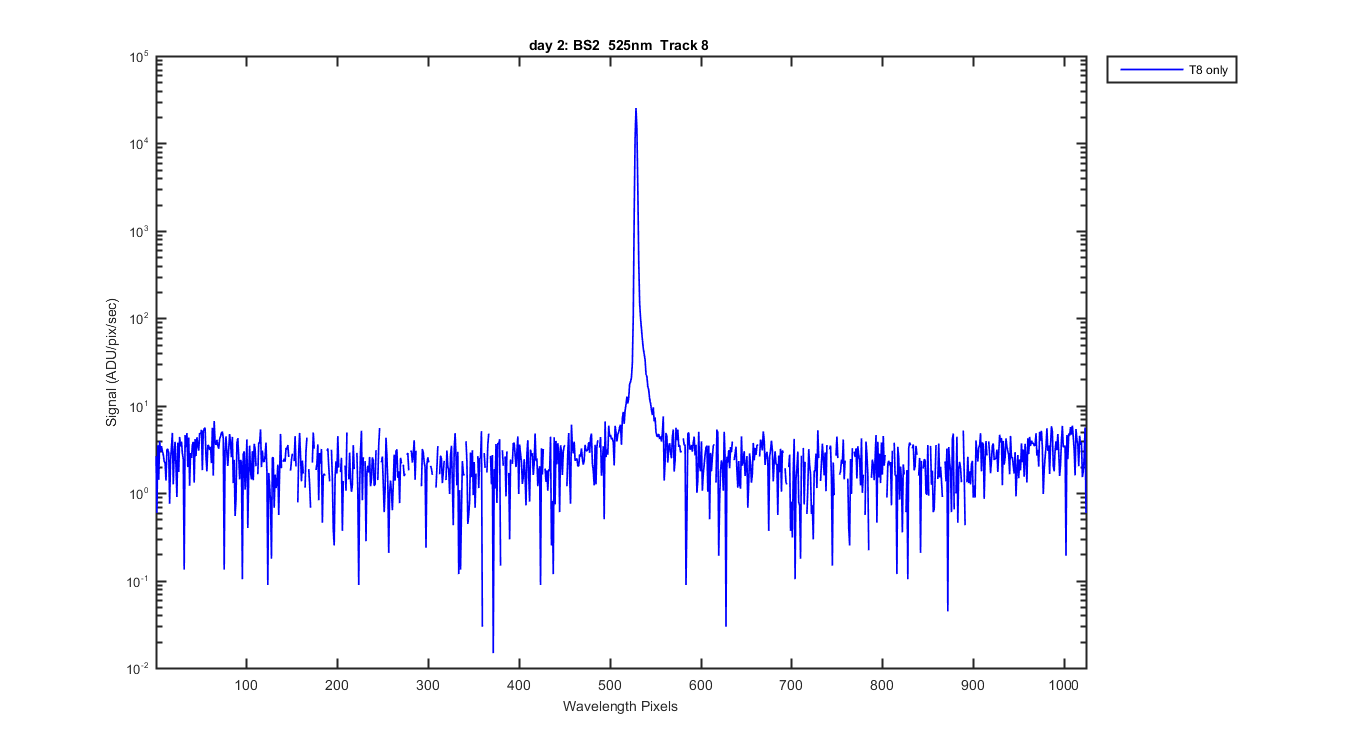
Figure 34
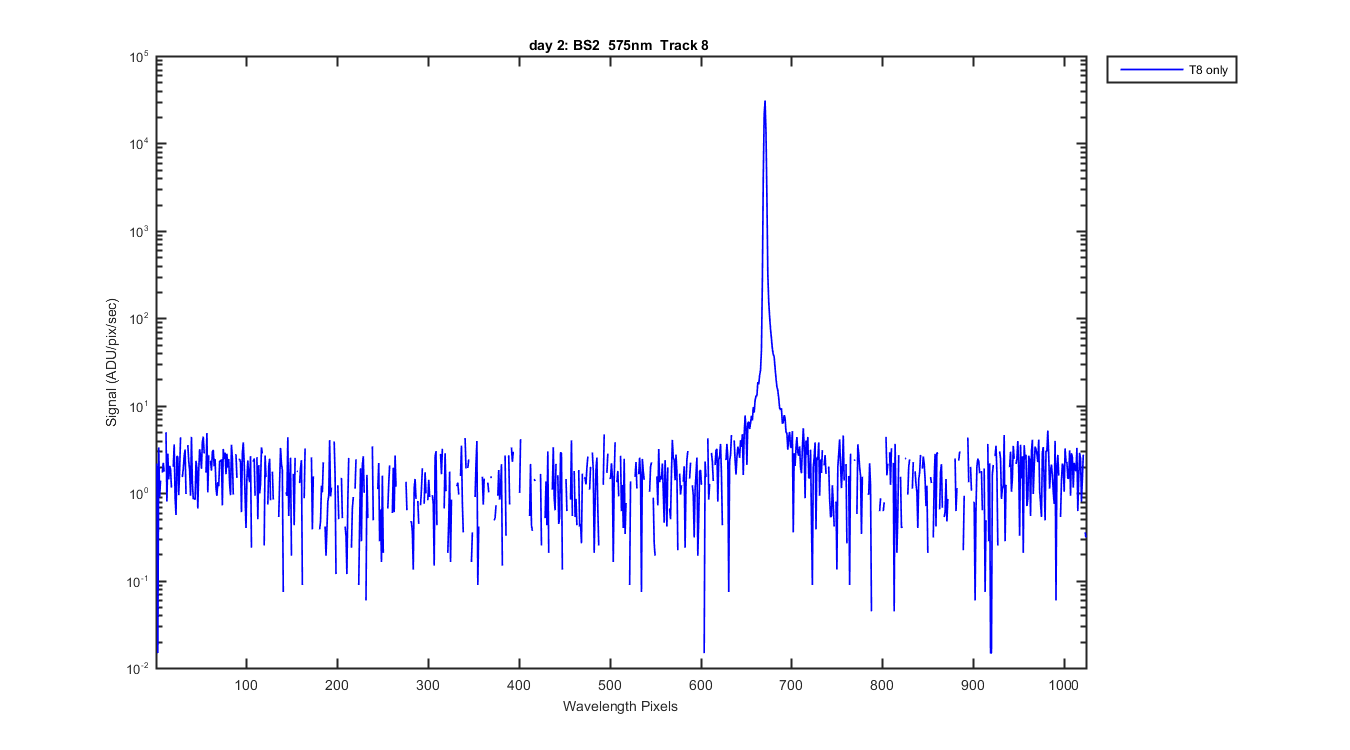
Figure 35
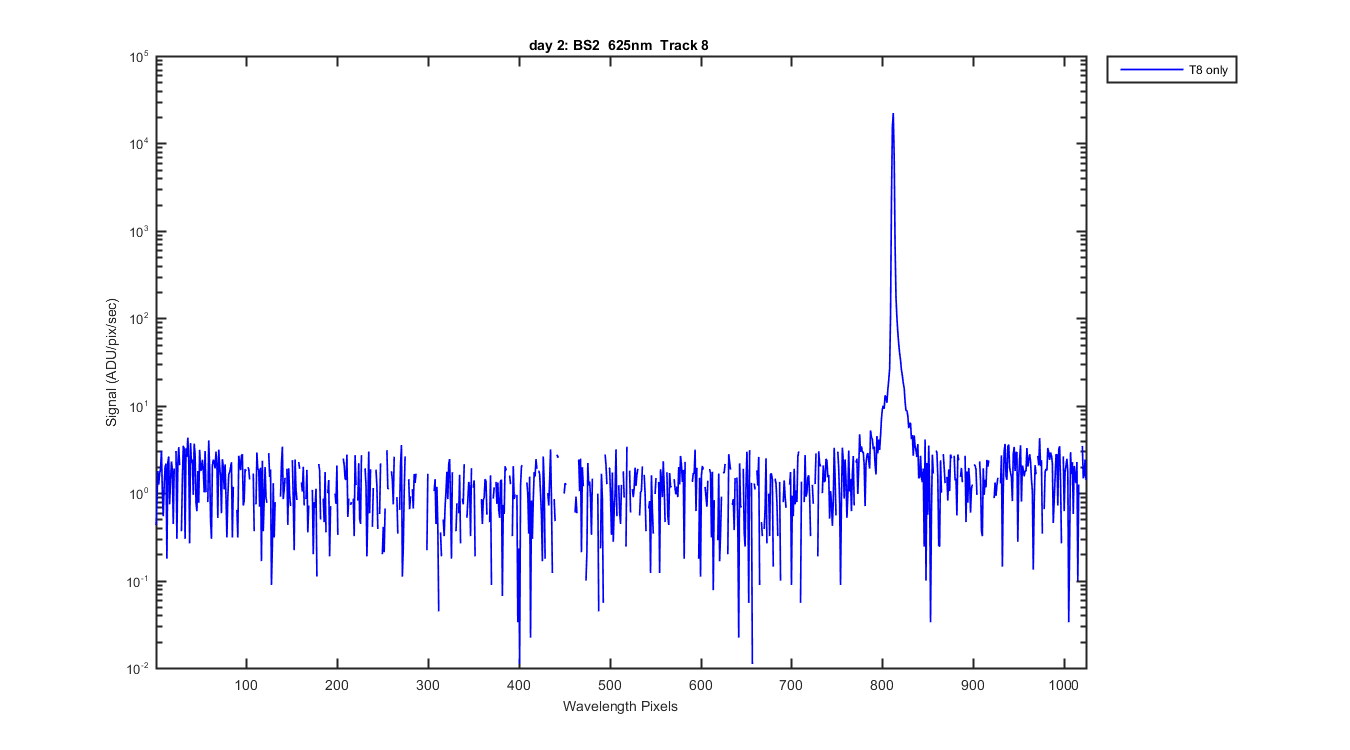
Figure 36
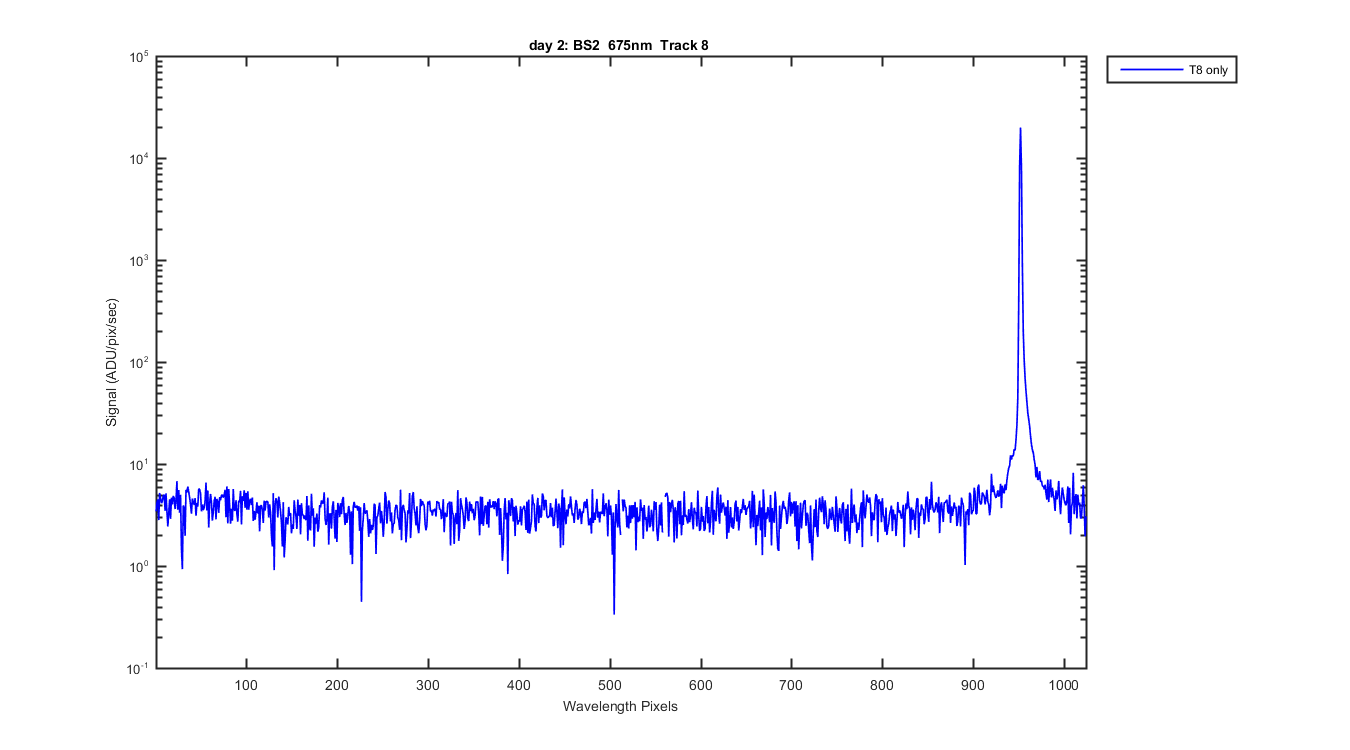
Figure 37
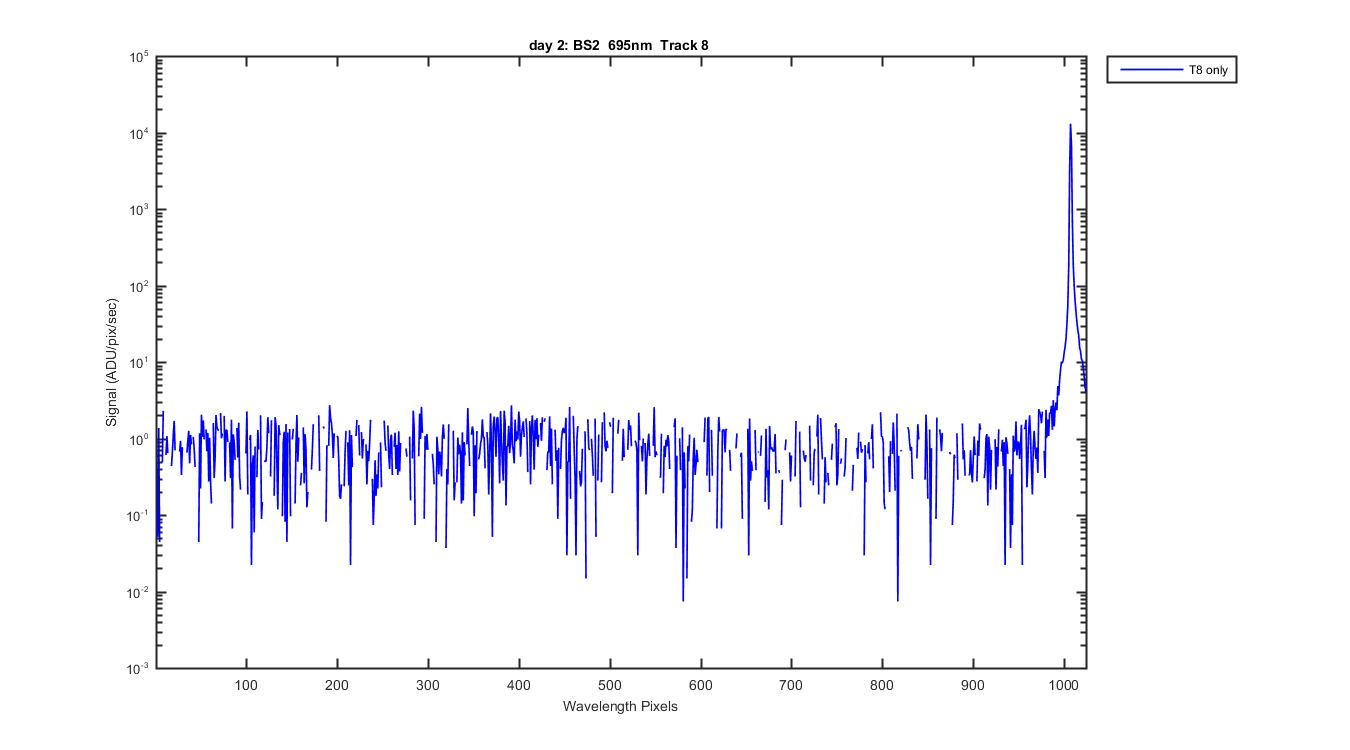
Figure 38
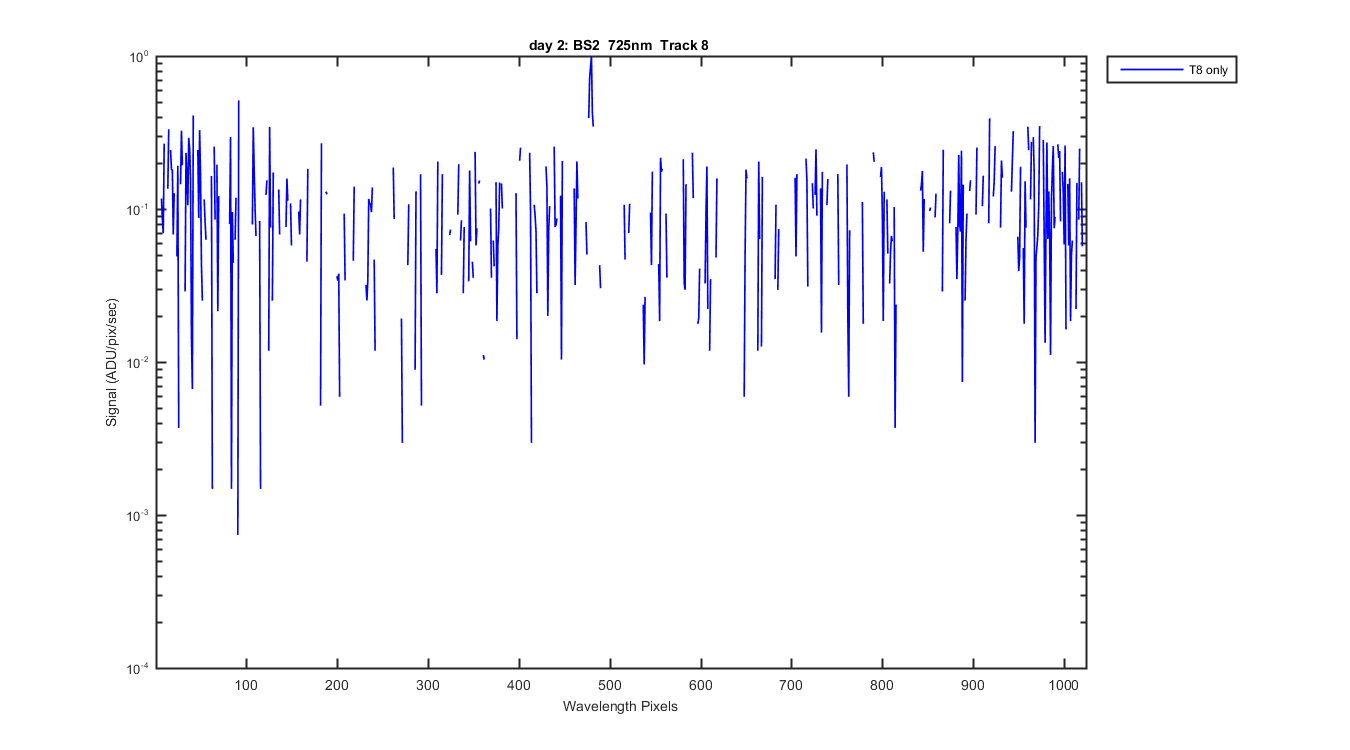
Figure 39