REVISION DATE: 06-Apr-2016 12:59:38
Solar data collected by Mike long MOBY259 Es FO#700 pointed at a gray reflectance plaque + the Sun, this is track 8 only. A clear sky + full Sun would have been too bright. I used a gray plaque because pointing the bare fiber at the clouds was too bright, and pointing a bare fiber at a white plaque under said clouds was also too bright.
Here I have plotted the data using my rough wavelength cal from the 5 pen lamps on day 4 .
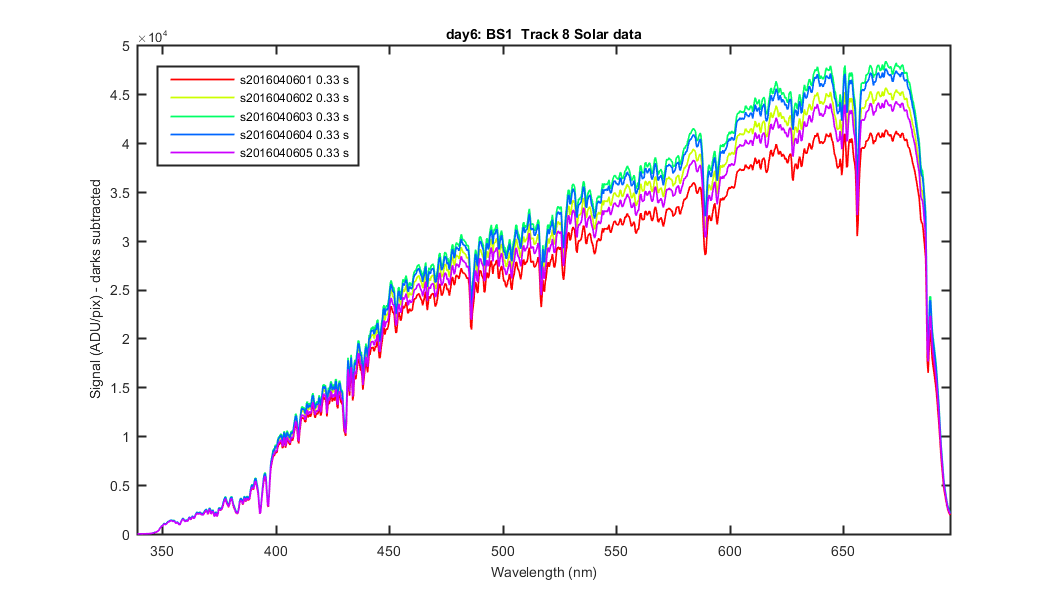
5 sets of Solar data. The data plotted are the track mean (hence the /pix) but is not divided by integration time. Darks are subtracted.
Figure 1
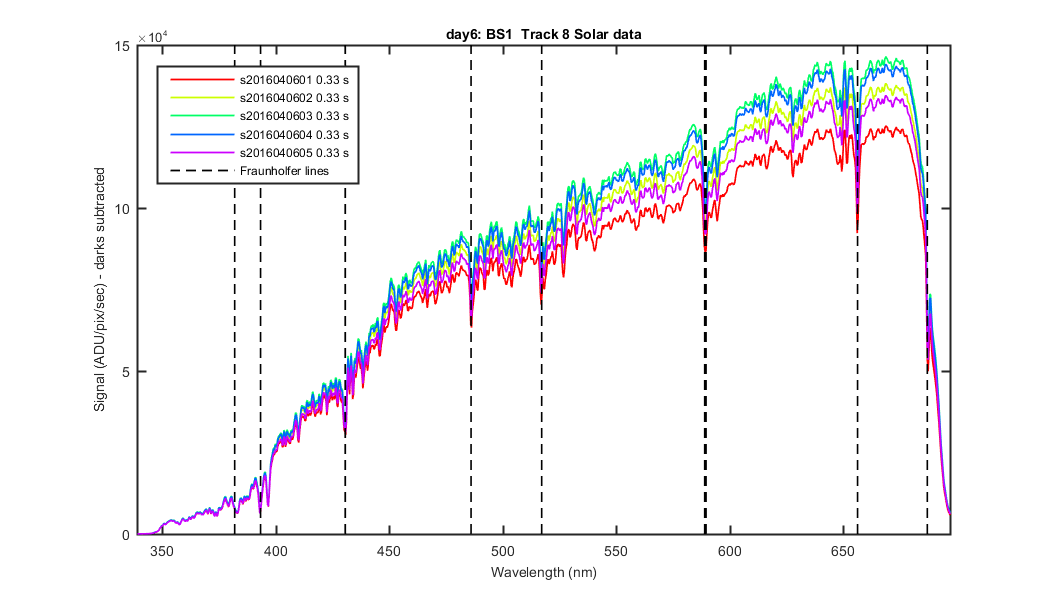
Same as above but divided by integration time.
Figure 2
Same as above but logged.
Taking the rough system response from day 2 and applying it to the Solar data on a cloudy day.
Figure 3
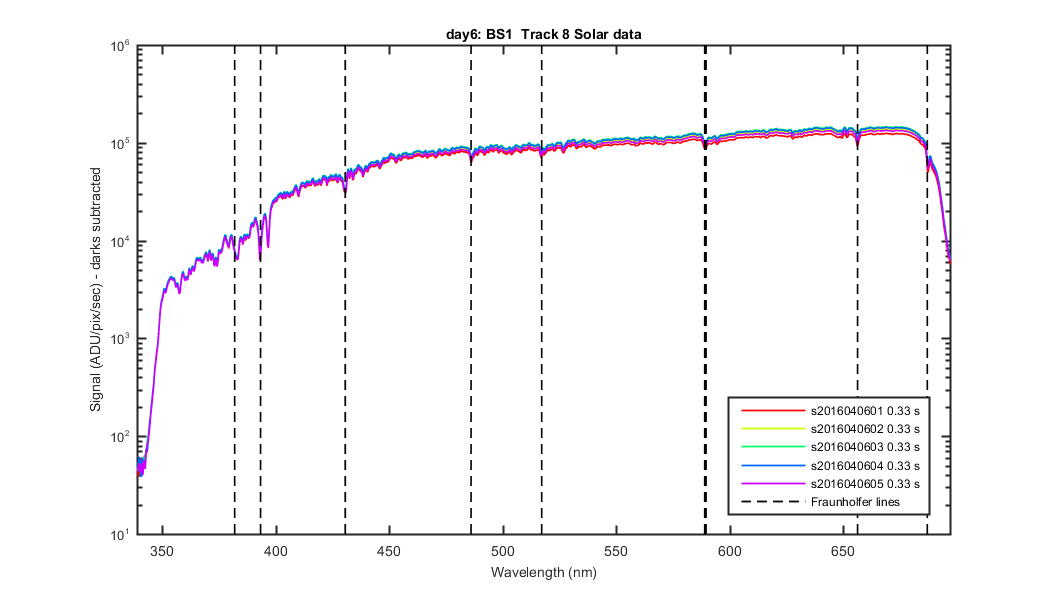
Figure 4
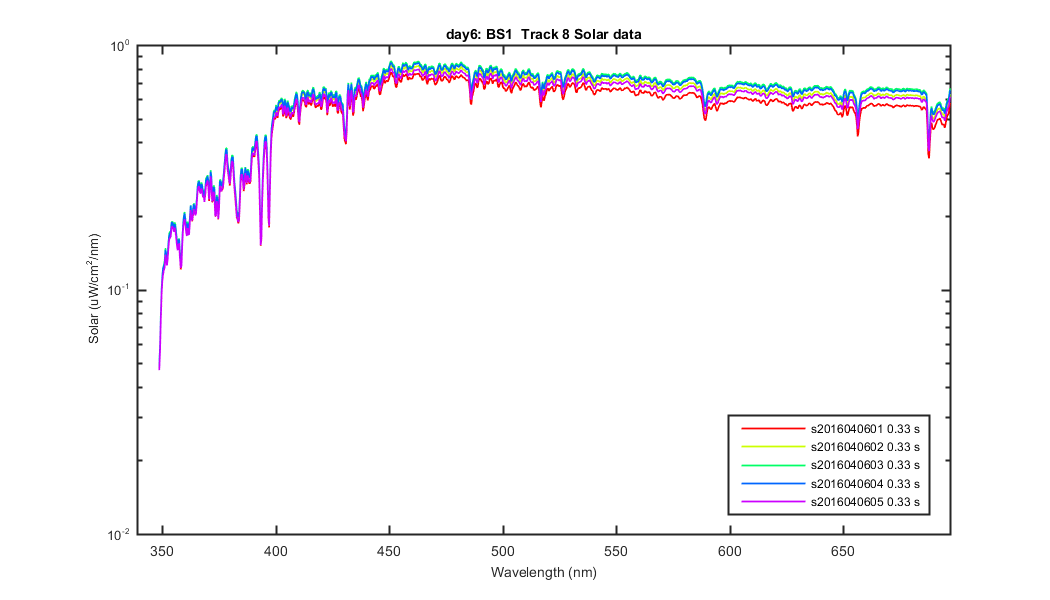
Figure 5
Figure 6
Figure 7
Figure 8
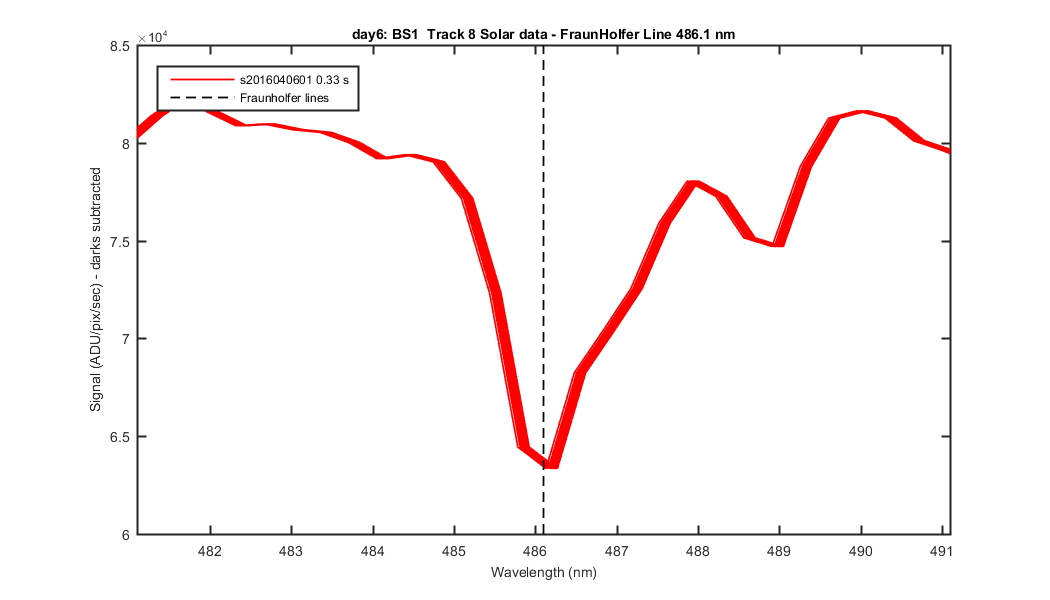
Figure 9
Figure 10
Figure 11
Figure 12
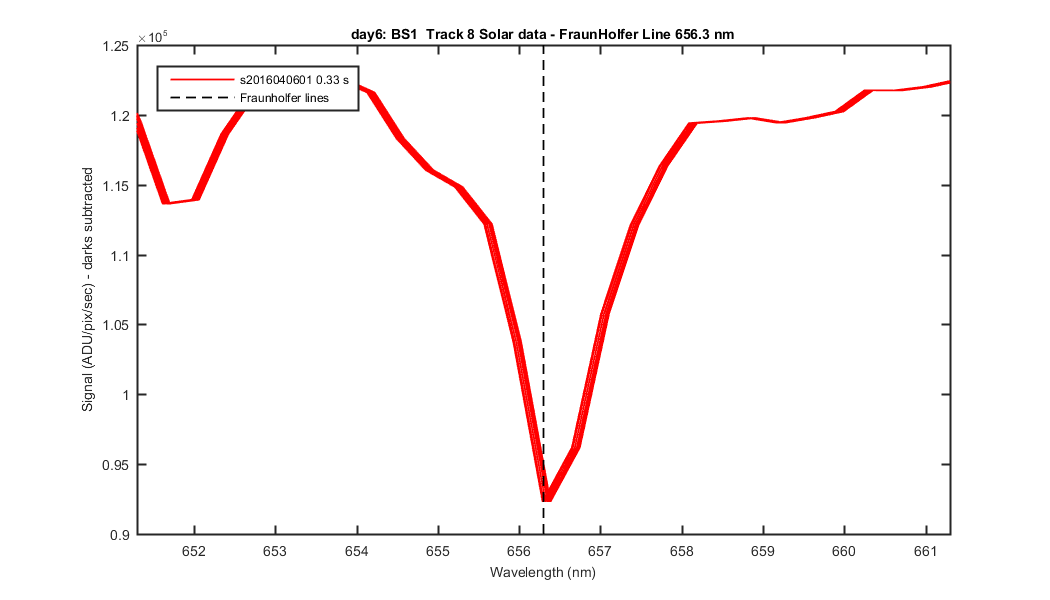
Figure 13