REVISION DATE: 06-Apr-2016 13:56:47
Solar data collected by Mike long MOBY259 Es FO#700 pointed at a gray reflectance plaque + the Sun, this is track 8 only. A clear sky + full Sun would have been too bright. I used a gray plaque because pointing the bare fiber at the clouds was too bright, and pointing a bare fiber at a white plaque under said clouds was also too bright.
This is a copy of the page from Hawaii-2015-03 Page Number 4.01, if you want to compare the data
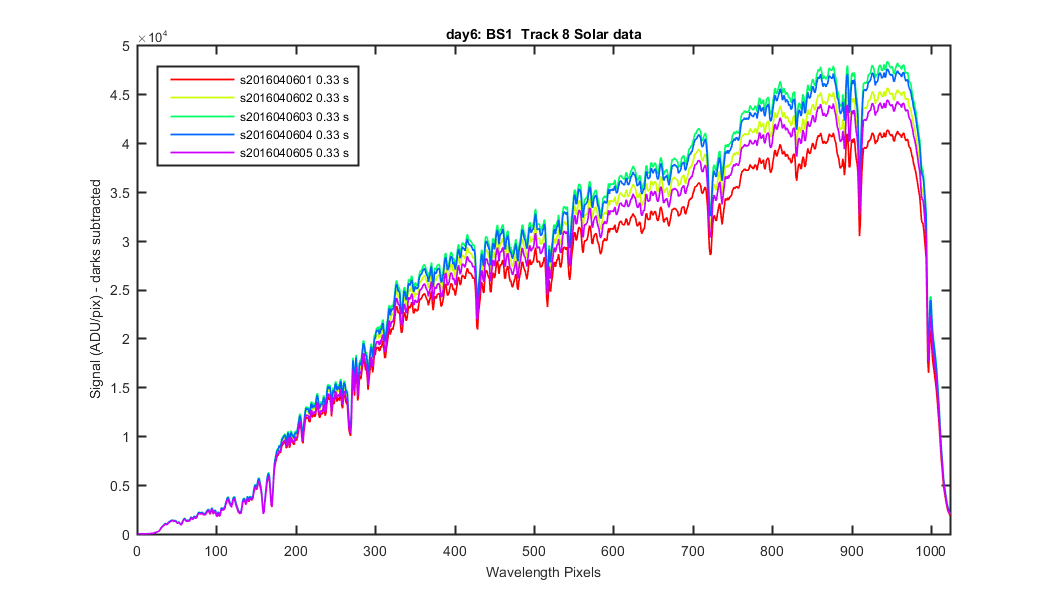
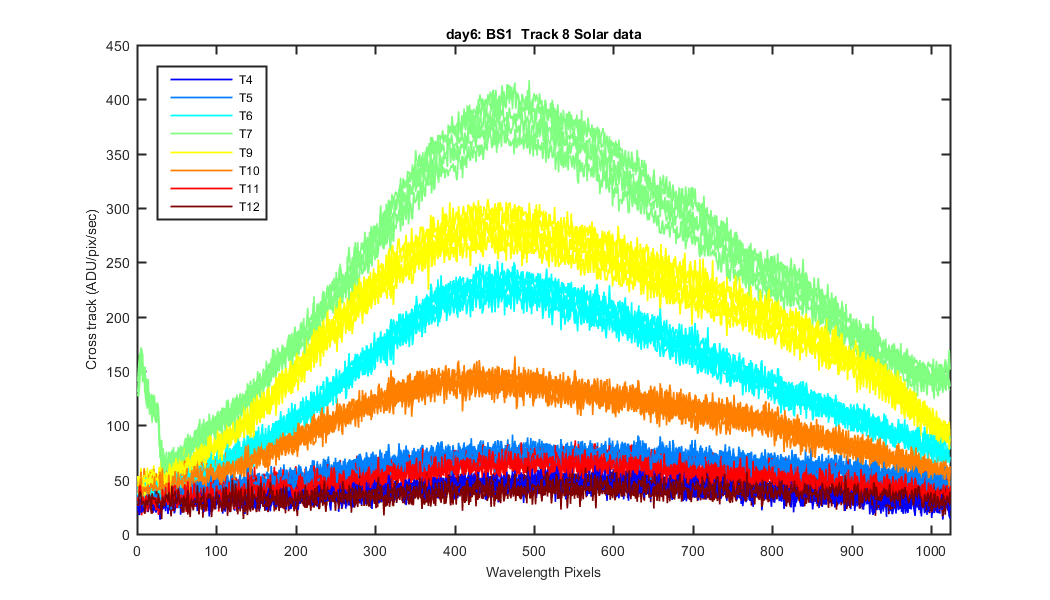
Figure 1
The Solar data with darks subtracted and these are track means but not divided by integration time.
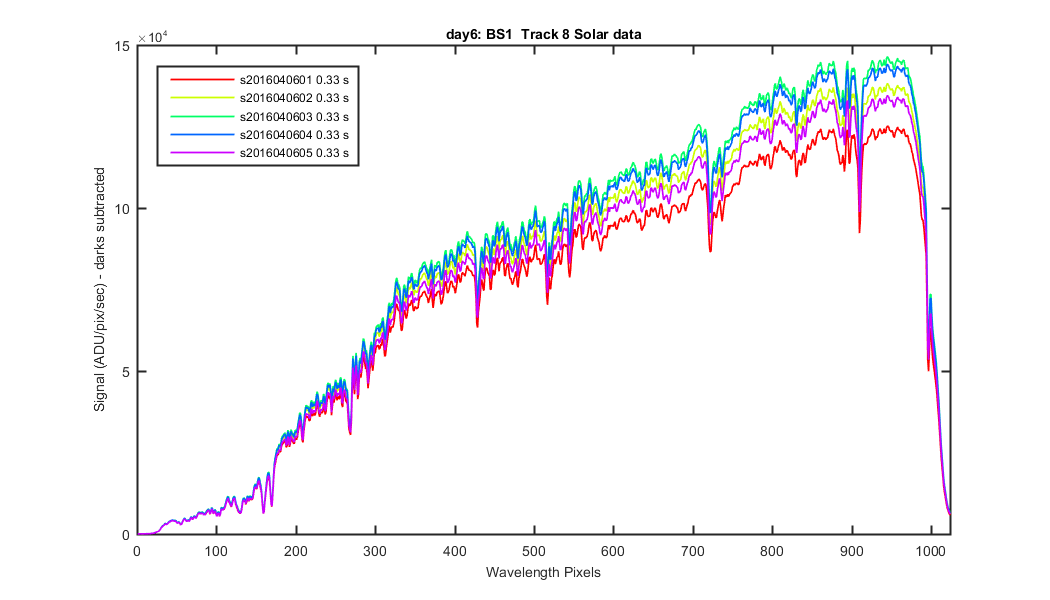
Figure 2
The Solar data divided by integration times.
Figure 3
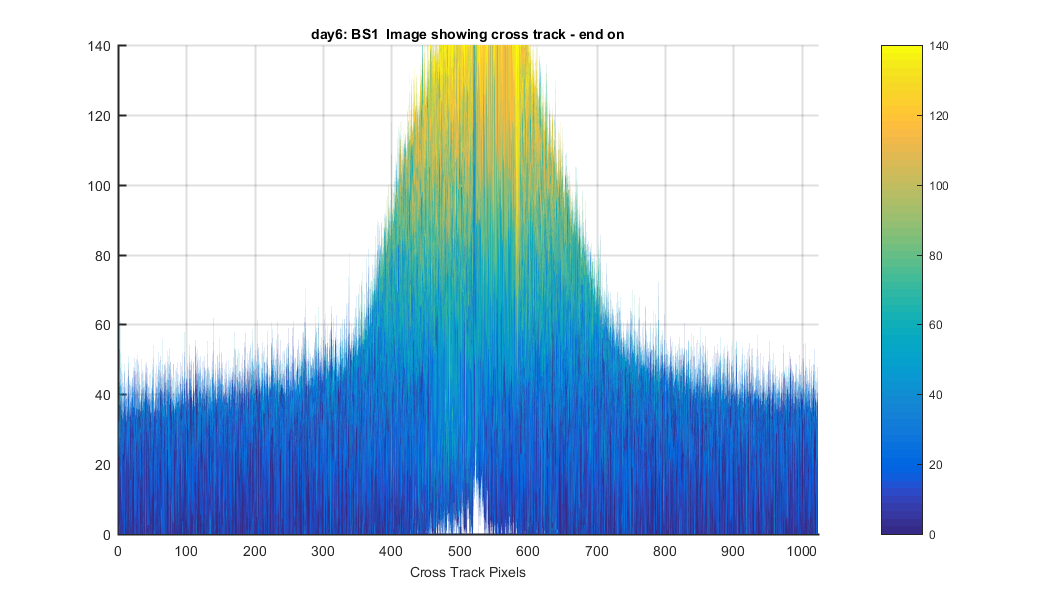
I also wanted to look at the cross track data so this shows the cross track data on each side of track 7. Also note the feature in the red lines at pixels 0-30. What is this? See figure 7 for a image showing this feature.
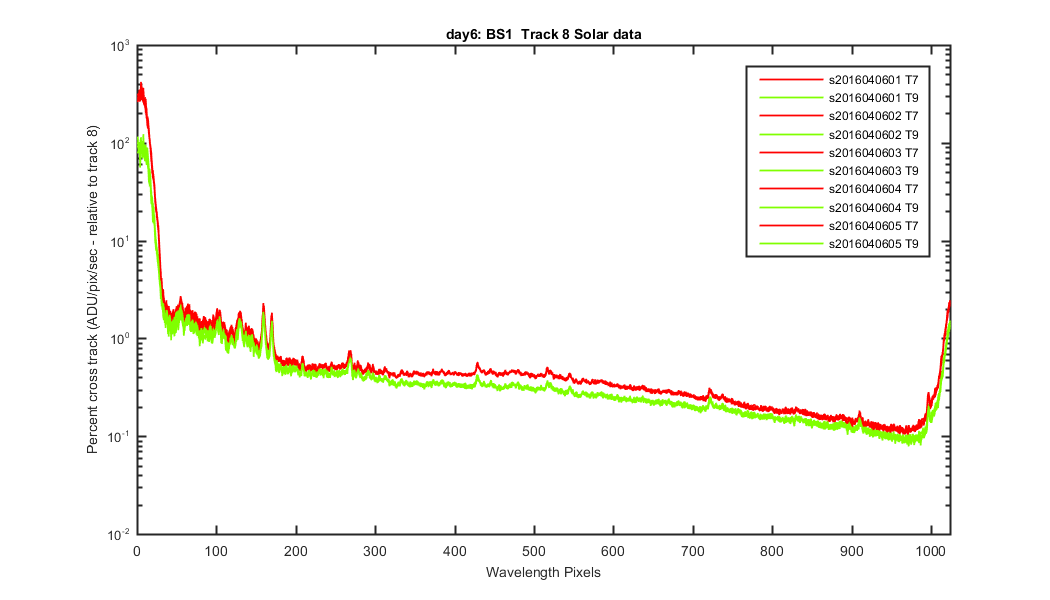
Figure 4
The cross track divided by the track 8 data to get a percent. I have plotted it as a log graph because the UV is so high it hides the data from pixel 200 down. Nice to see that for the most part it is fairly stable over the Solar data set collected.
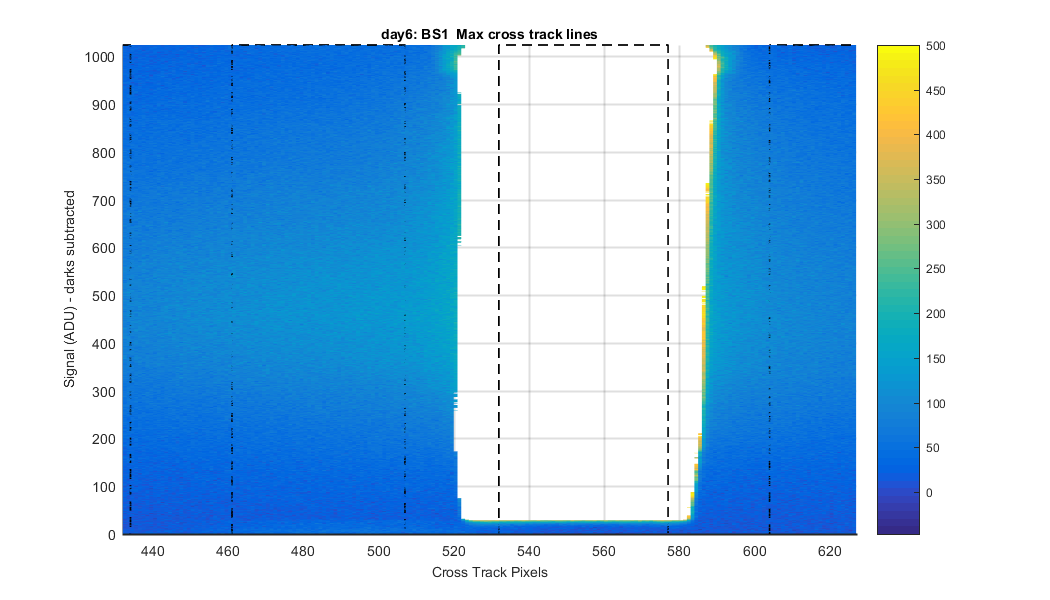
Figure 5
A zoom in of the image from the last file where you use to be able to see the IR artifact. All gone now.
Figure 6
A zoom in of the image from the last file so you can see the feature on track 8 at pixel 0-30. Interetsing. Any idea what this is???? It increases the UV cross track by A LOT. Seems to appear only on track 7.
Figure 7
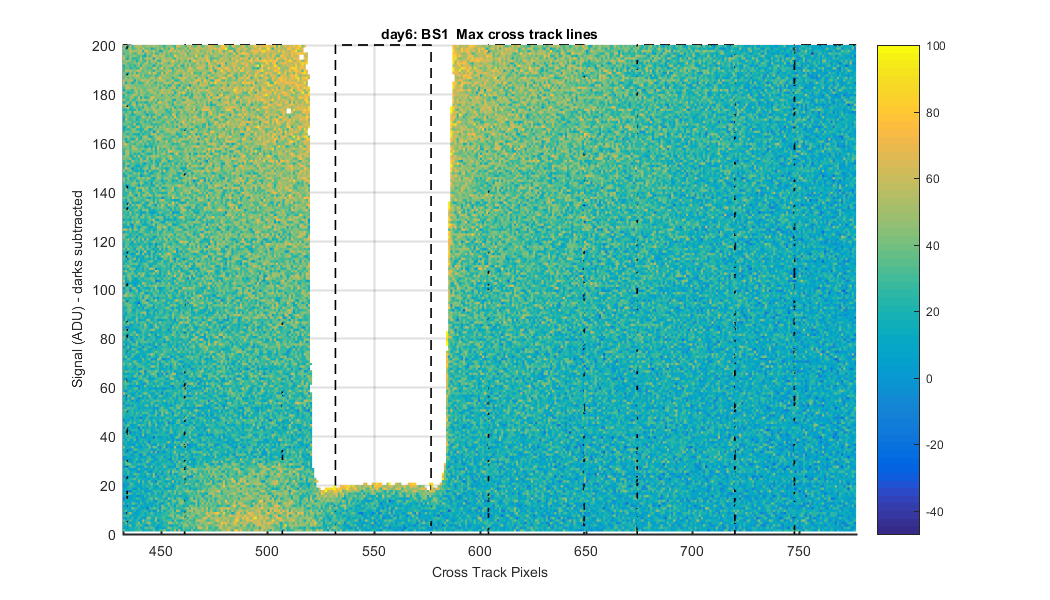
Figure 8
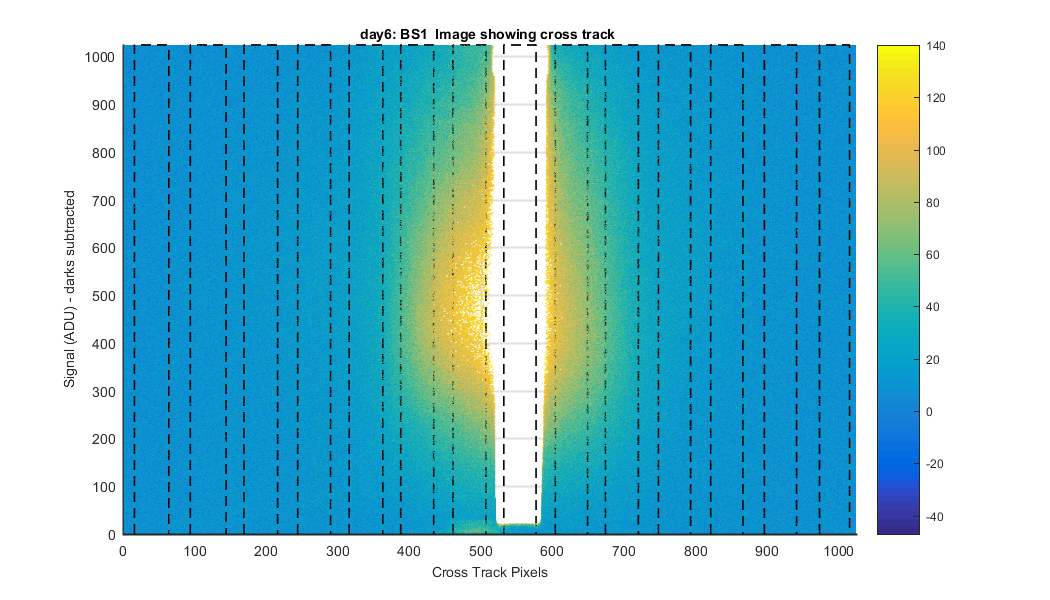
Figure 9