REVISION DATE: 21-Jun-2018 12:56:34
The question is how many wavecals do we need to do for BS. Once the BS started going in the buoy wavecals have only been done on the LuBot track. The question was this good enough. So Mike took more cals with Es, Lu and Ed data. But I thought maybe look for some fibered data that have a pen lamp cal and all tracks to see how wavelengths change for all tracks an before any other optics are added.
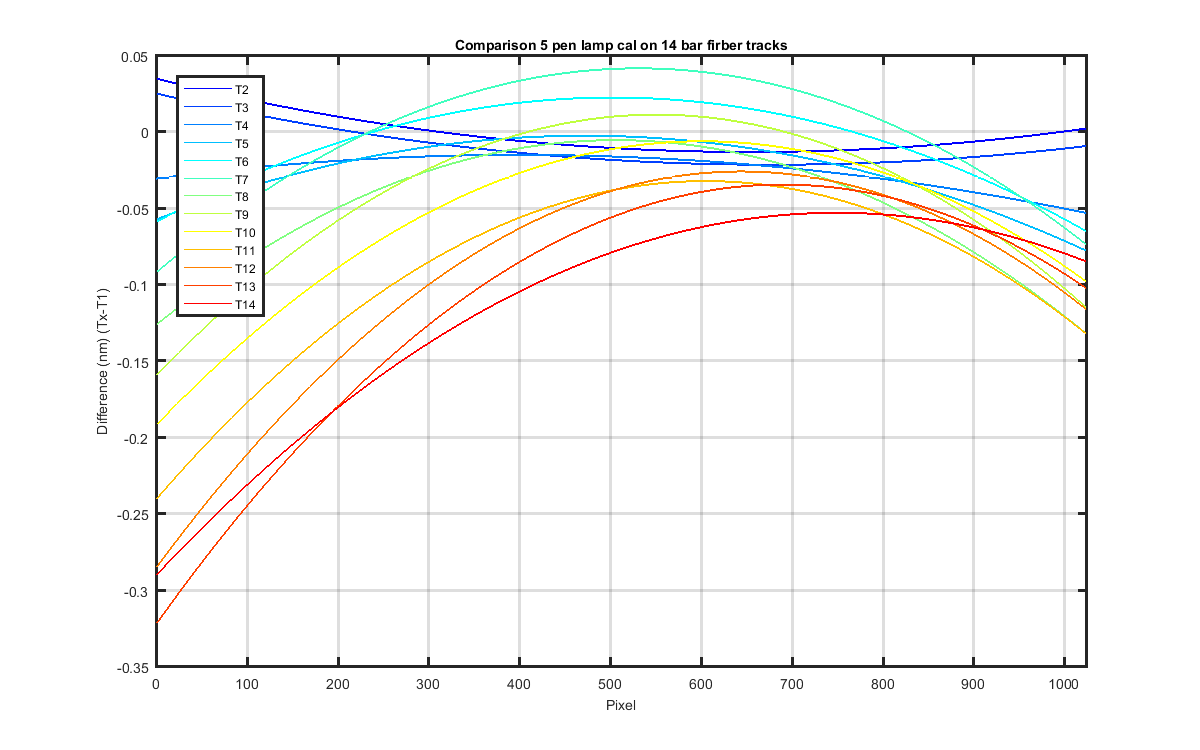
Figure 1 The differences between the LuBot (trk 13) wavecal done with the 5 Pen lamps wavecals on the Es, LuTop and LuMid tracks (2, 6 and 9). The sub p means it is a 5 pen lamp cal.
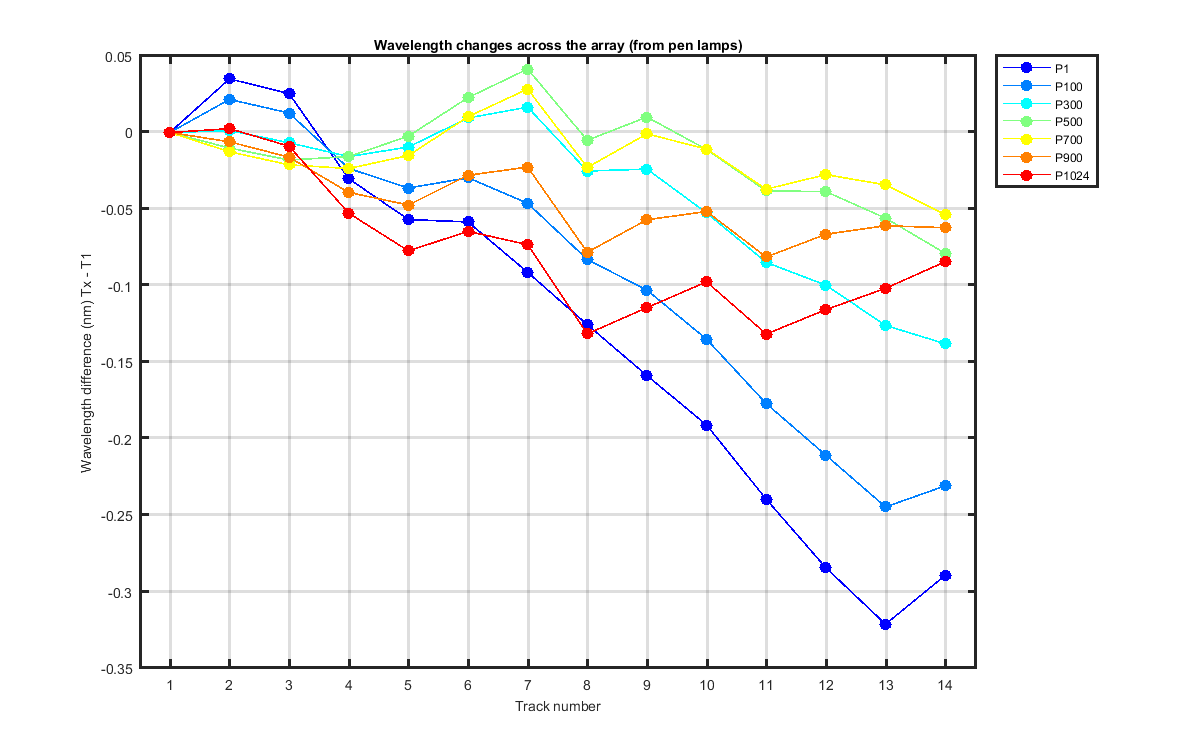
Figure 2 These three graphs (from pen lamps) show the how the wavelength change across the array. The first is relavtive to track 13. The second graph is just showing it in their real positions. The third graph is relative to track 2.
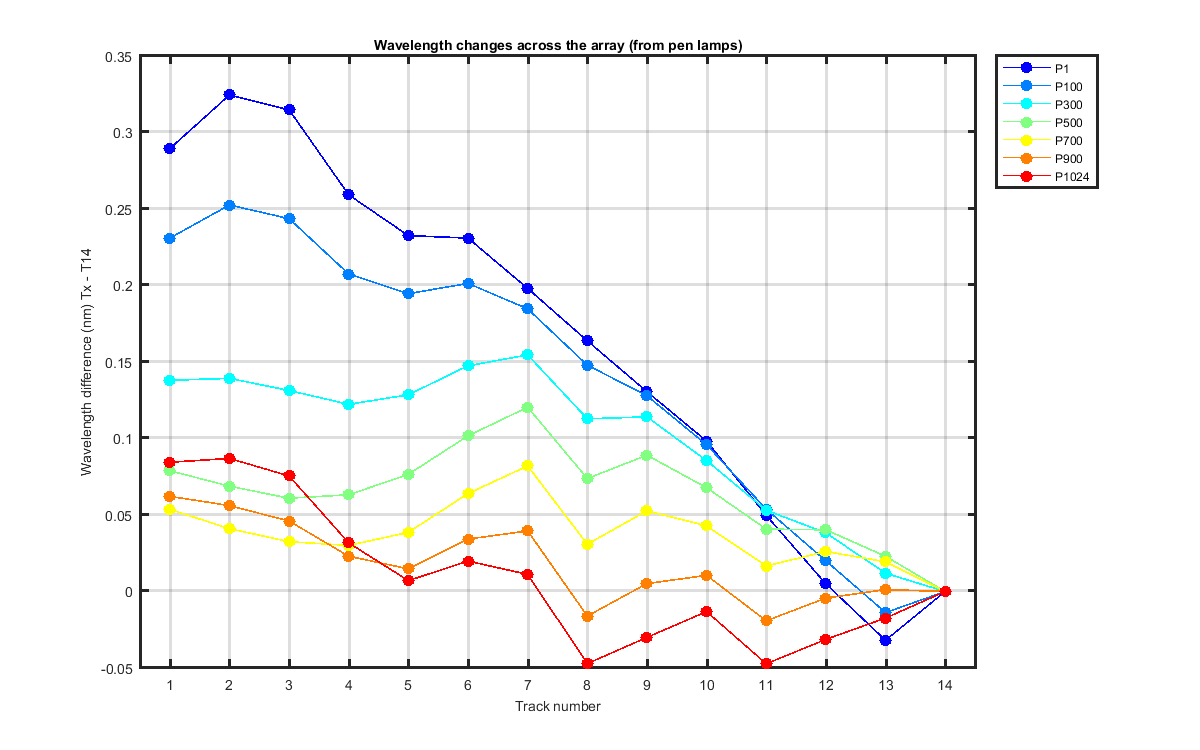
Figure 3 These three graphs (from pen lamps) show the how the wavelength change across the array. The first is relavtive to track 13. The second graph is just showing it in their real positions. The third graph is relative to track 2.