REVISION DATE: 14-Apr-2016 15:36:19
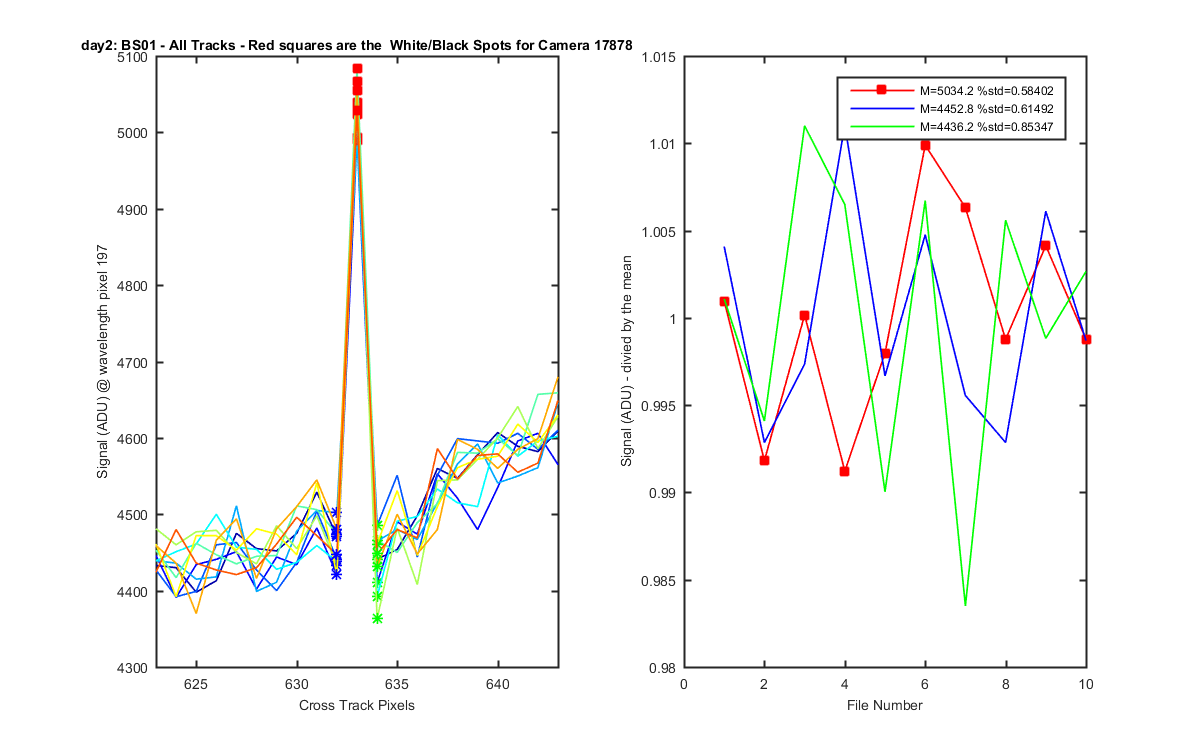
Mike pointed out that in the Andor Performance Booklets under Response Defects there is a listing of White/Black Spots. The definition in the doc for a White/Balc spot is "White/black pixels have signals >25% above/below the average (25% contrast) with uniform illumination across the sensor." Mike thought it would be a good idea to plot these to see where they showed up on the camera. Below are a image showing the location of the White/Black spots. Following that is a cross track plots. The problem pixels are very clear here. Some are higher and some are lower. But if they are consistently higher or lower doesnt the math work out. So The last set of graphs shows the White/Black spots in their own figures. The subplot on the right is the 10 data points for that spot on the 10 lamp data sets meaned the 10 points. Ditto for a pixel on each side of the featuer. The legend Has the Mean and std. The White/Black spots do not have a higher standard deviation. Not sure what that means.
Andor Camera SN: 17878
k X Y
1 503 561
2 138 61
3 297 228
4 656 391
5 709 632
6 197 633
Figure 1
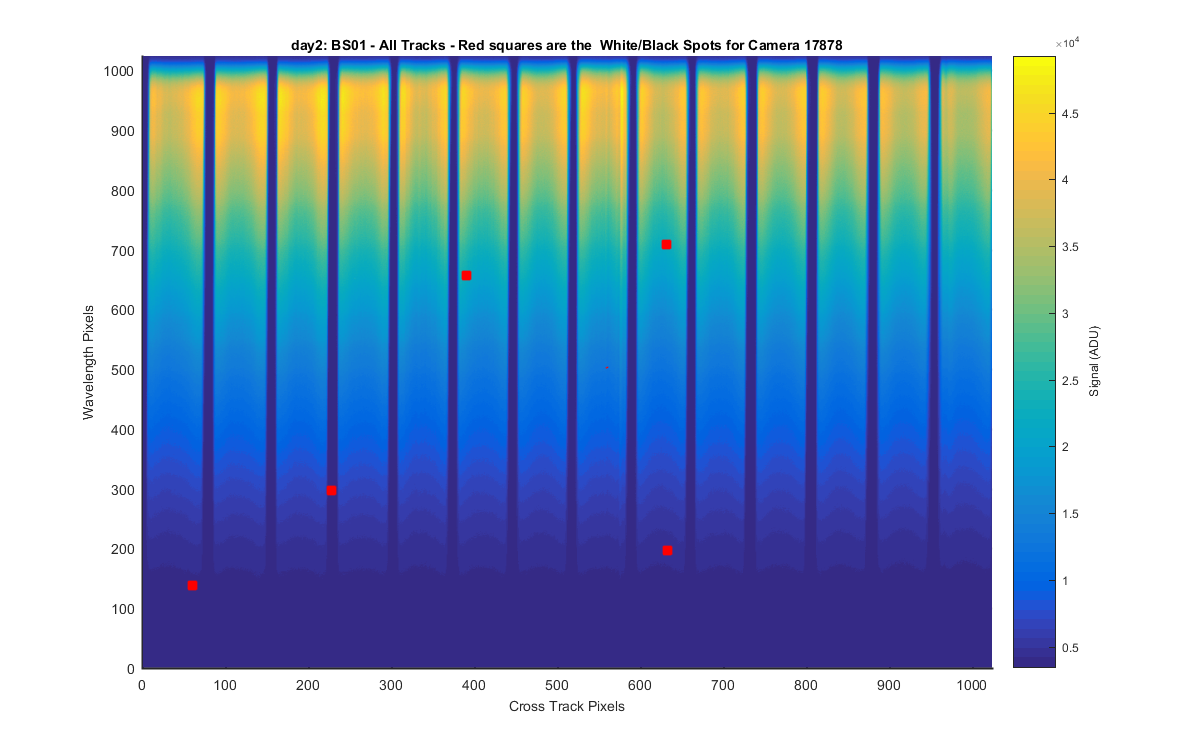
Figure 2
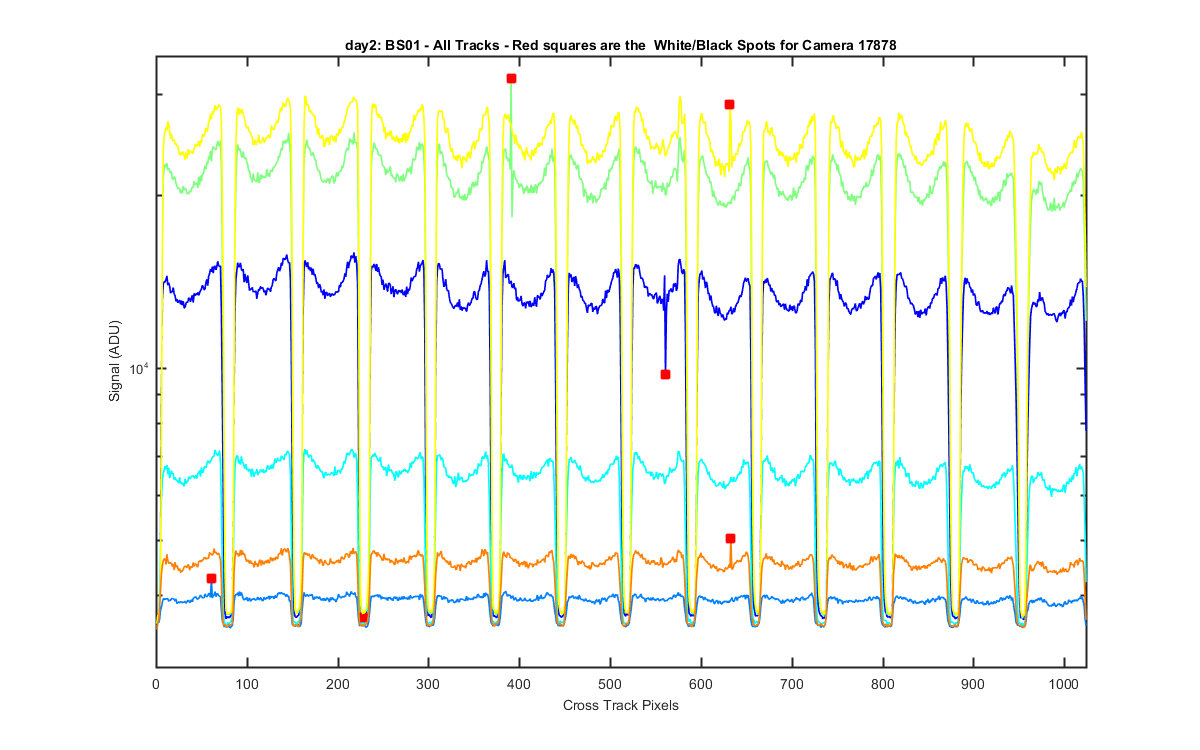
Figure 3
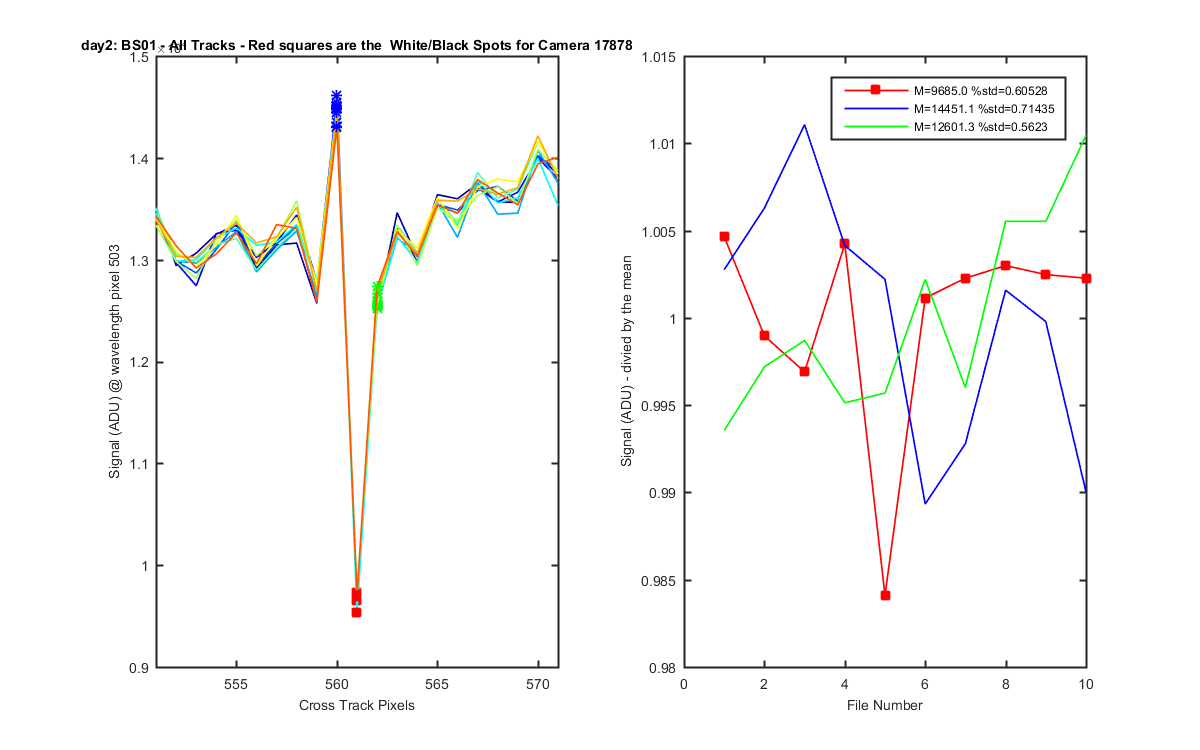
Figure 4
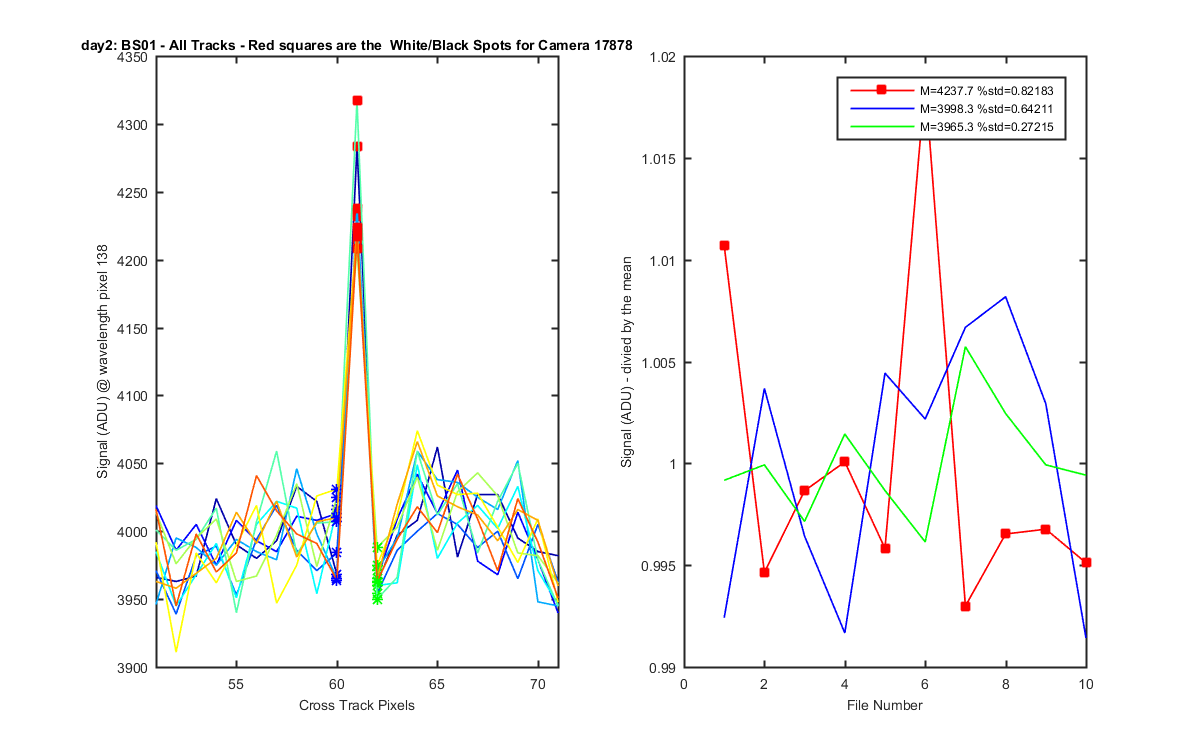
Figure 5
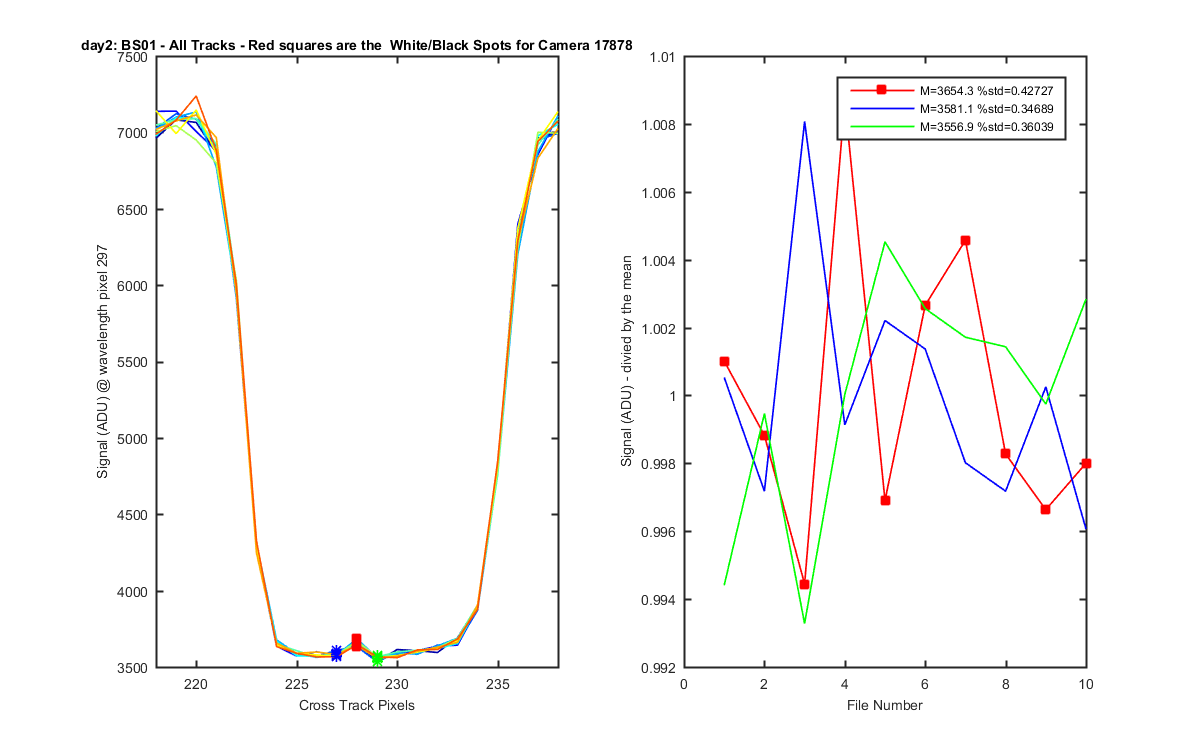
Figure 6
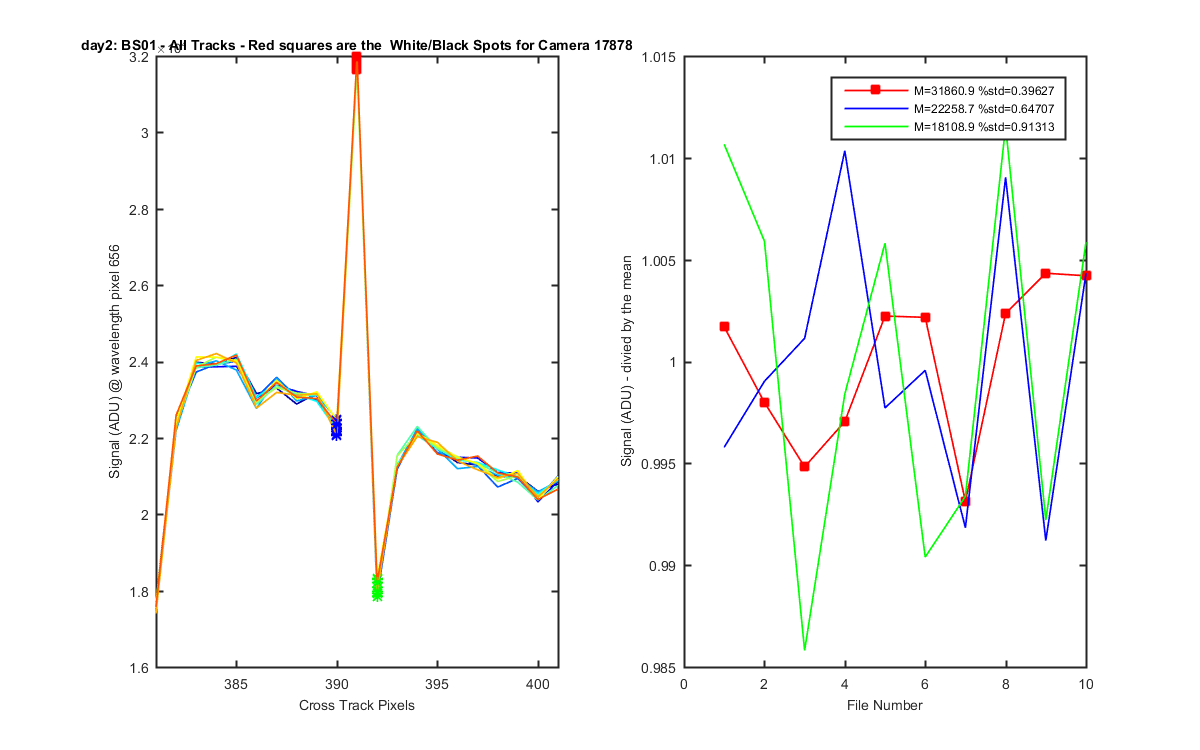
Figure 7
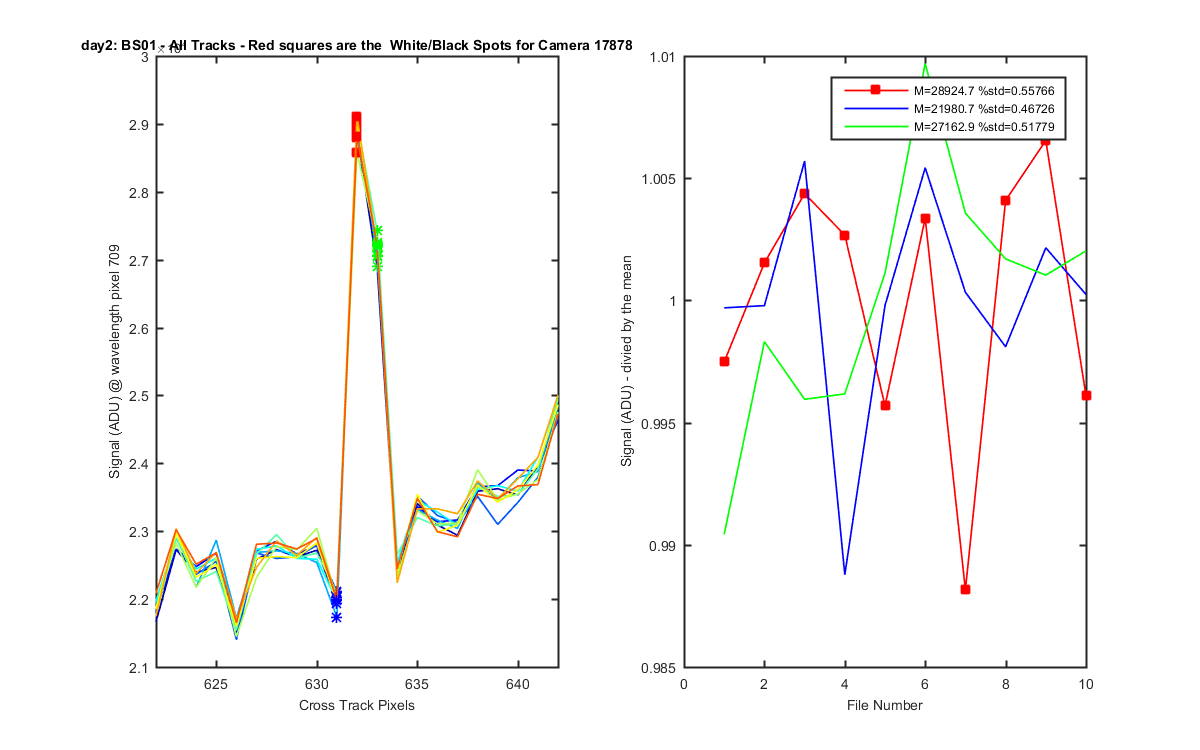
Figure 8