REVISION DATE: 30-Mar-2016 16:37:26
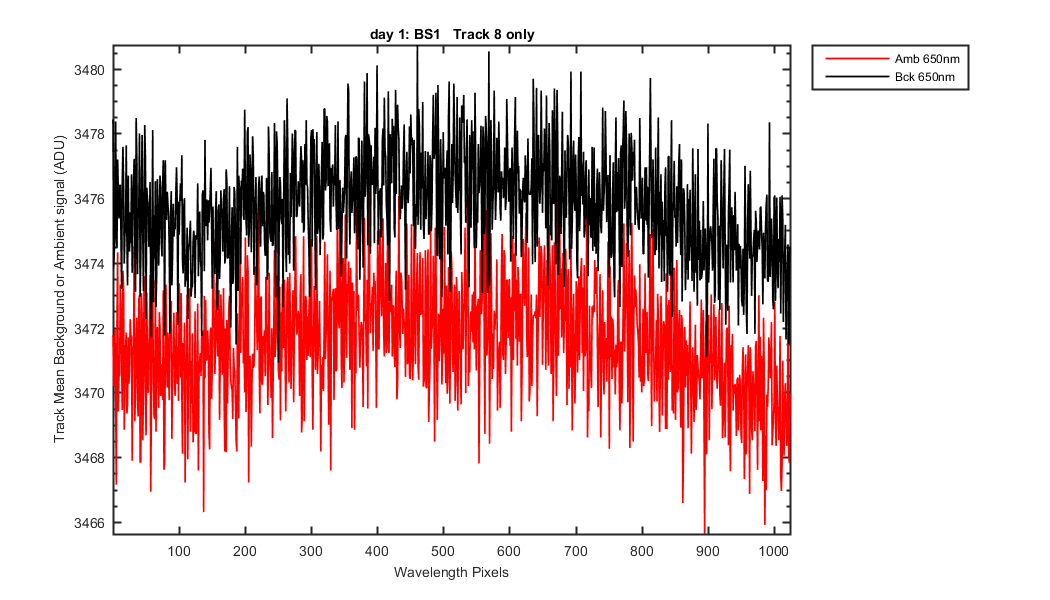
I wanted to take a quick look at the ambient and background "dark" Mike too with the Laser data. The first graph each symbol is the mean of the entire track. Cirlces are the ambient data and squares the background data. So you can see the changes over time and with track. The second graph shows the two ambient and background track 8 data sets closest to each other. All looks well here. I see not evident of light leaks or problems with the darks.
Figure 1
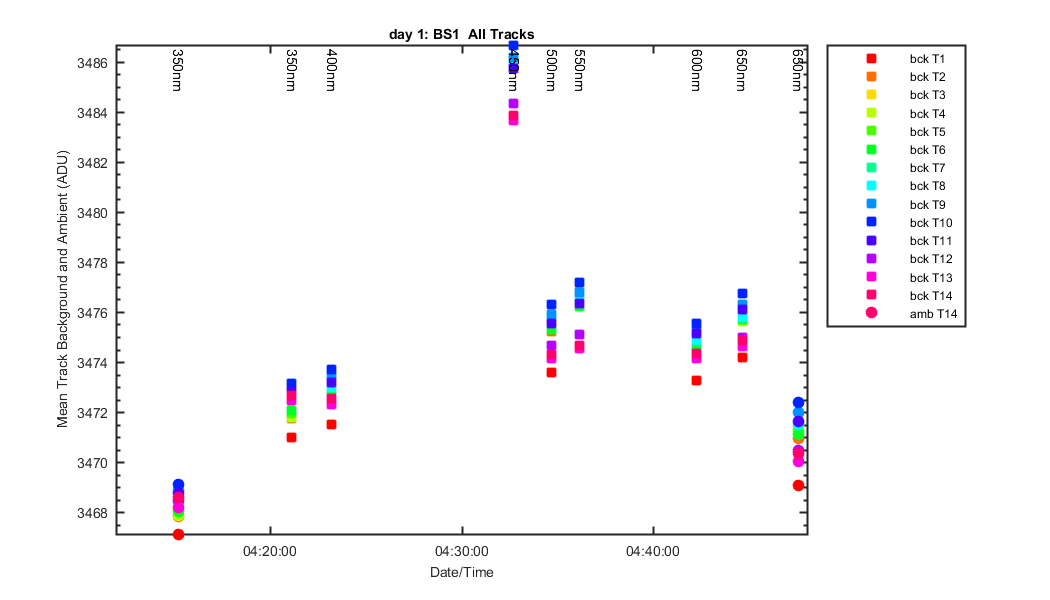
Figure 2
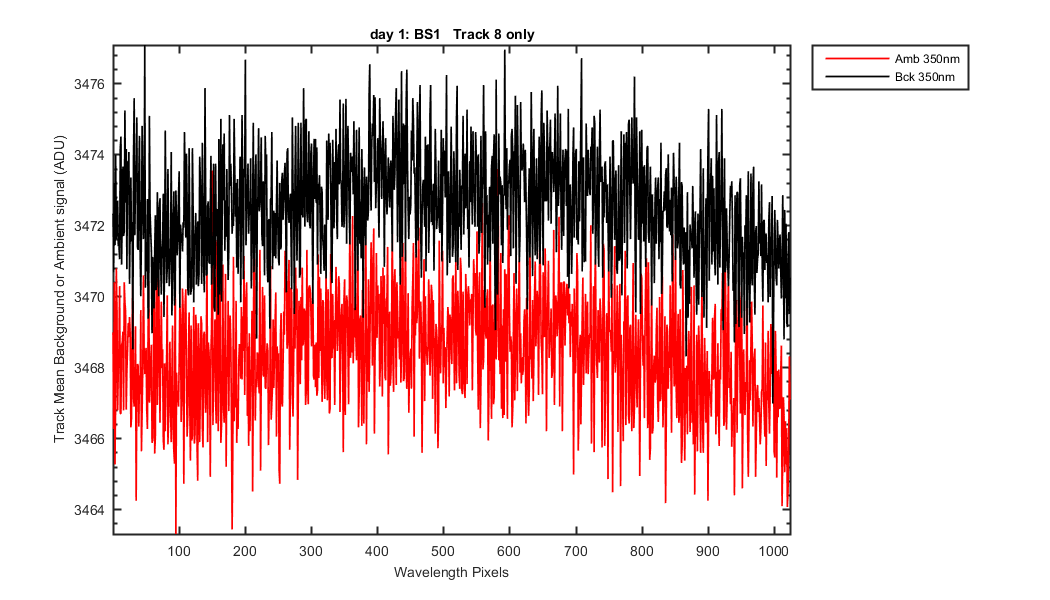
Figure 3