REVISION DATE: 02-Apr-2016 10:39:25
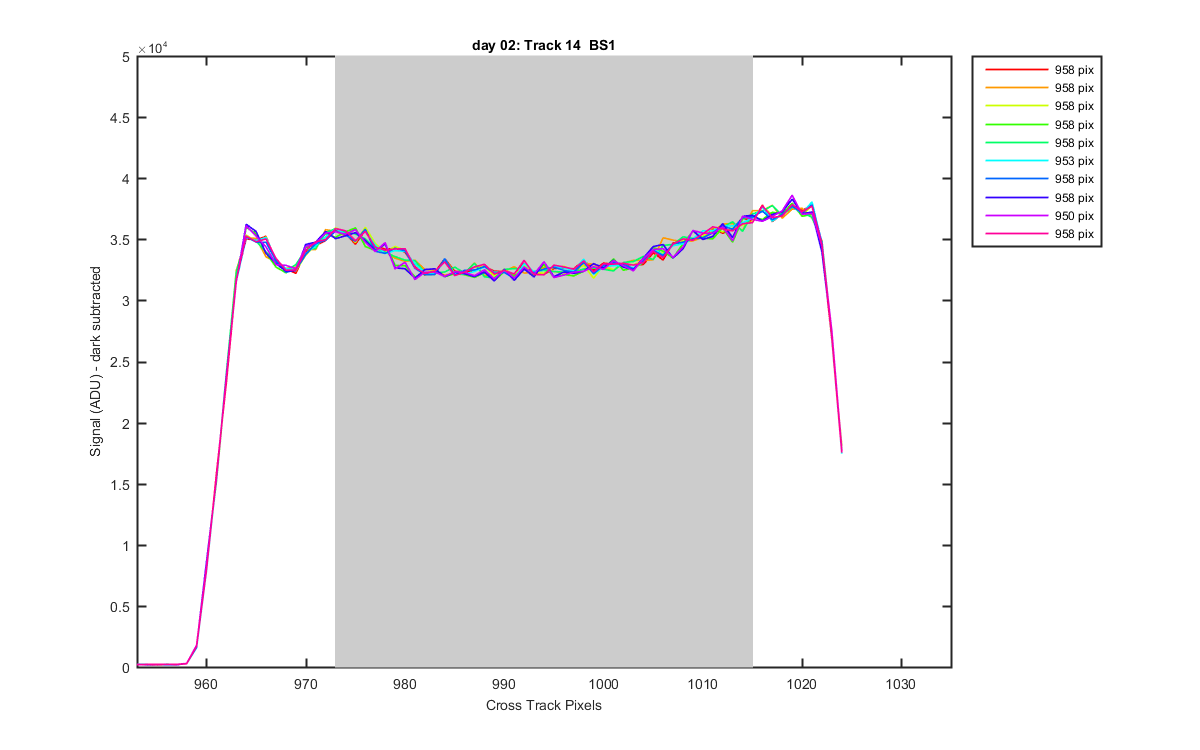
The graphs below show how I defined the tracks. Grey patches are what is averaged for each track. These are created from OL455 Lamp data, 10 data sets. The track definitions are from the Haw-2015-03, They look beter than the laser data.
Track pixels:
Track:  1       2       3       4       5       6       7       8       9      10      11      12      13      14
Left:   16      94     169     244     316     388     461     532     604     674     748     821     896     973
Right:  64     144     216     290     363     434     507     577     649     720     793     866     941    1015
Figure 1
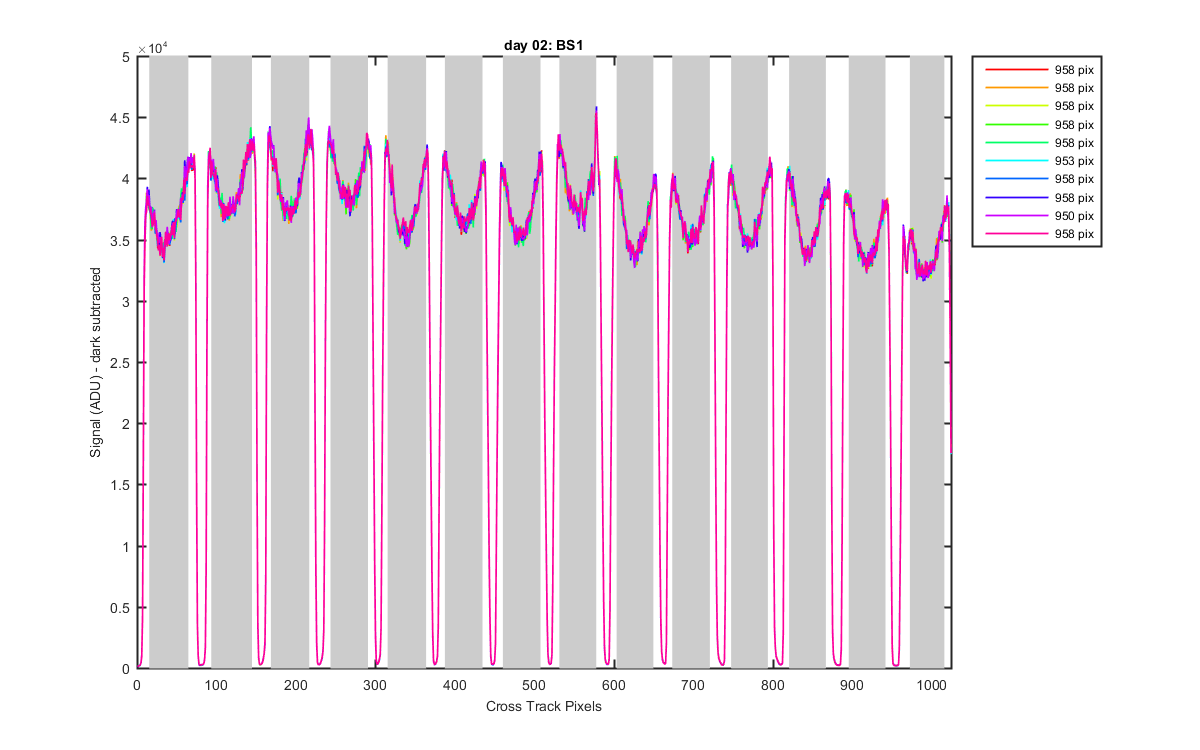
Figure 2
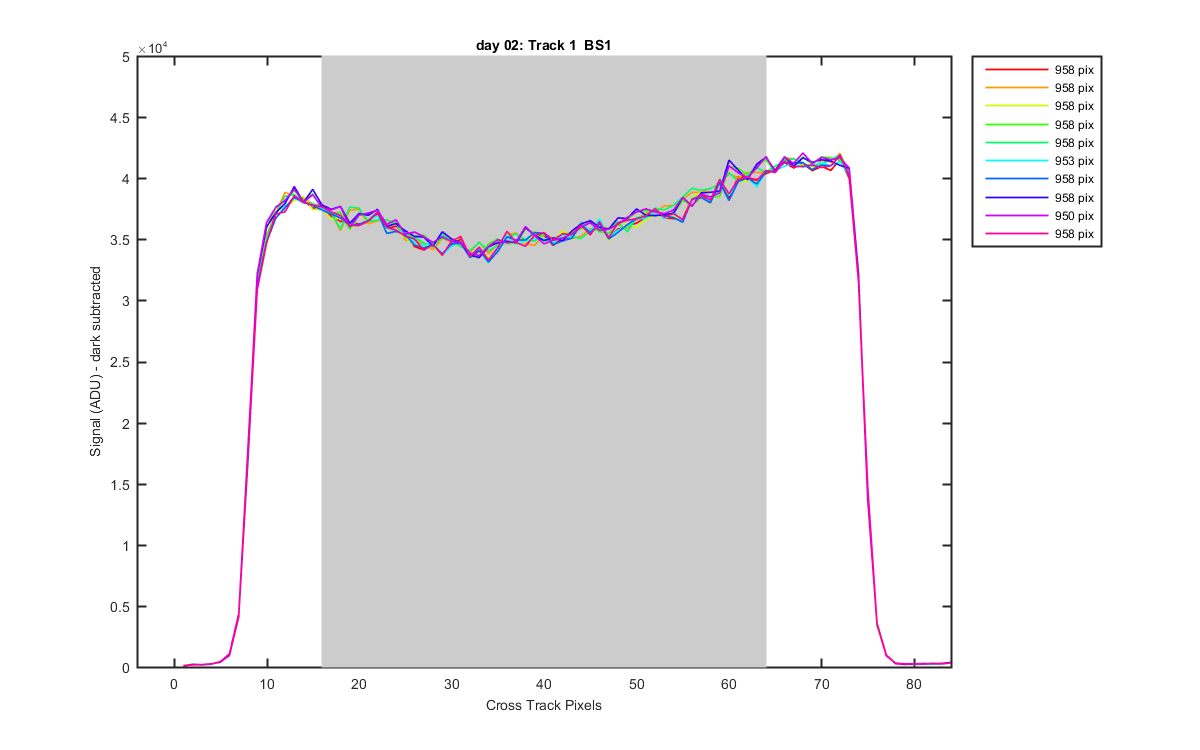
Figure 3
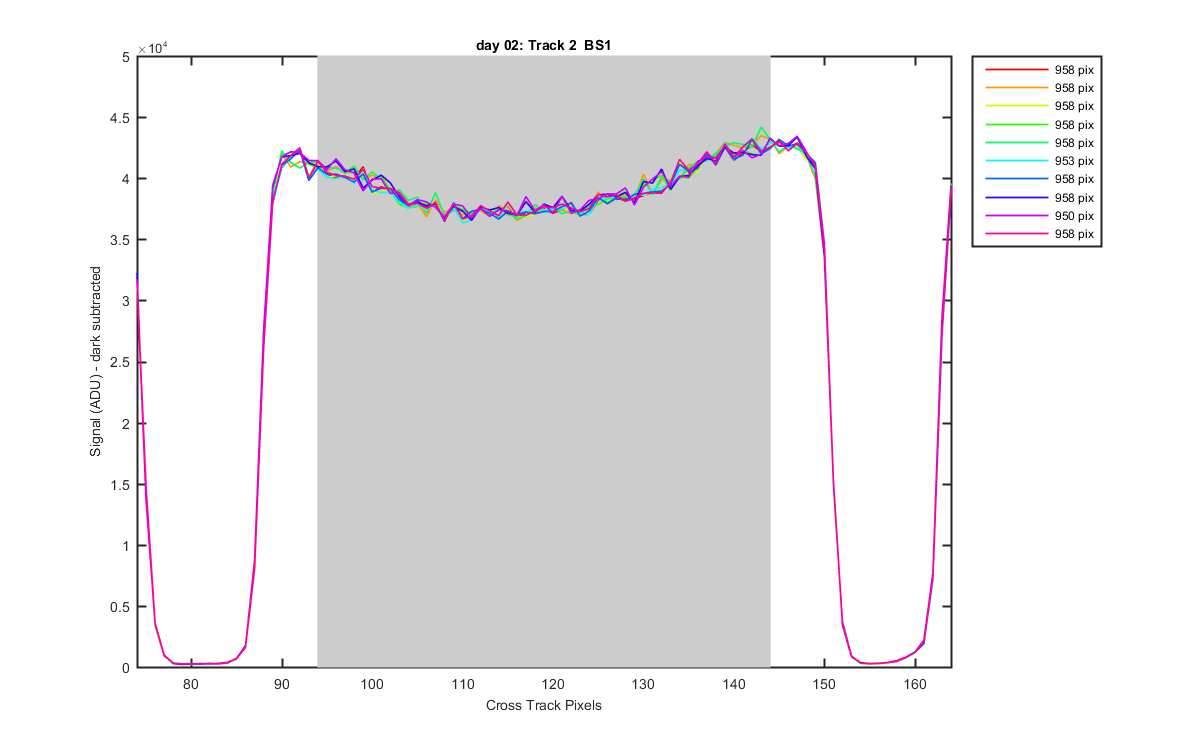
Figure 4
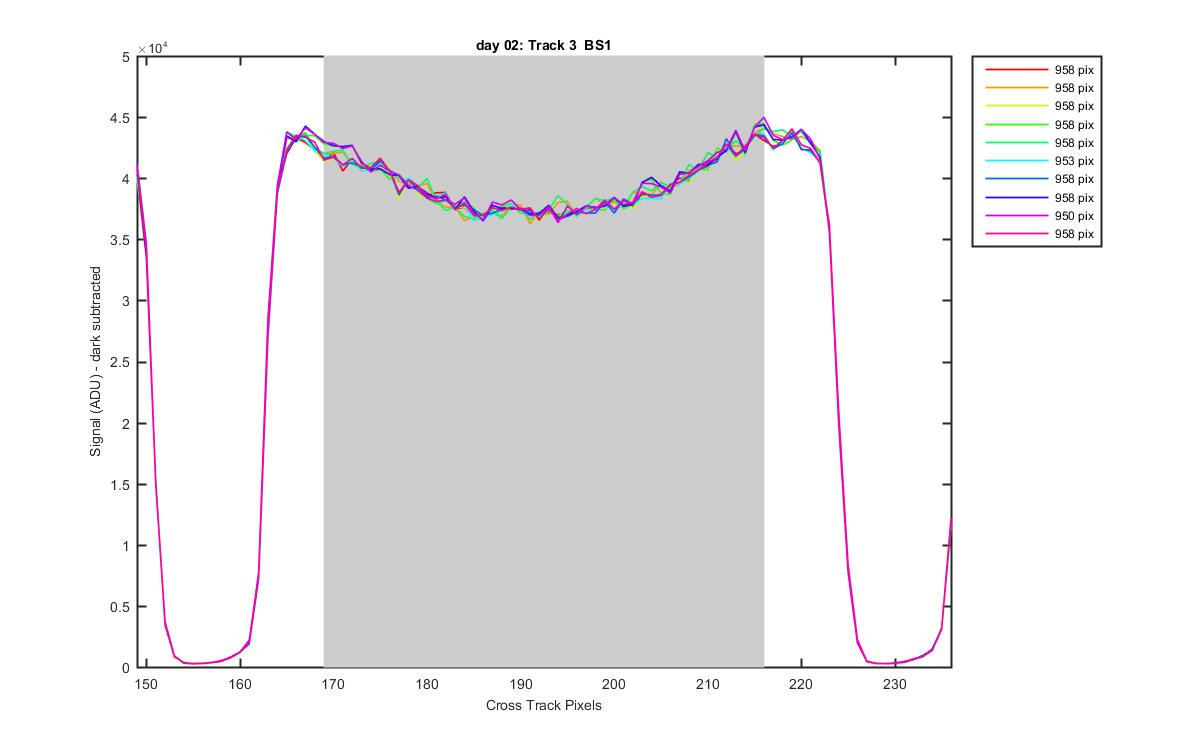
Figure 5
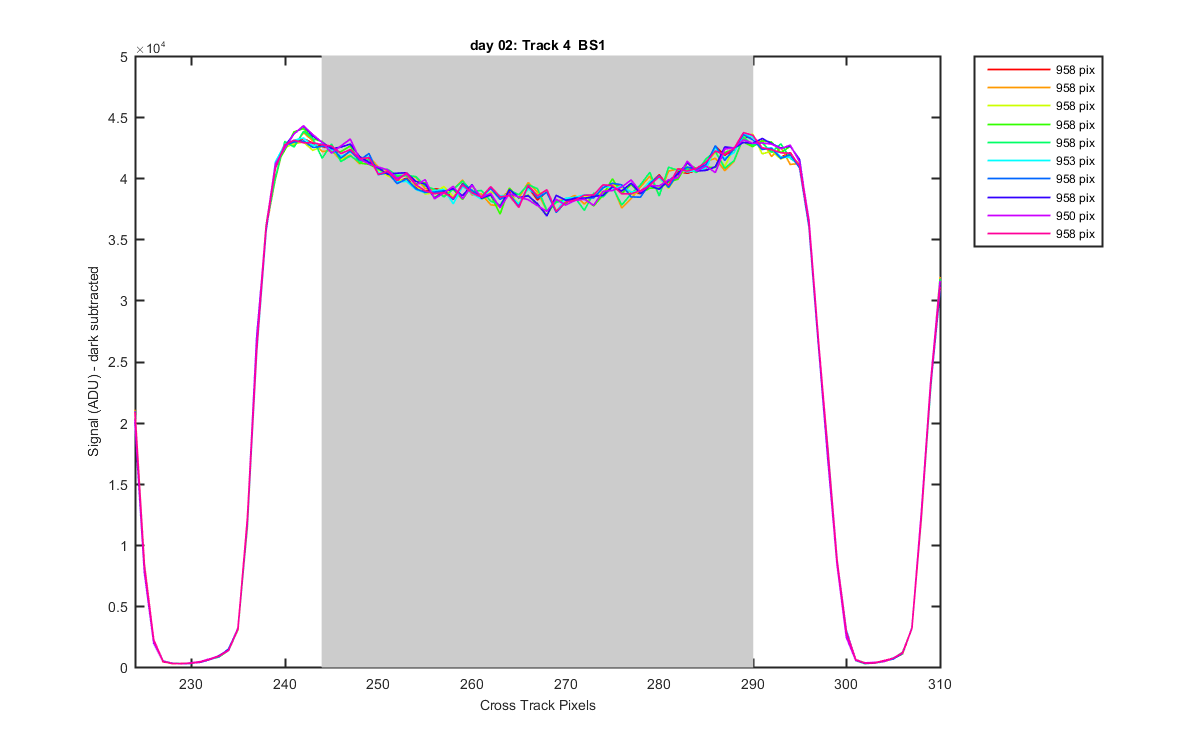
Figure 6
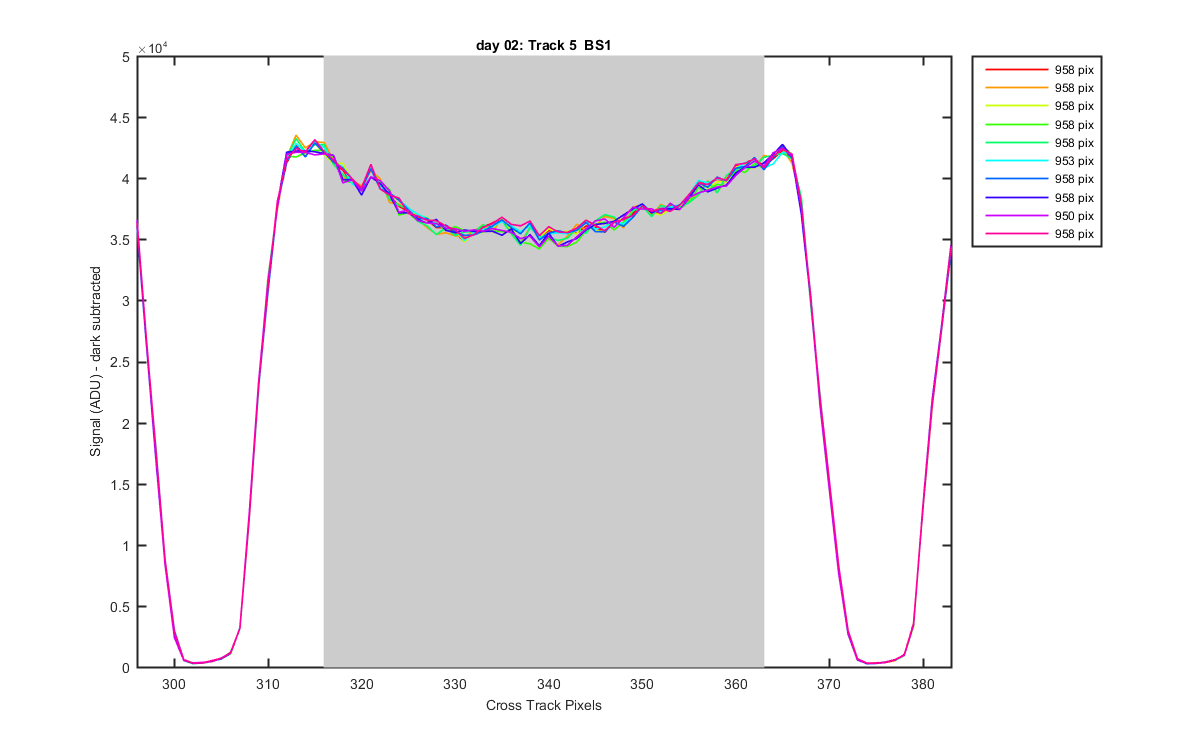
Figure 7
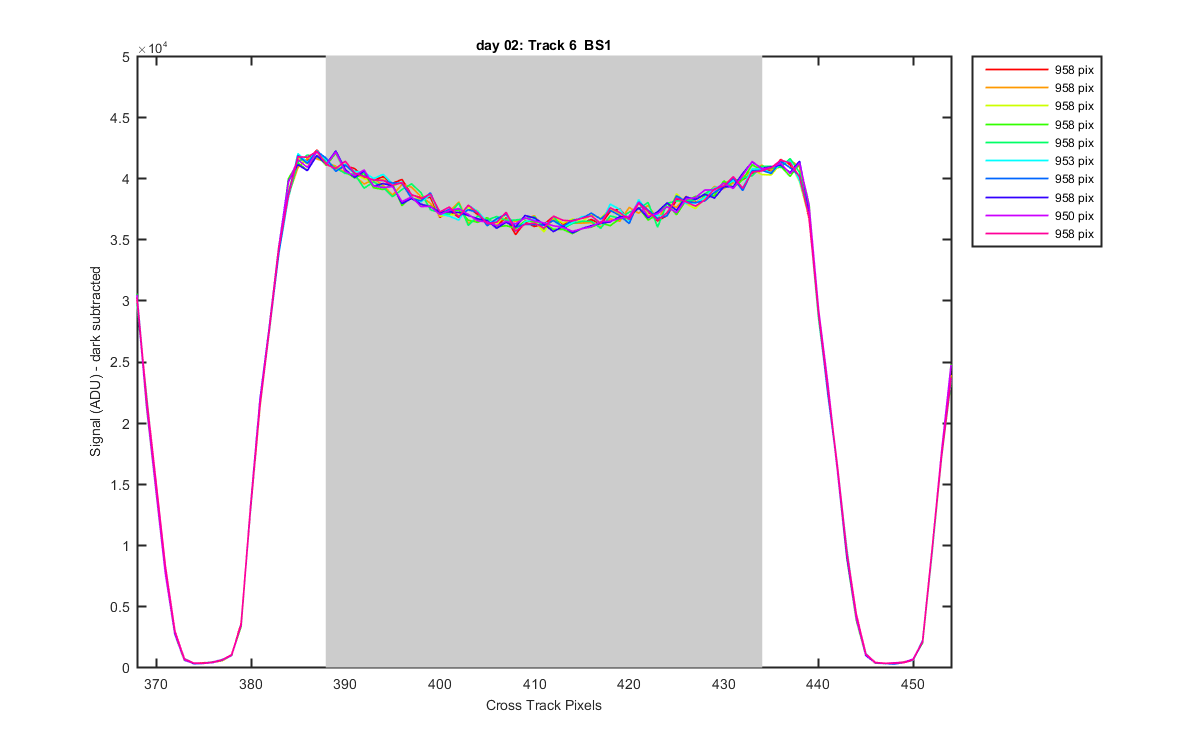
Figure 8
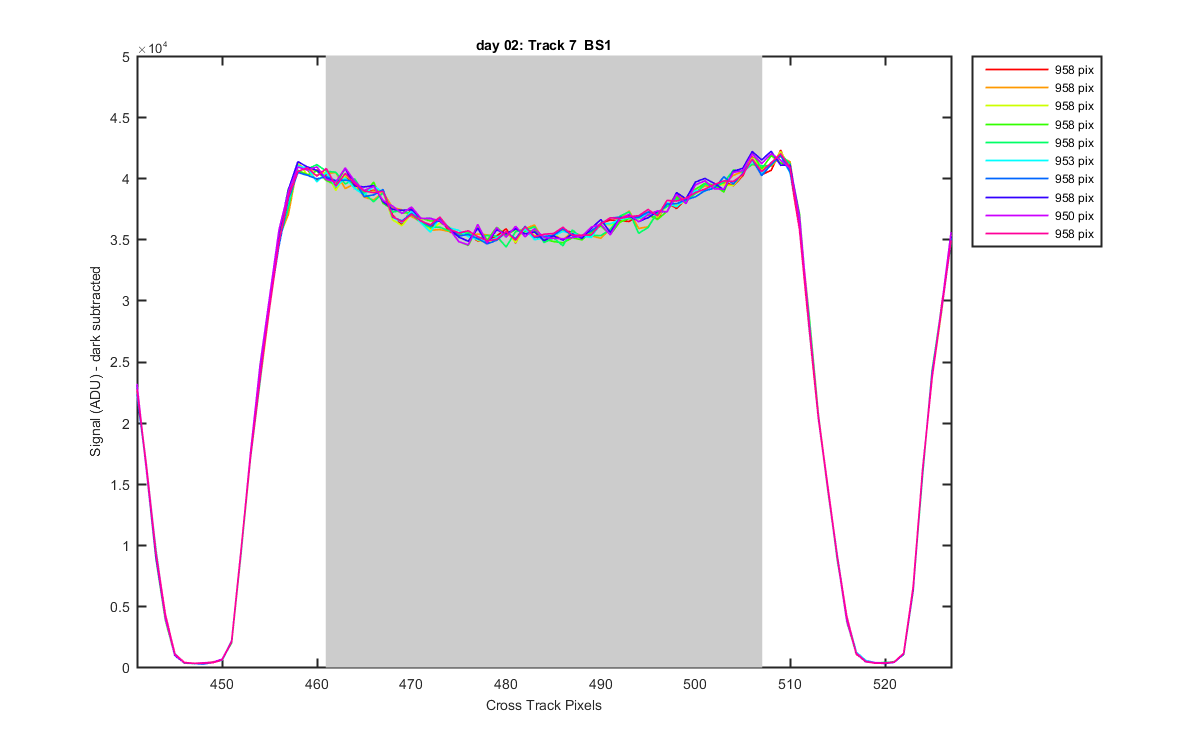
Figure 9
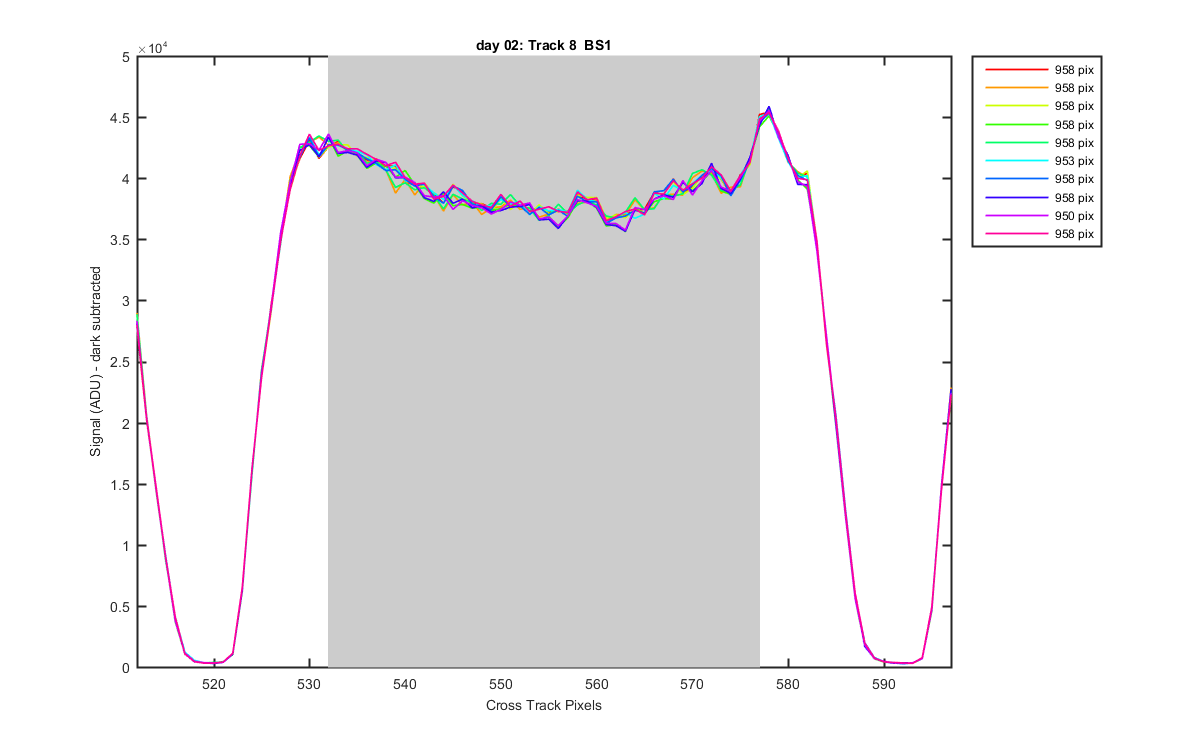
Figure 10
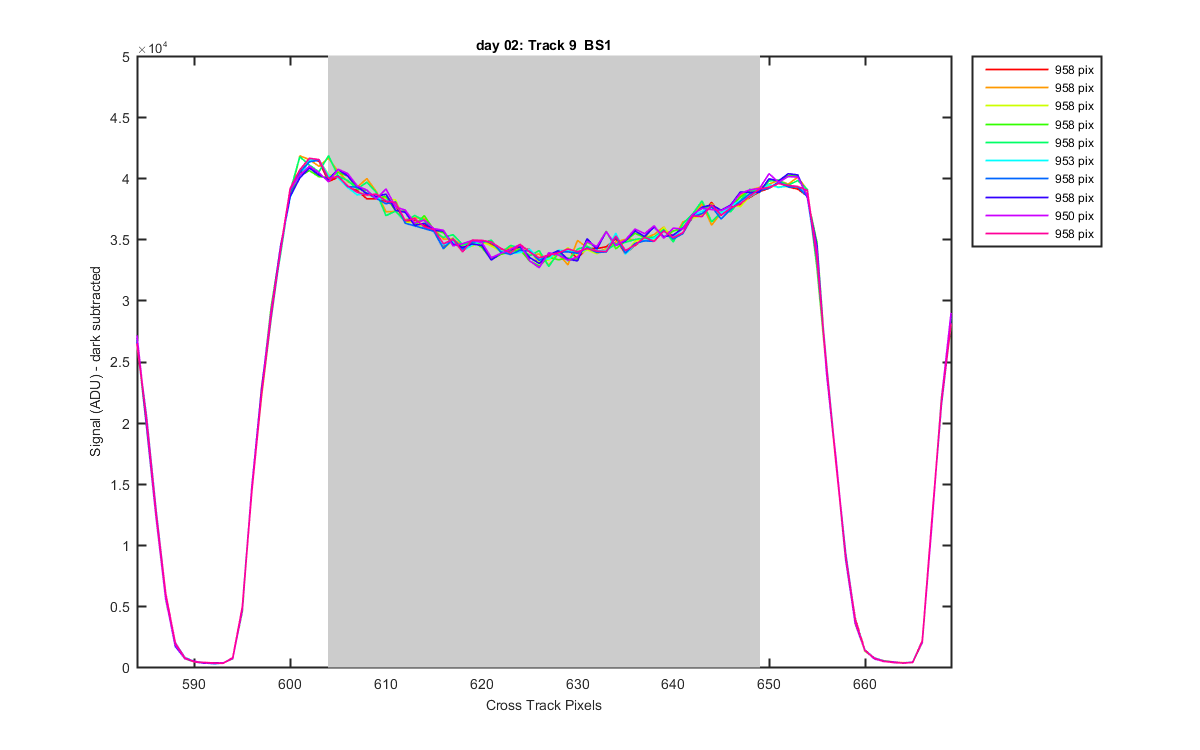
Figure 11
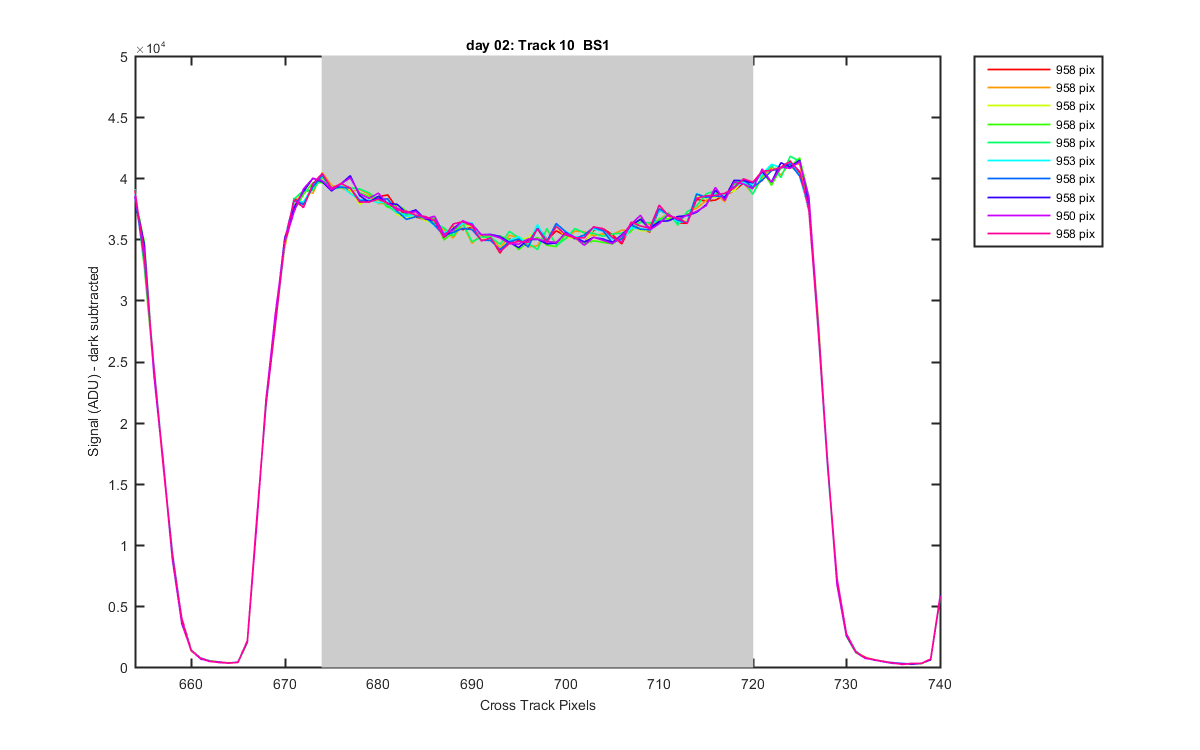
Figure 12
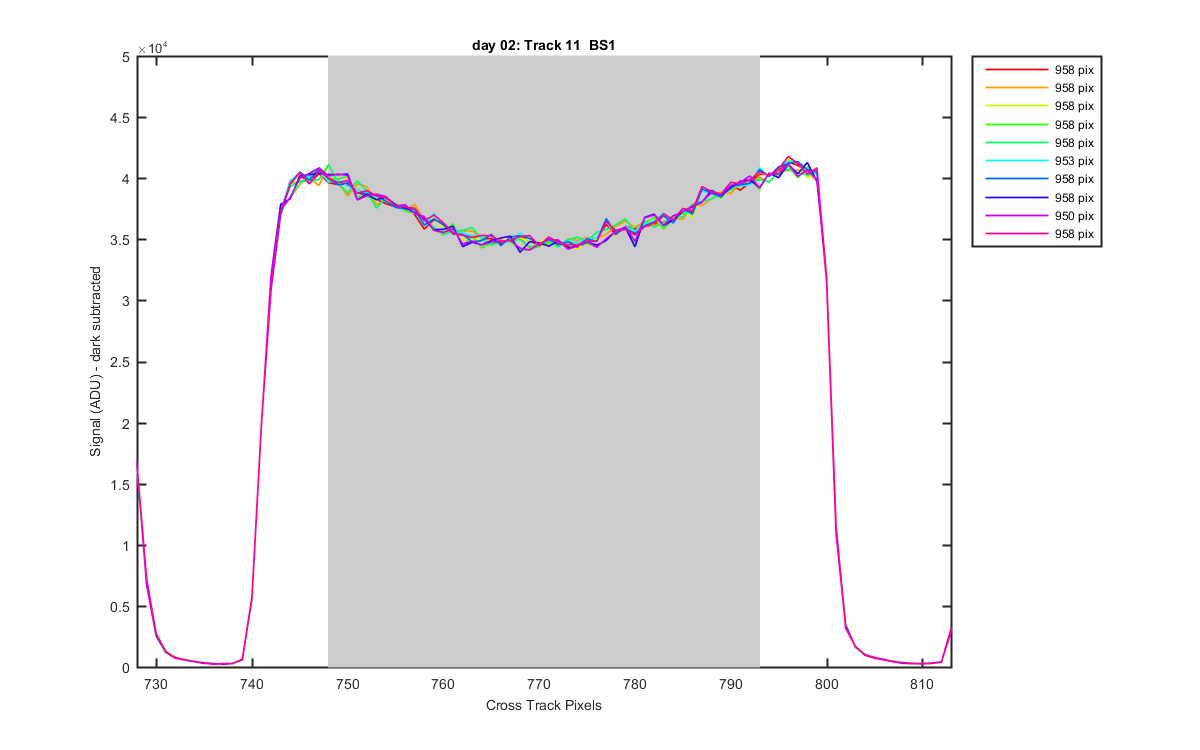
Figure 13
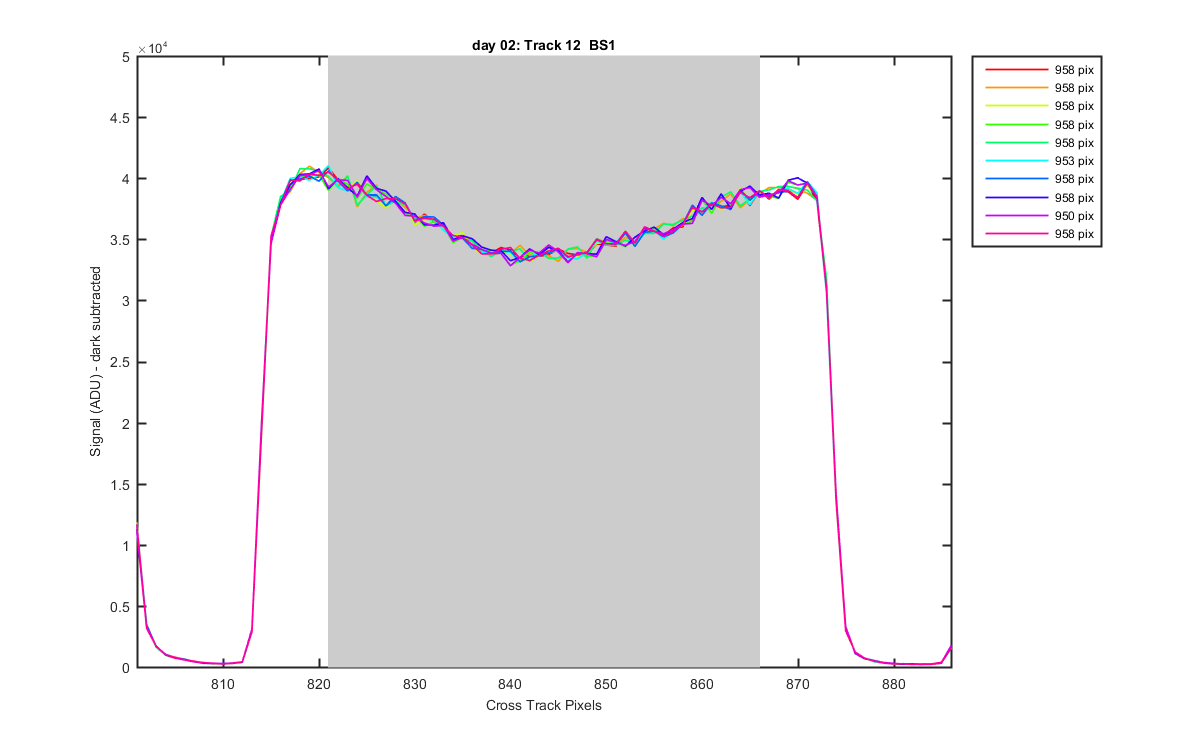
Figure 14
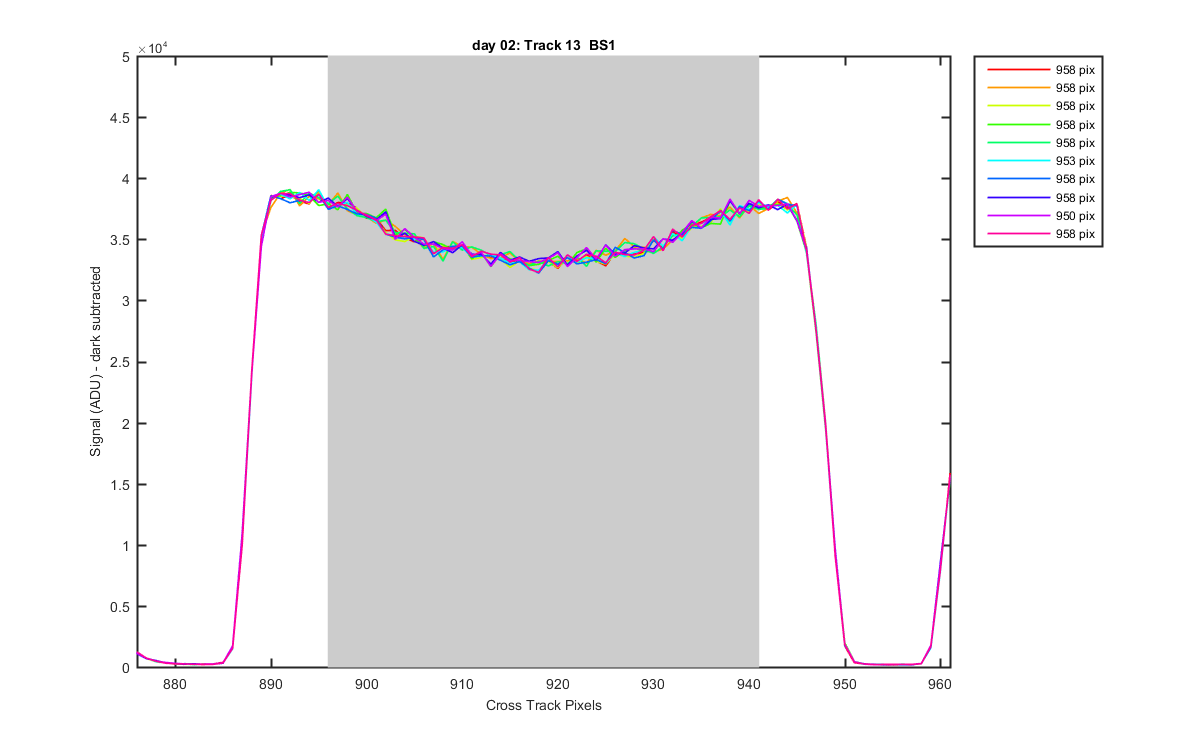
Figure 15