REVISION DATE: 13-Apr-2016 10:09:06
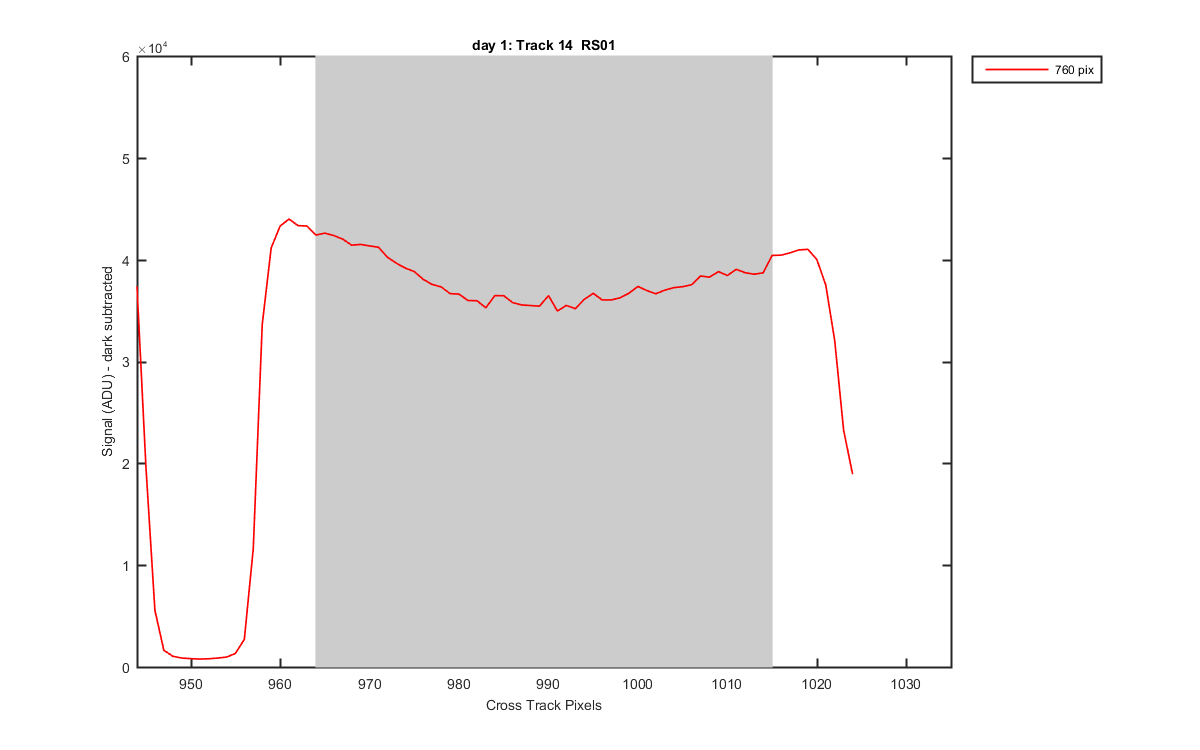
The graphs below show how I defined the tracks. Grey patches are what is averaged for each track. These are created one set of lamp data .
Track pixels:
Track:  1       2       3       4       5       6       7       8       9      10      11      12      13      14
Left:   8      87     166     237     309     382     454     526     597     672     742     814     888     964
Right:  61     137     209     283     357     427     499     570     644     717     788     863     938    1015
Figure 1
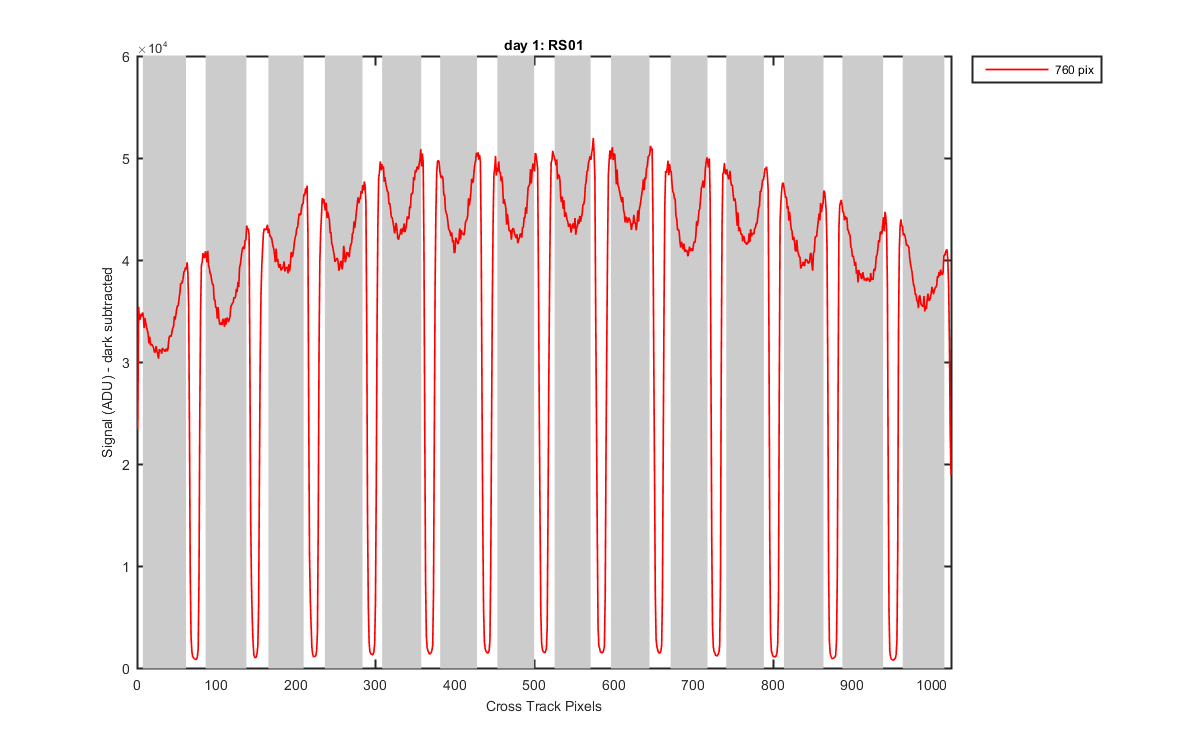
Figure 2
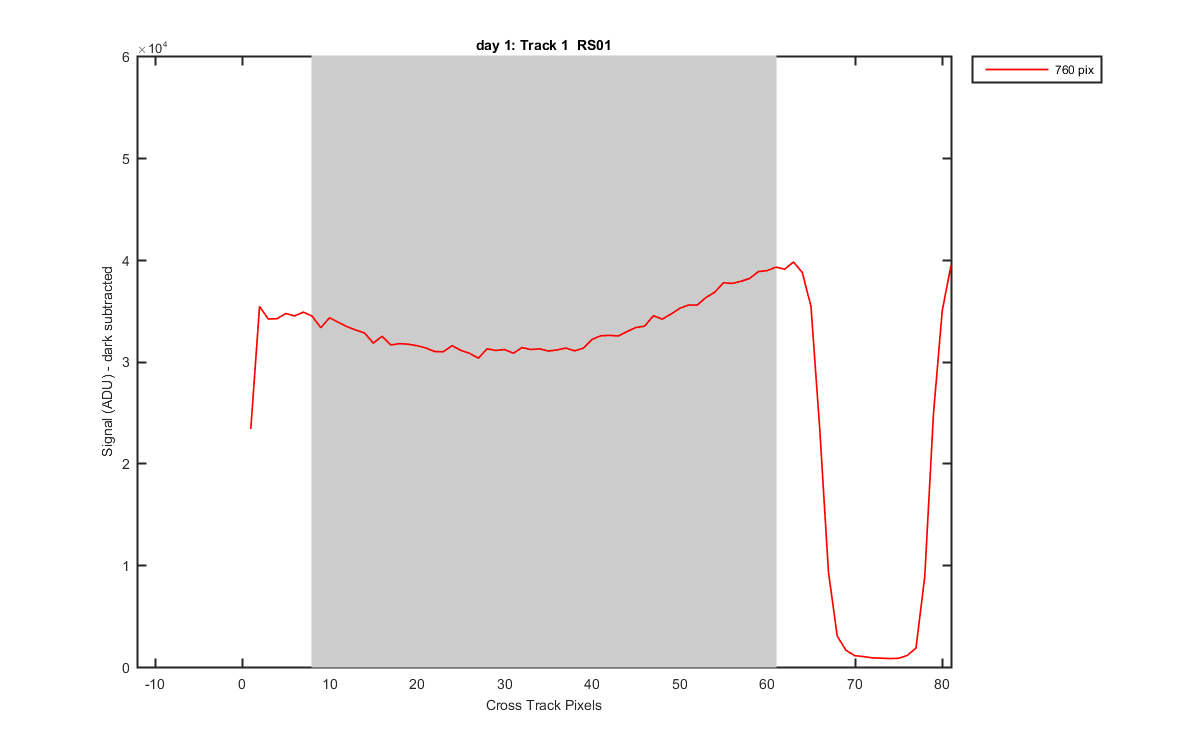
Figure 3
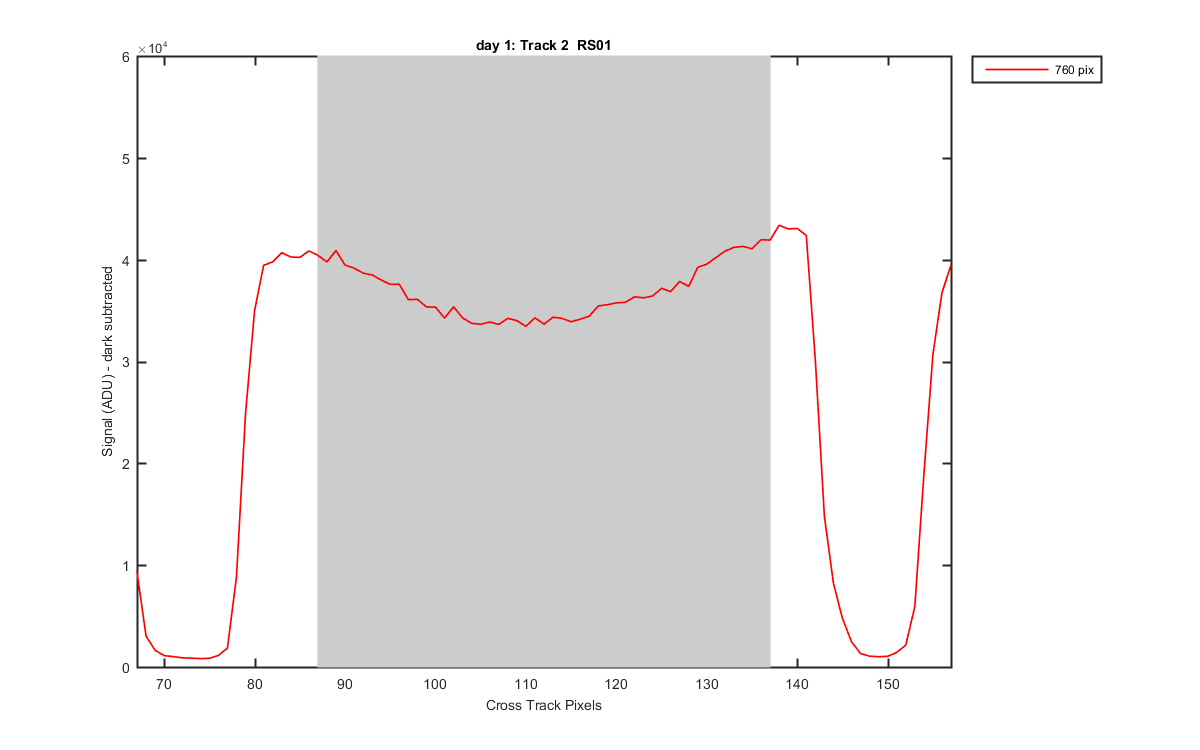
Figure 4
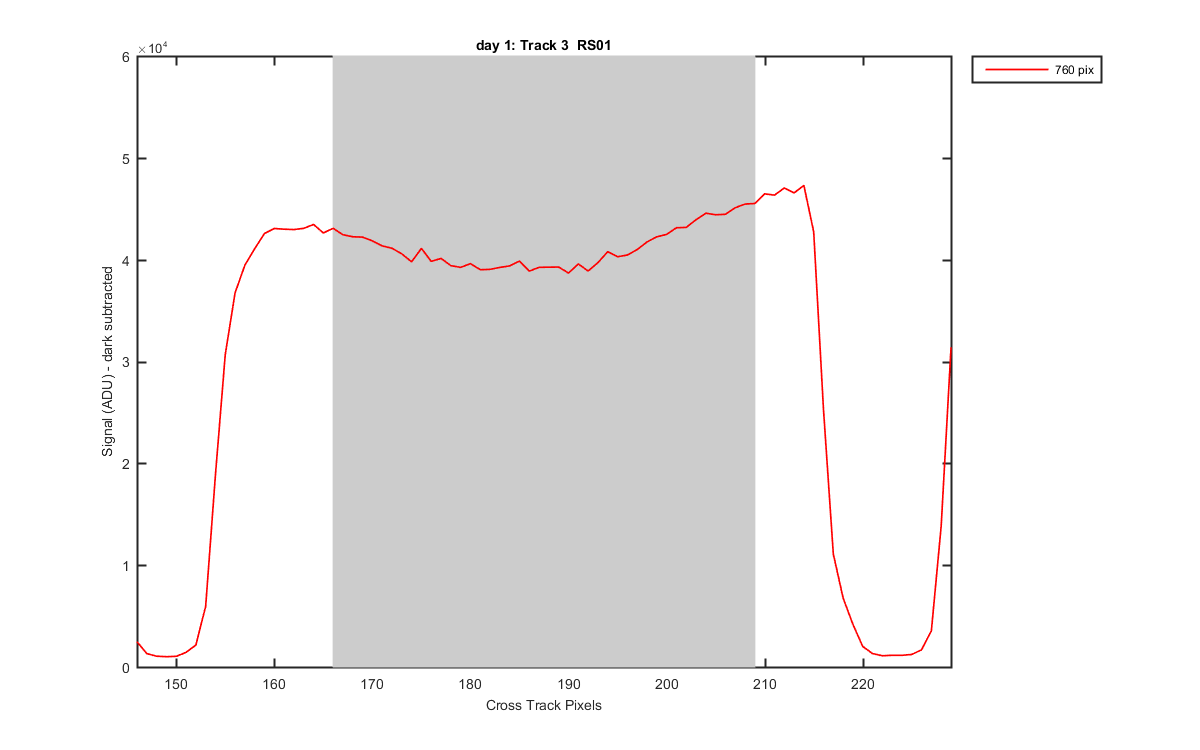
Figure 5
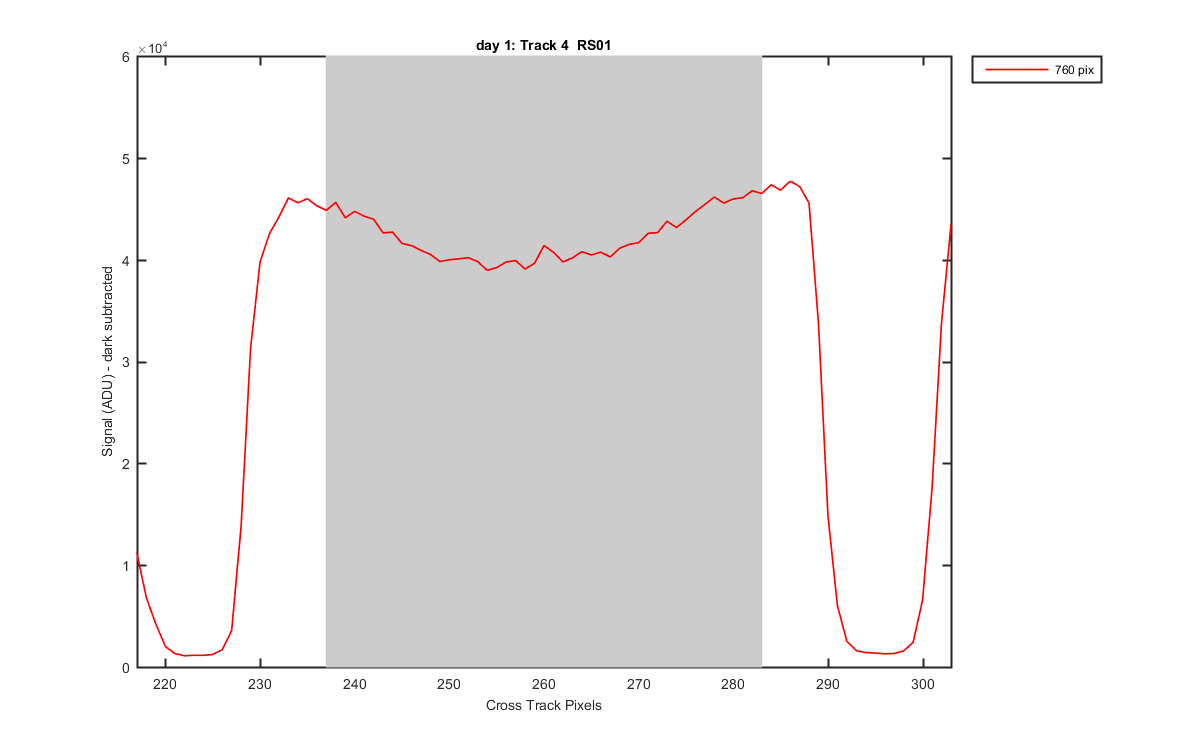
Figure 6
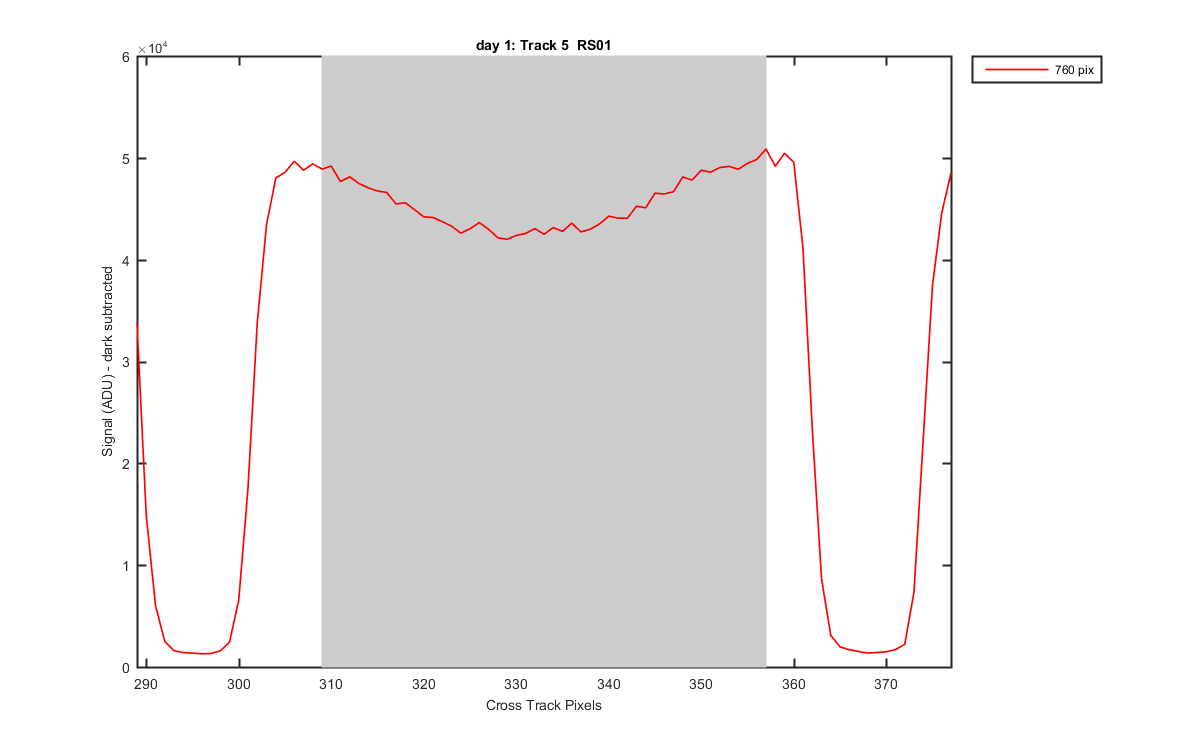
Figure 7
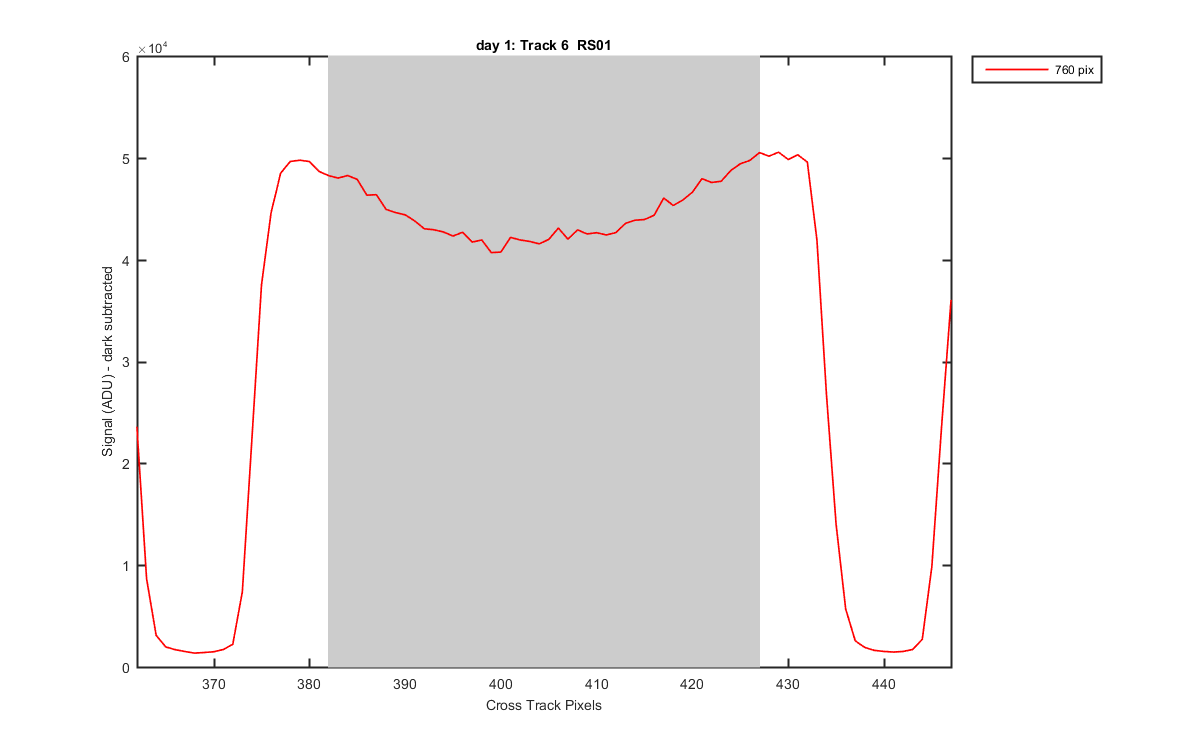
Figure 8
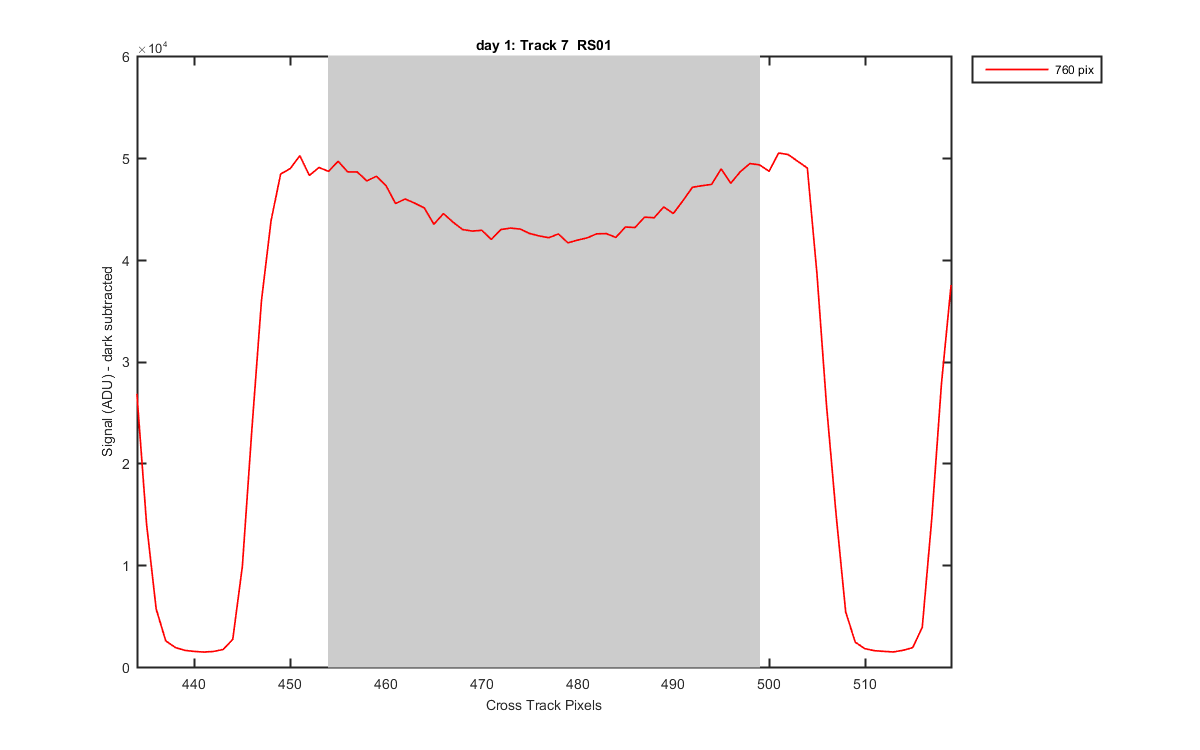
Figure 9
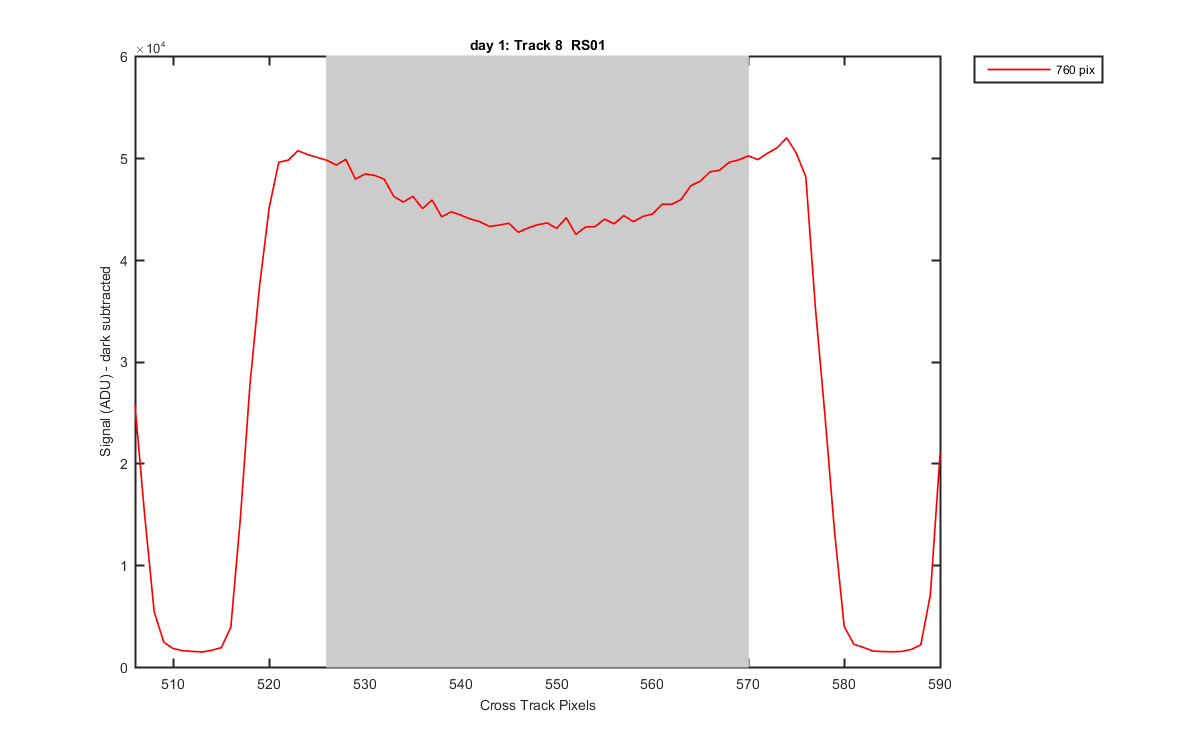
Figure 10
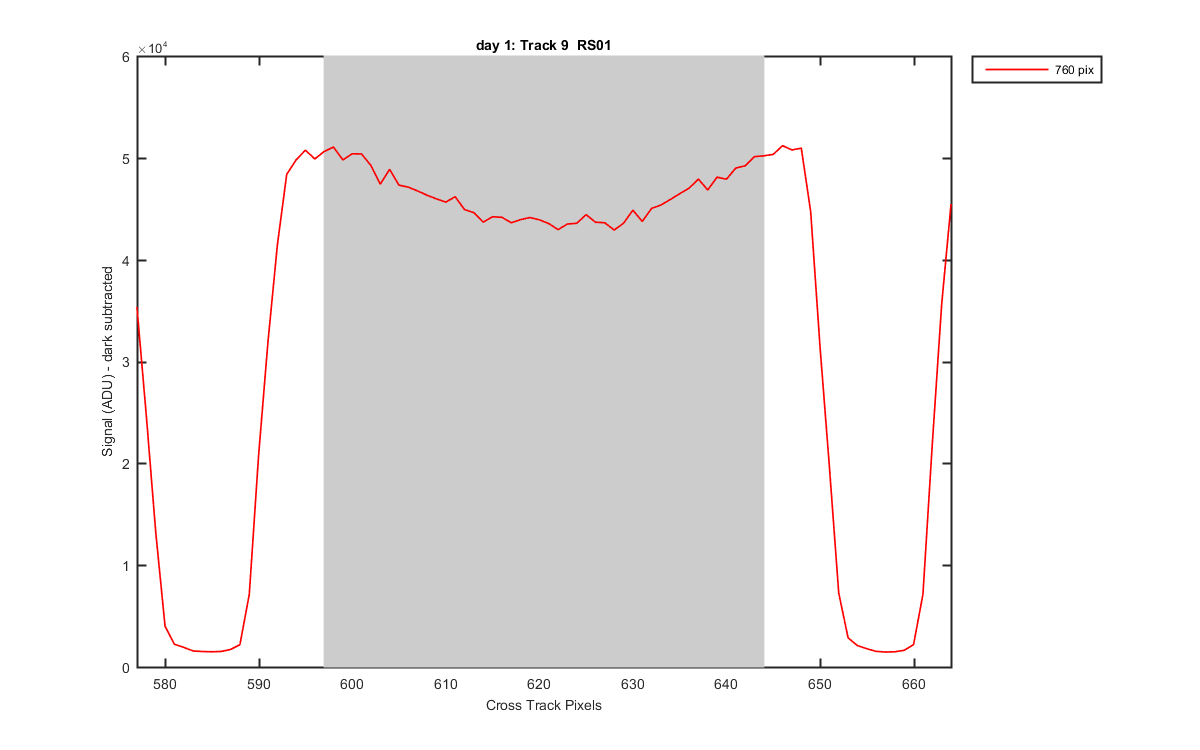
Figure 11
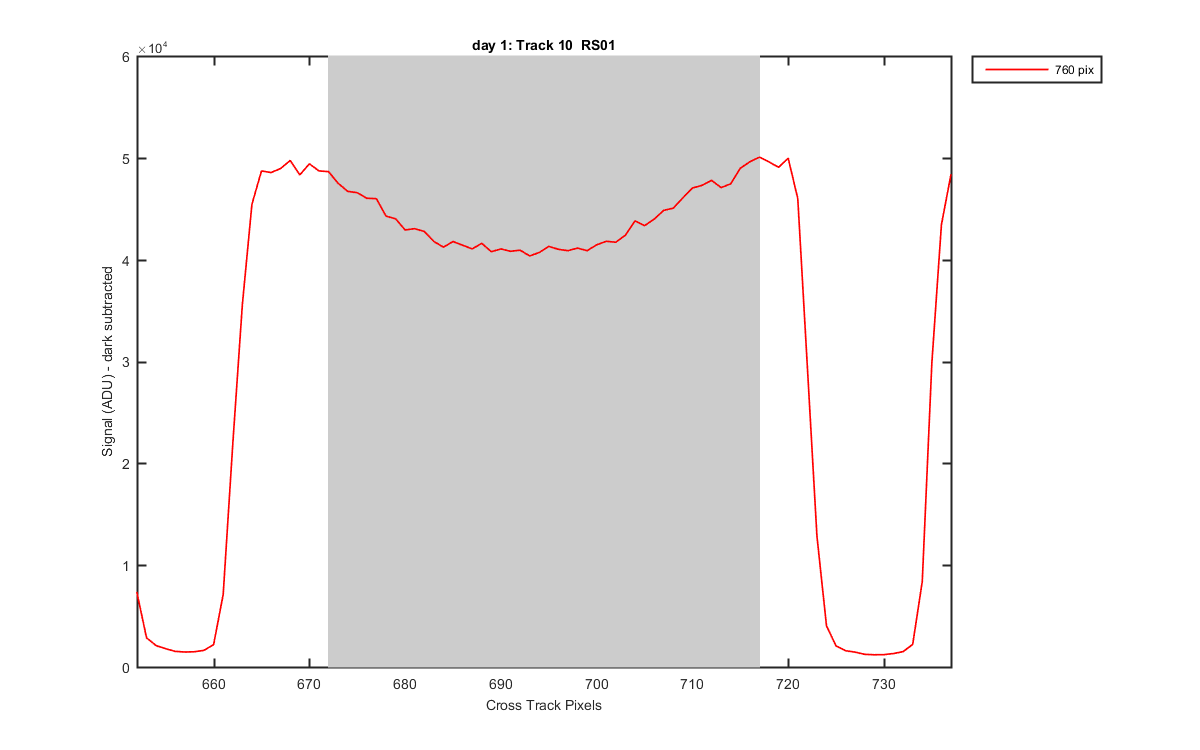
Figure 12

Figure 13
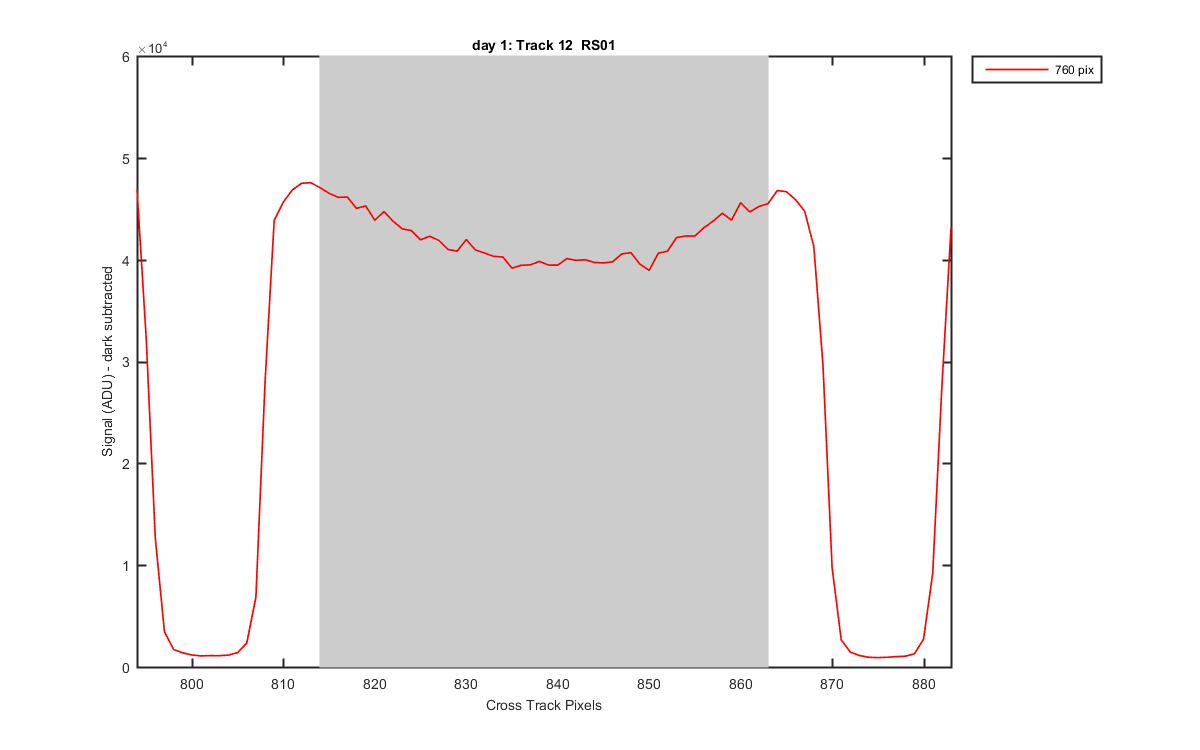
Figure 14
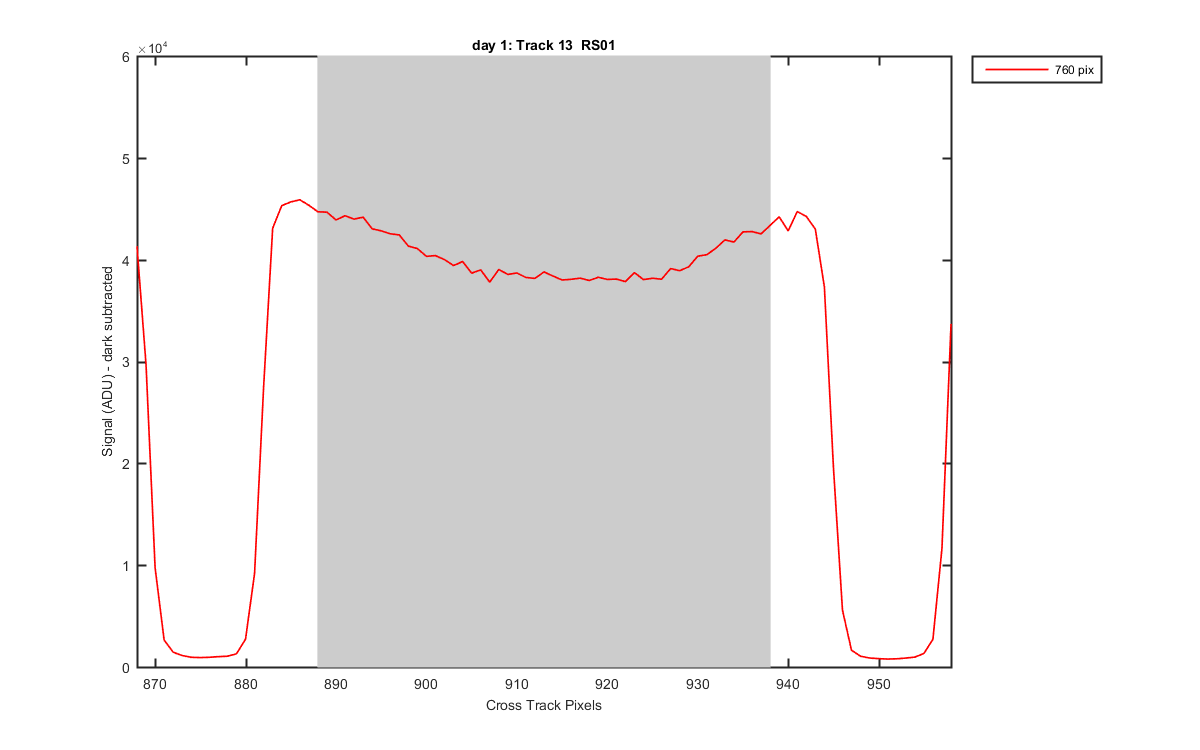
Figure 15