REVISION DATE: 26-Aug-2016 16:12:38
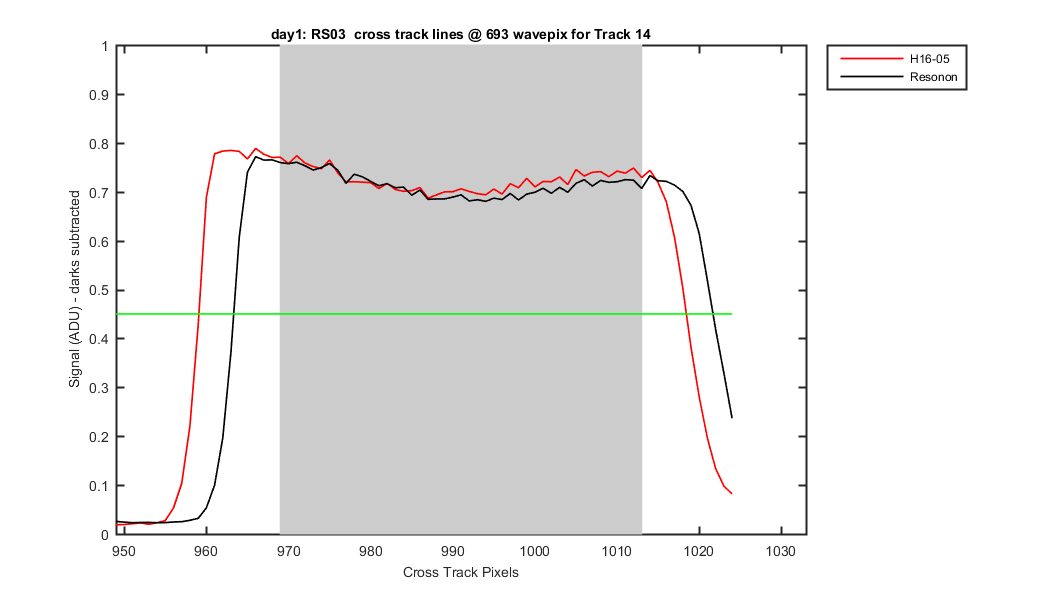
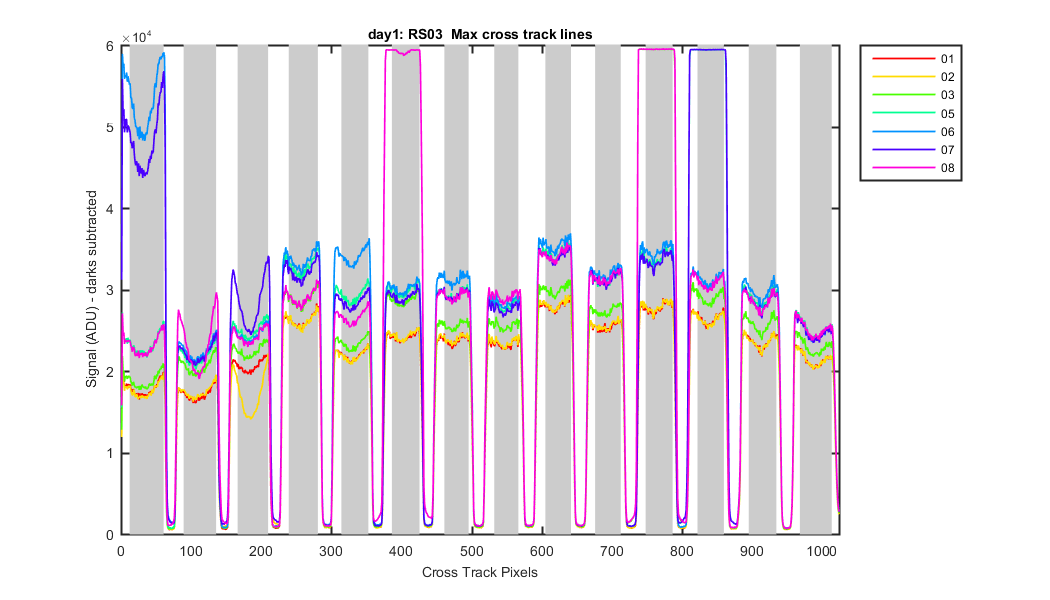
Mike took some "solar" data using the RSG03 before shipment to Miami to check for track movement and a wavelength check. So we can check again in Miami to see if anything moved. Plotted below are the Solar data showing some track saturated and I also compared the data to the Sphere data collected at Resonon before shiping to Hawaii. It looks like the tracks have moved.
Mike notes: I took a few signal scans and a couple background scans with the RS03cfg01 before it was FedExed to Miami for Ken & Art to work with. Only the bare Leoni fiber bundle fibers were used as collectors. They looked at a gray plaque illuminated by the sun - kinda: the plaque was WAY to bright in the sun, so I moved it into the shade at the door-way of the first high-bay here at Pier 35.
Figure 1
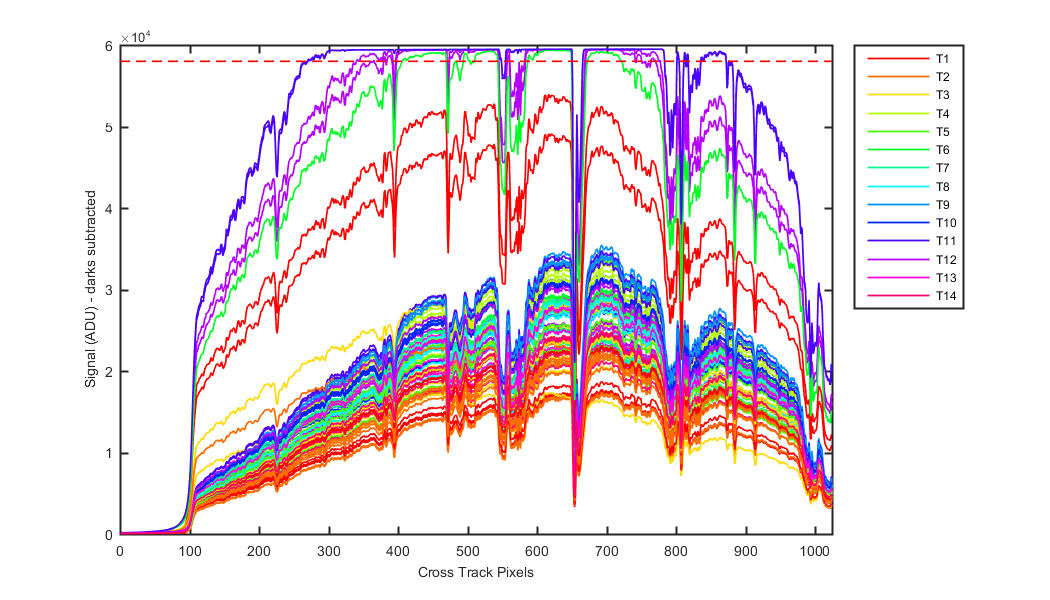
Figure 2
Figure 3
| Track | Left of Track | Right of Track |
|---|---|---|
| 1 | 2.4 | 3.9 |
| 2 | 3.2 | 4.2 |
| 3 | 3.1 | 3.4 |
| 4 | 3.9 | 3.7 |
| 5 | 3.4 | 3.9 |
| 6 | 3.4 | 3.8 |
| 7 | 3.3 | 3.9 |
| 8 | 3.1 | 3.8 |
| 9 | 3.9 | 3.1 |
| 10 | 3.7 | 3.3 |
| 11 | 4.2 | 2.9 |
| 12 | 4.2 | 2.9 |
| 13 | 4.2 | 3.0 |
| 14 | 4.2 | 3.2 |
Figure 4
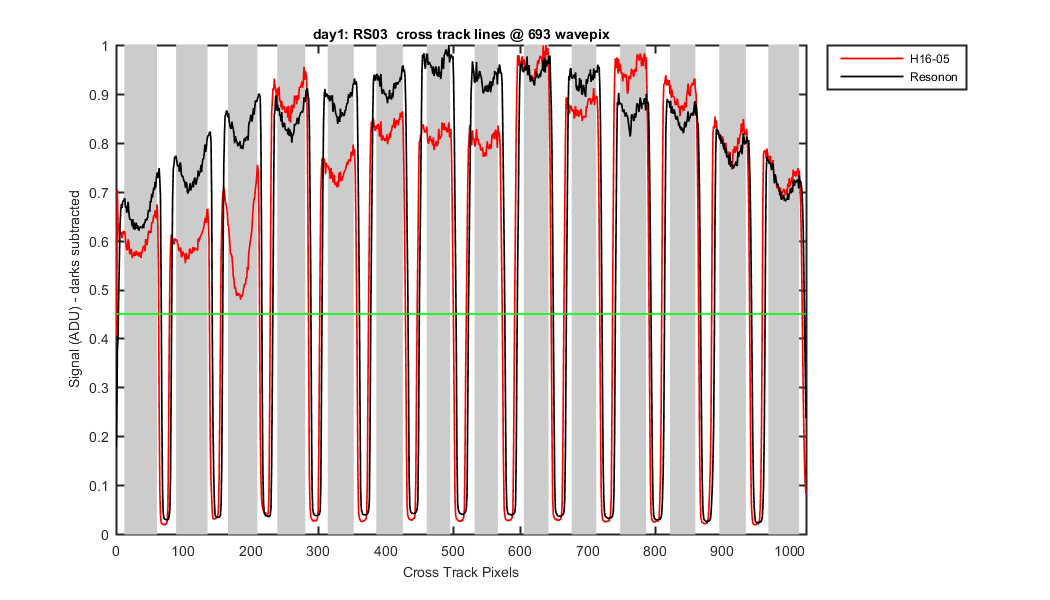
Figure 5
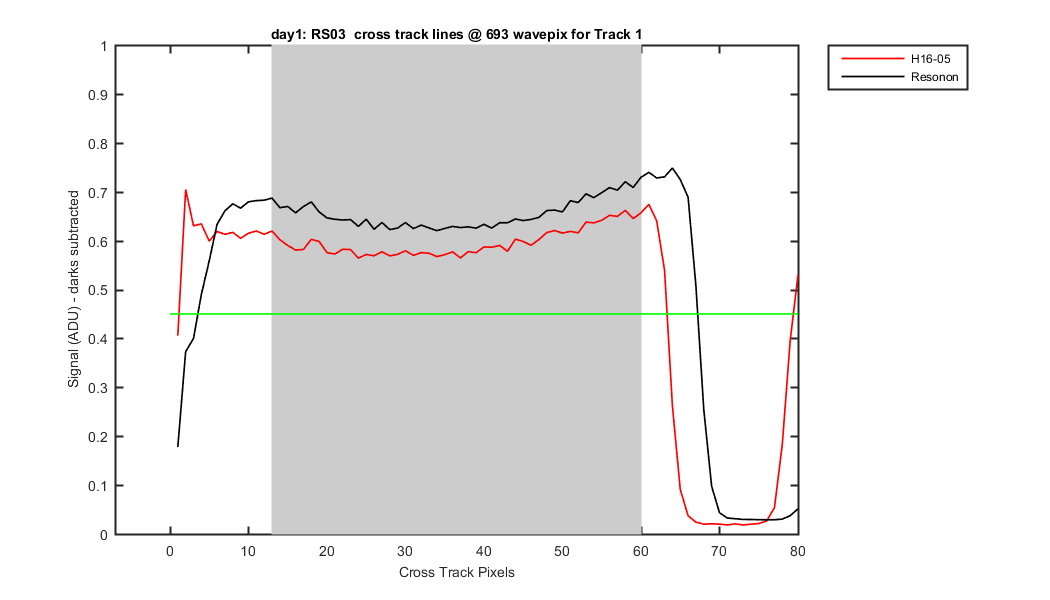
Figure 6
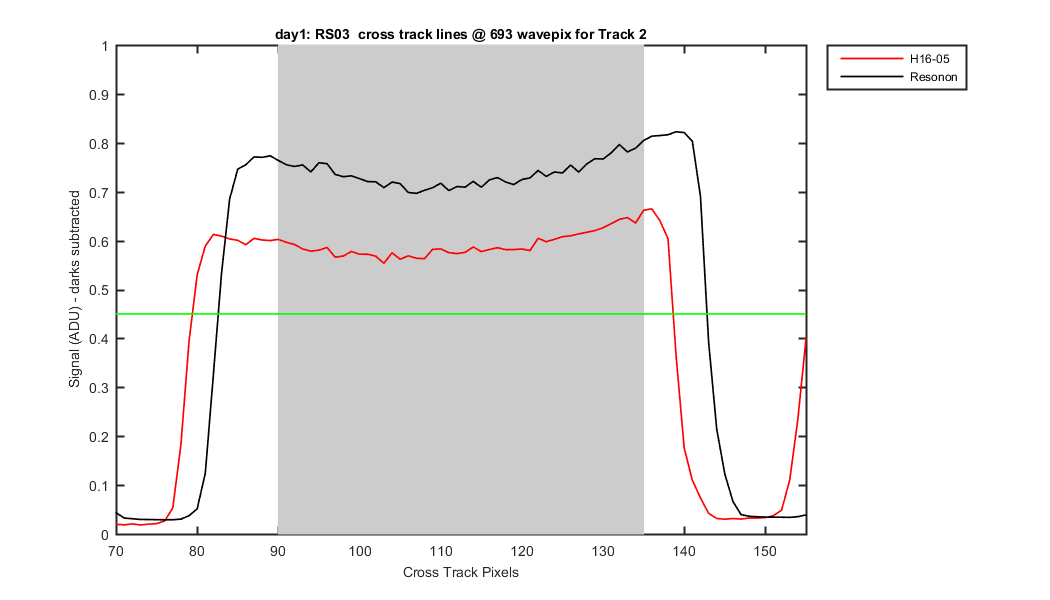
Figure 7
Figure 8
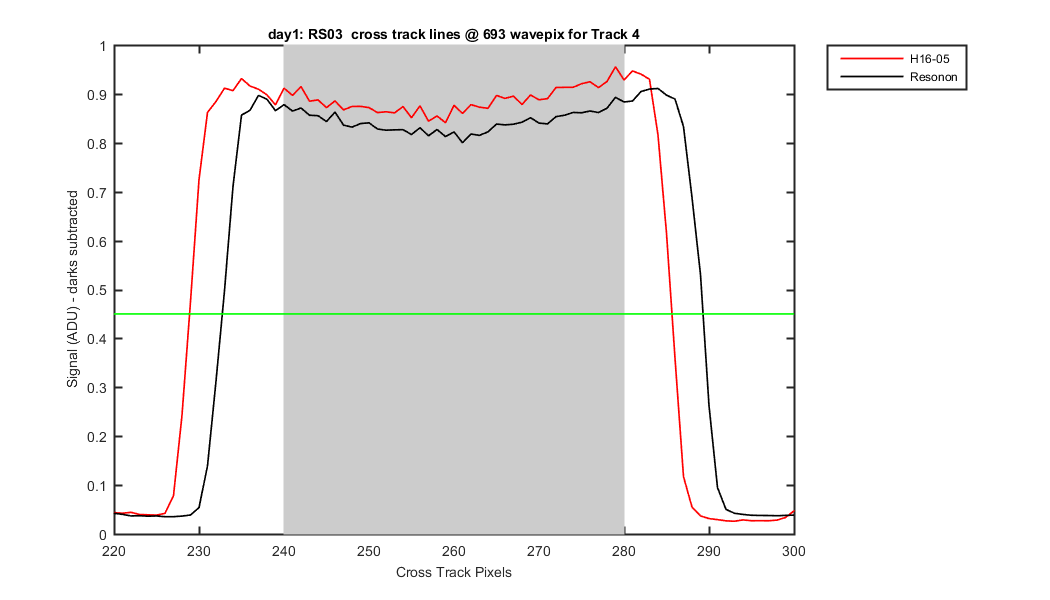
Figure 9
Figure 10
Figure 11
Figure 12
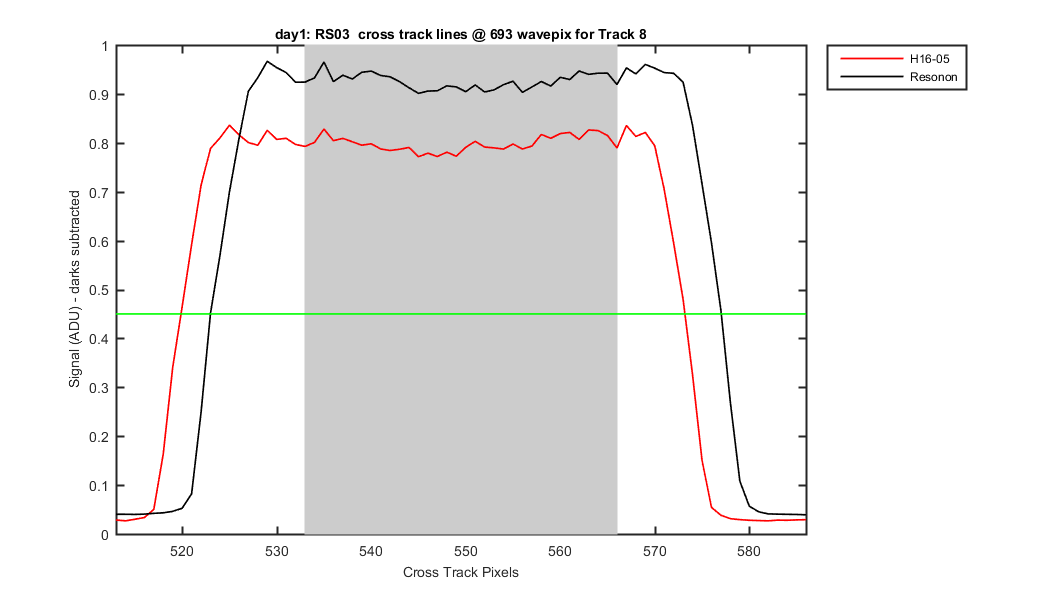
Figure 13
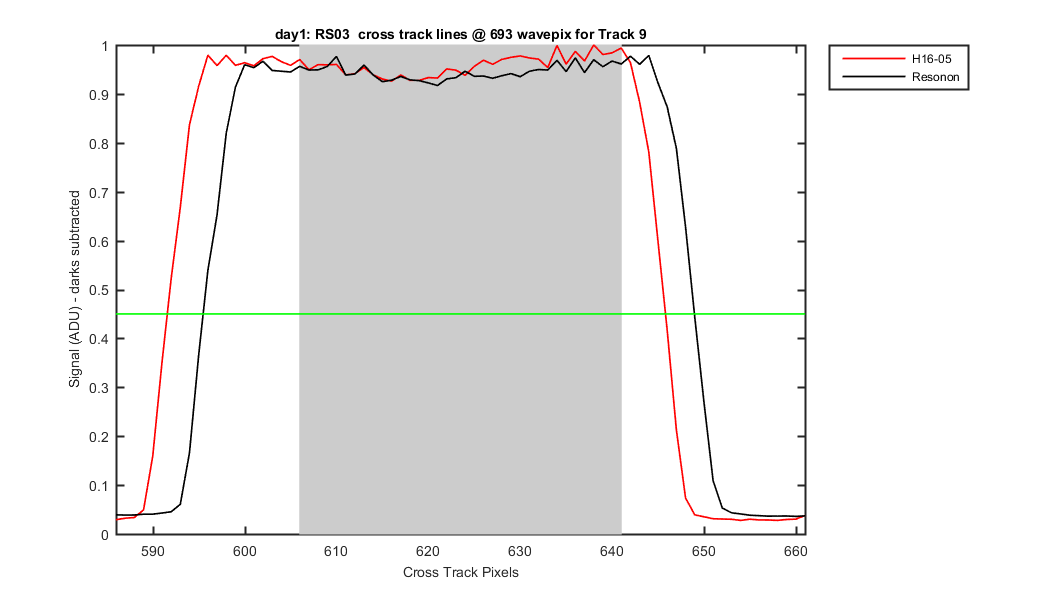
Figure 14
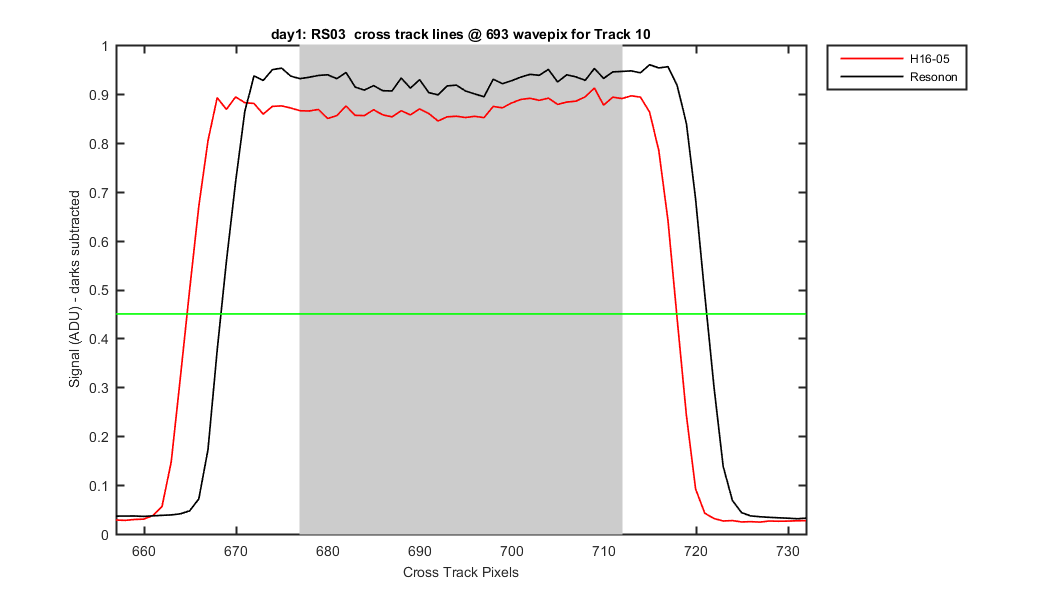
Figure 15
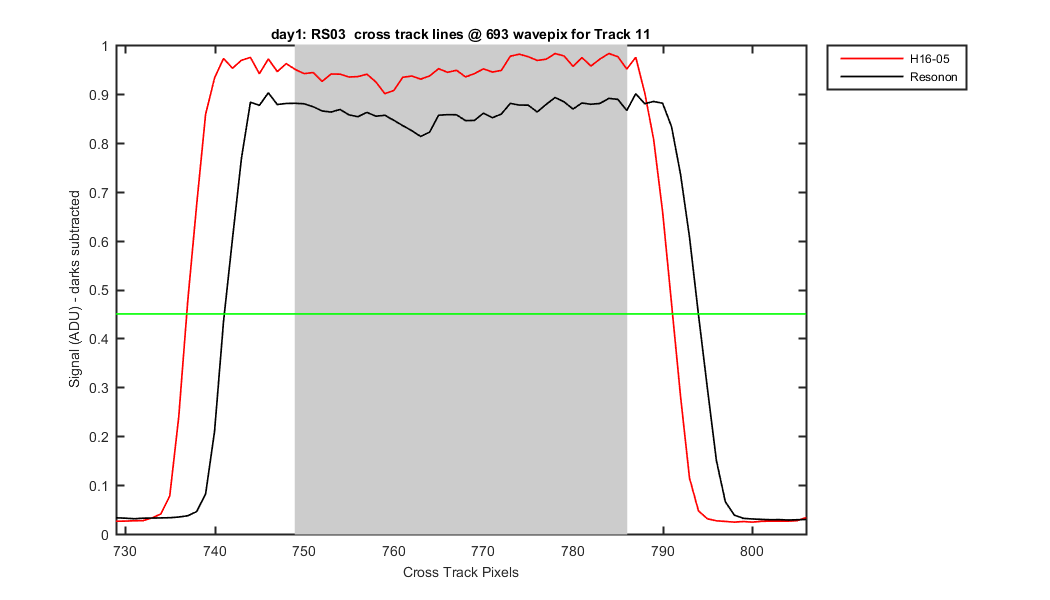
Figure 16
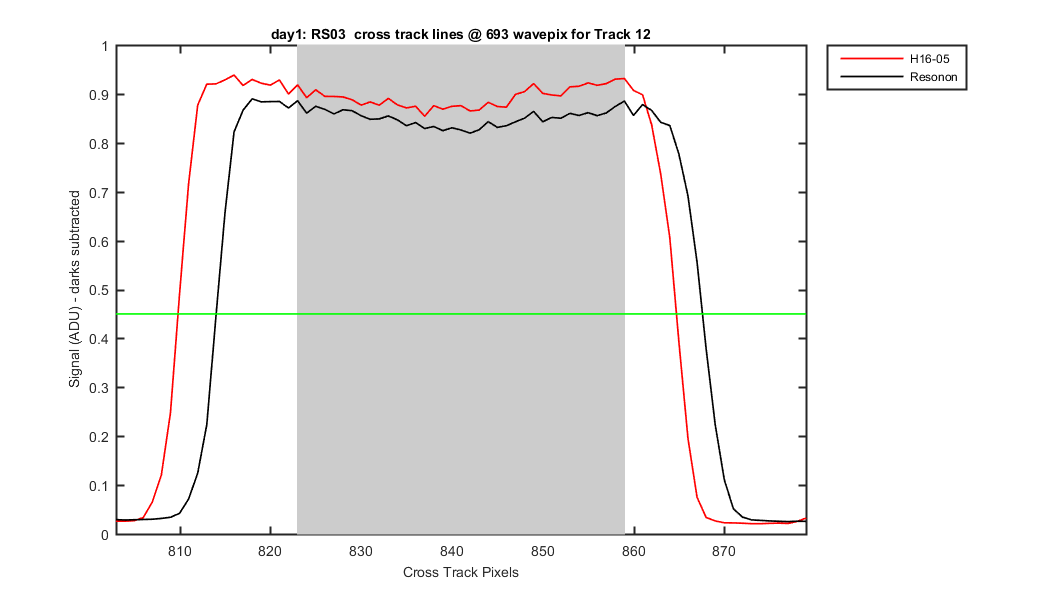
Figure 17
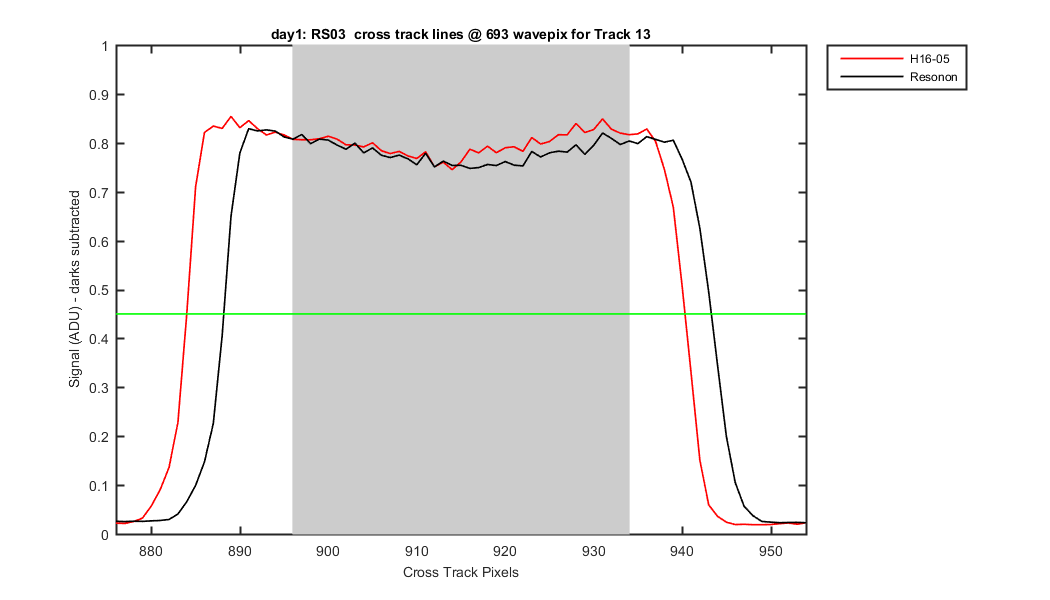
Figure 18