REVISION DATE: 12-Sep-2016 11:58:13
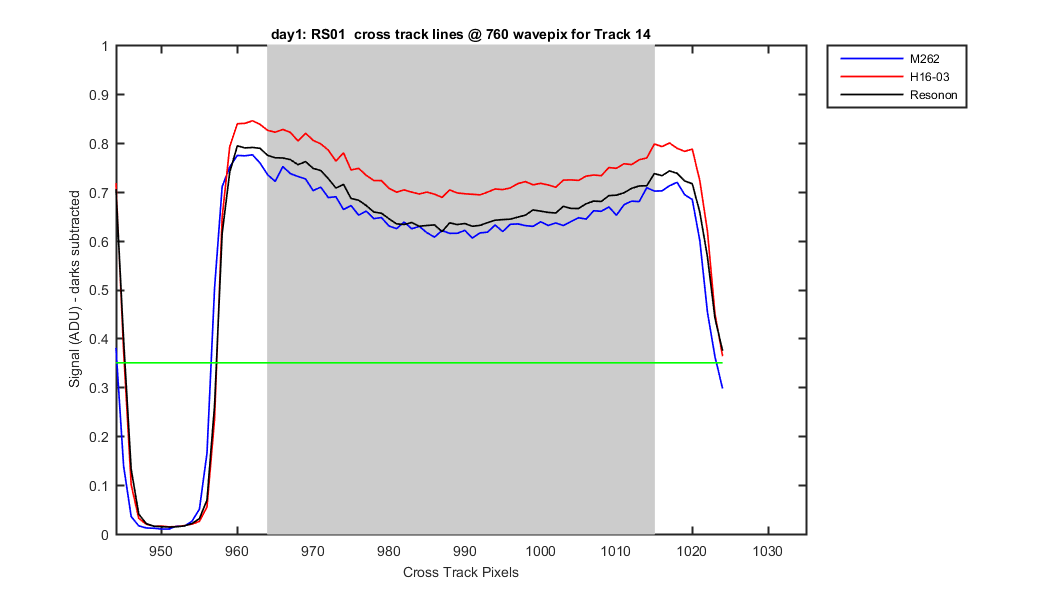
Art just sent some RSG01 data with it connected to the MOBY power system. The plots below show the changes in track edges from the last Resonon data set (1 Apr 2016) before shippment to Hawaii, then the Hawaii-2016-03 data (13-15 April 2016) and the MOBY262 data set collected (8 Sep). So the Resonon -> Hawaii-2016-03 included a shipment and the Hawaii-2016-03 --> MOBY262 changes are that the MOBY262 data are collected using the MOBY power system. For BS02 on MOBY261 connecting to the MOBY power system and controller caused some odd behaviour in the BS02. Using the same aq. software the RS01 works just fine. So the question is what is causing the problems with BS01, since everything is the same. Maybe it is the camera????
| Track | Left of Track | Right of Track |
|---|---|---|
| 1 | -0.4 | 1.1 |
| 2 | 0.3 | 0.5 |
| 3 | 0.5 | 0.4 |
| 4 | 0.3 | 0.5 |
| 5 | 0.5 | 0.5 |
| 6 | 0.5 | 0.4 |
| 7 | 0.3 | 0.7 |
| 8 | 0.6 | 0.6 |
| 9 | 0.5 | 0.7 |
| 10 | 0.3 | 1.1 |
| 11 | 0.4 | 1.0 |
| 12 | 0.3 | 1.2 |
| 13 | 0.4 | 1.0 |
| 14 | 0.7 | 0.0 |
| Track | Left of Track | Right of Track |
|---|---|---|
| 1 | 0.0 | 0.4 |
| 2 | 0.3 | 0.4 |
| 3 | 0.4 | 0.3 |
| 4 | 0.2 | 0.3 |
| 5 | 0.2 | 0.1 |
| 6 | 0.0 | 0.2 |
| 7 | 0.0 | 0.2 |
| 8 | -0.1 | 0.2 |
| 9 | 0.0 | 0.1 |
| 10 | -0.1 | 0.2 |
| 11 | -0.0 | 0.1 |
| 12 | -0.1 | 0.1 |
| 13 | -0.1 | 0.1 |
| 14 | -0.0 | 0.0 |
Figure 1
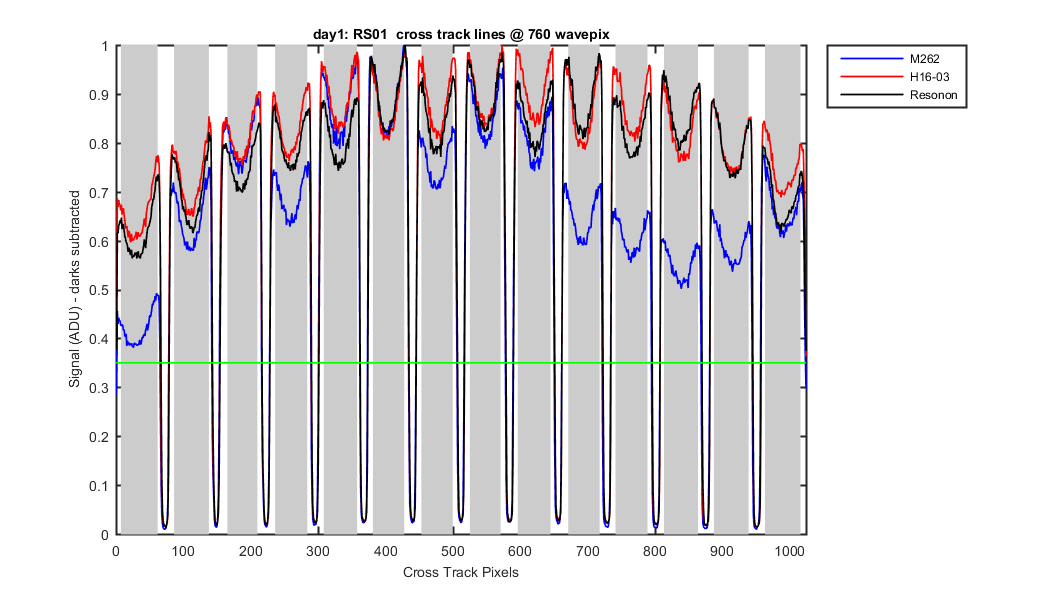
Figure 2
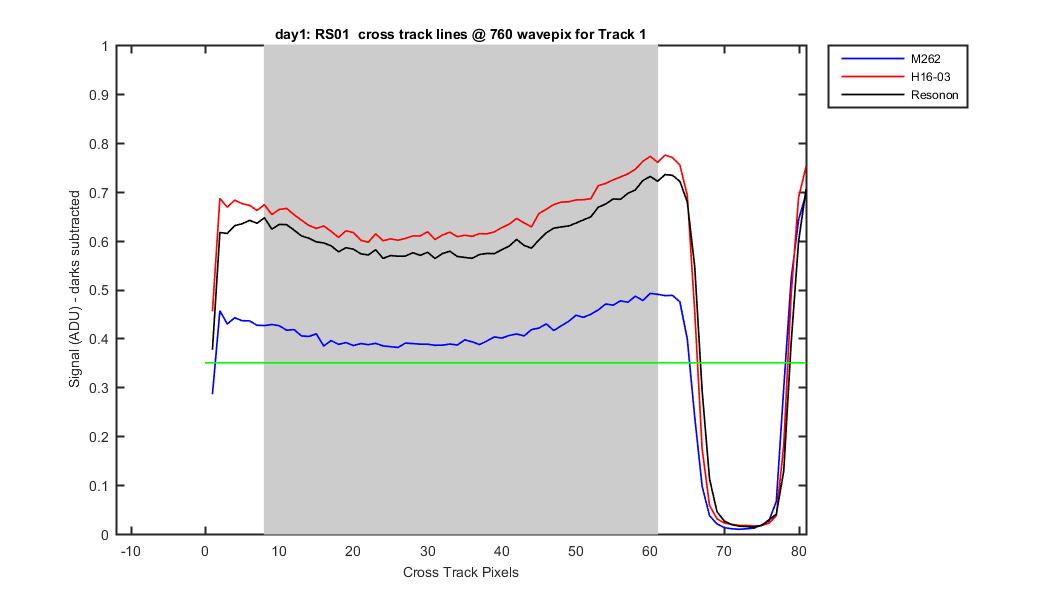
Figure 3
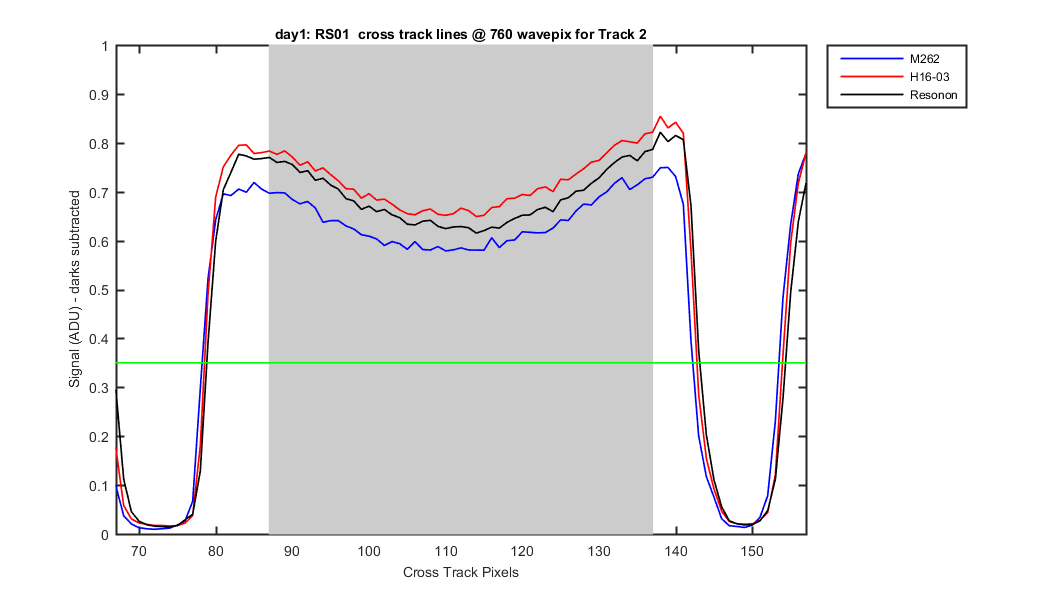
Figure 4
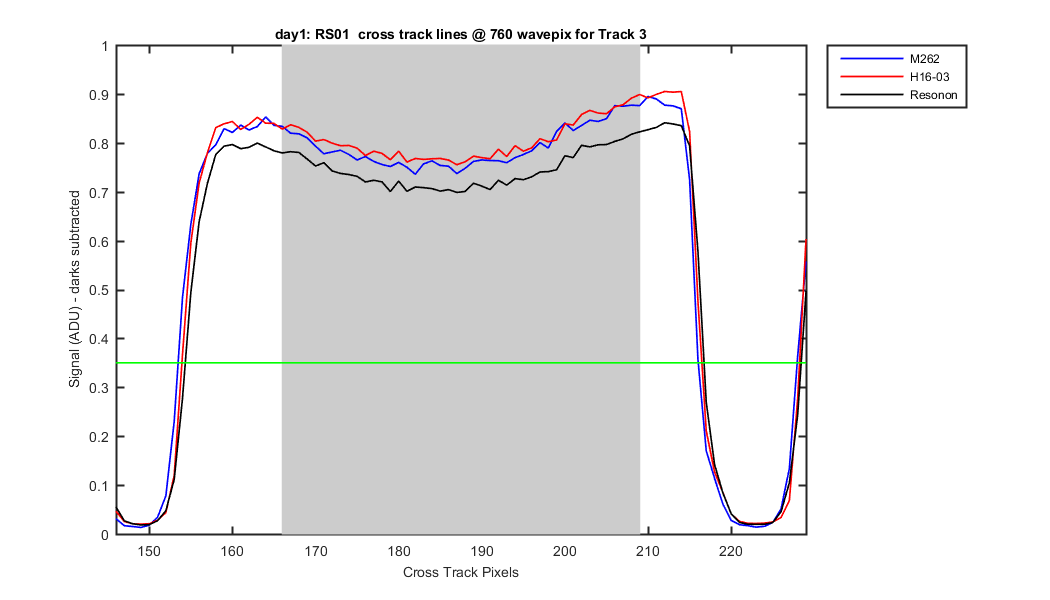
Figure 5
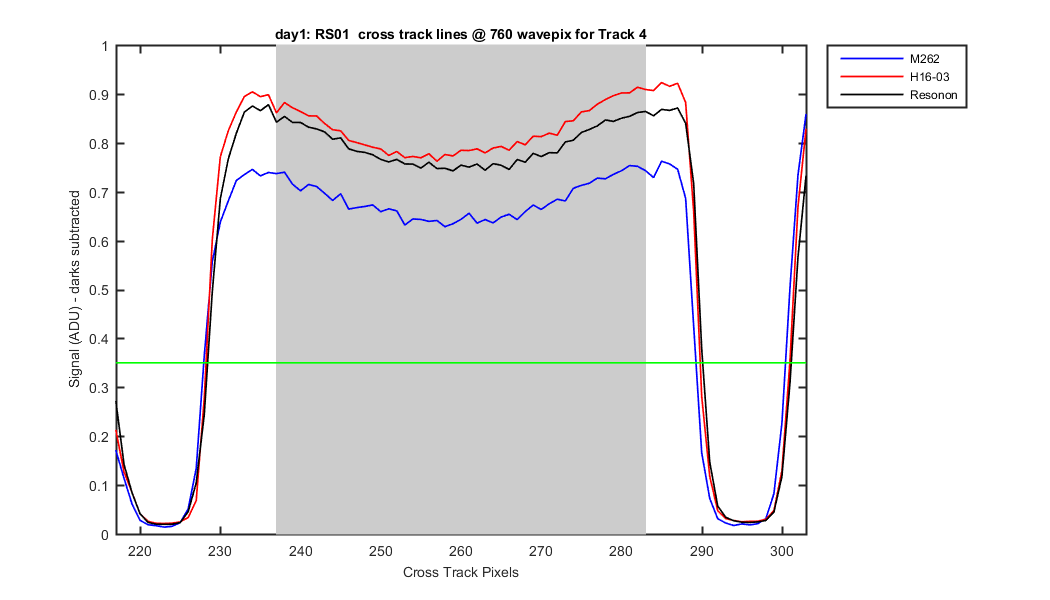
Figure 6
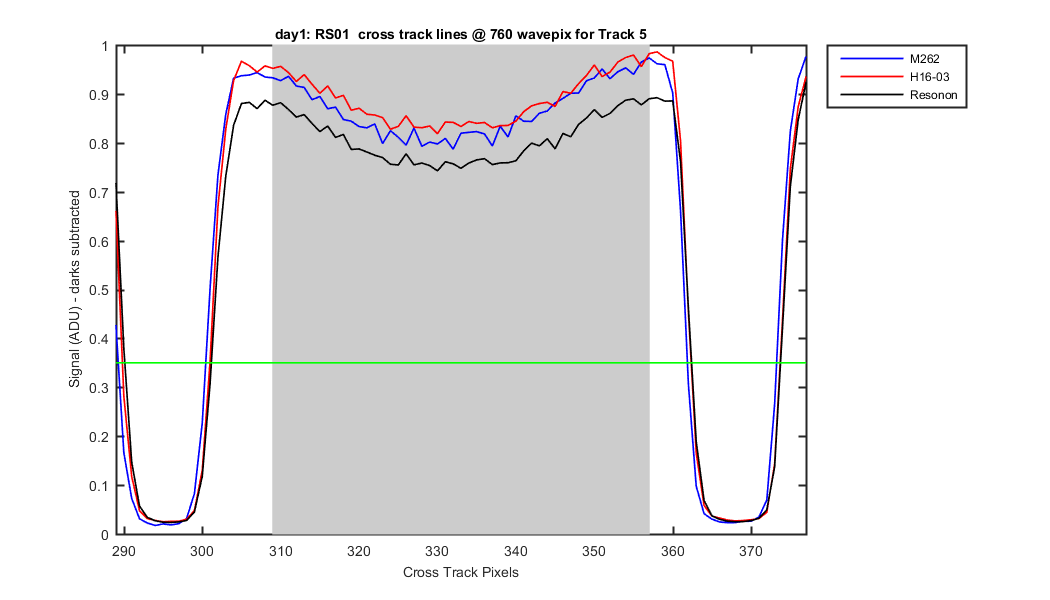
Figure 7
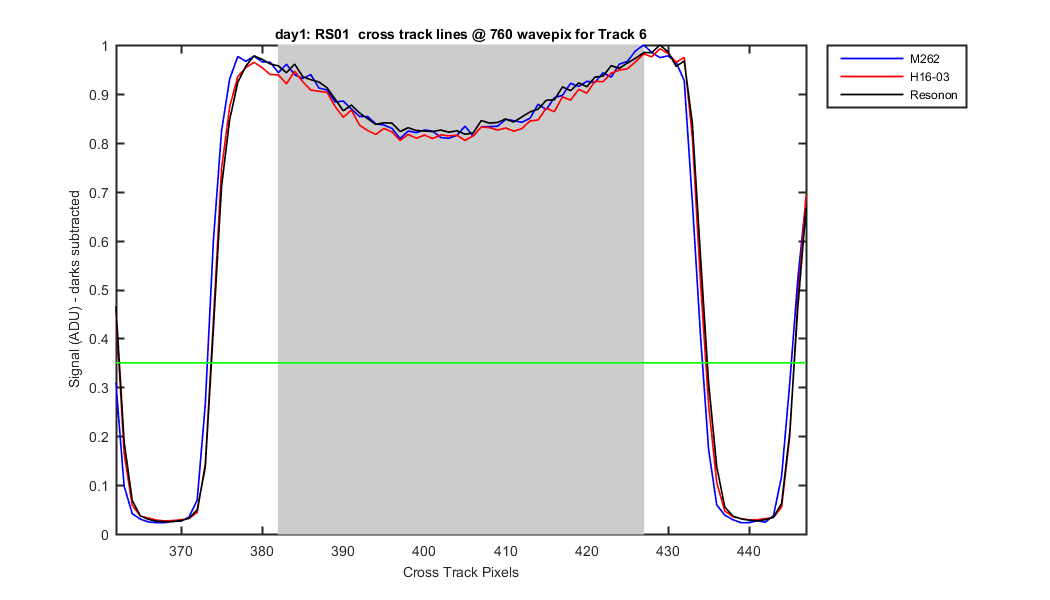
Figure 8
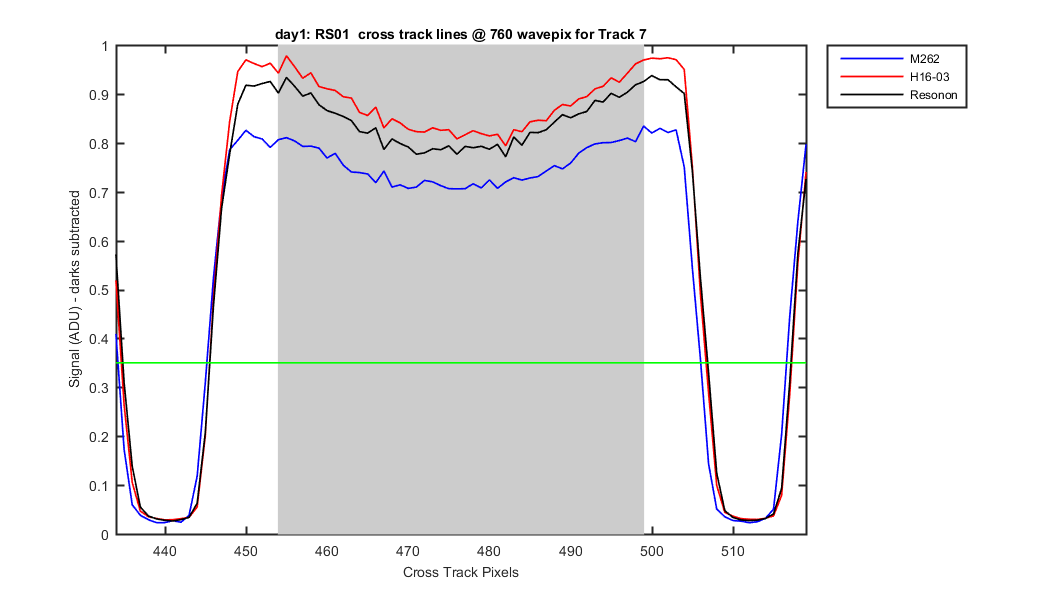
Figure 9
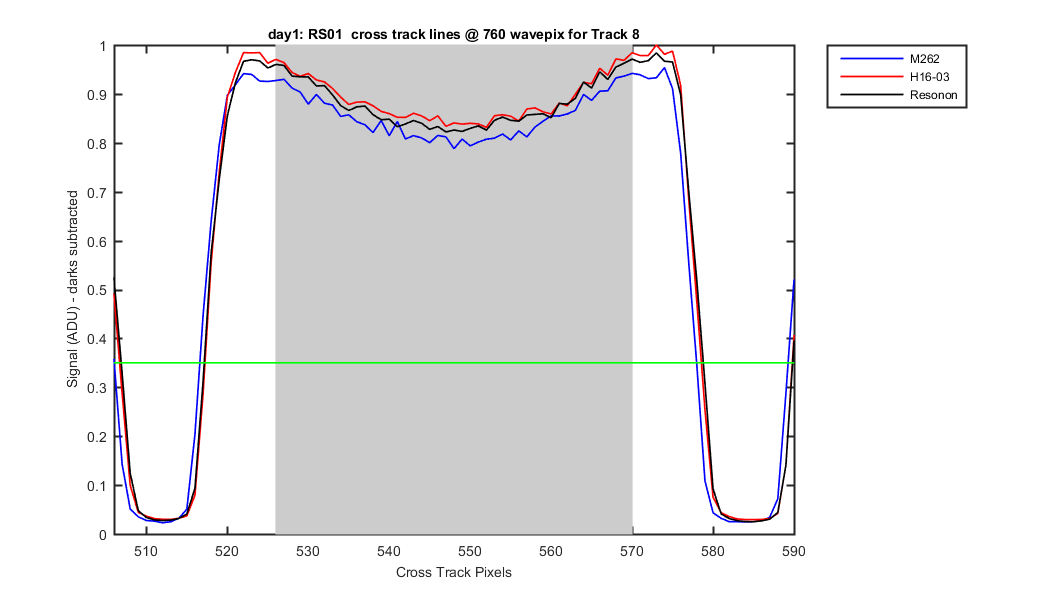
Figure 10
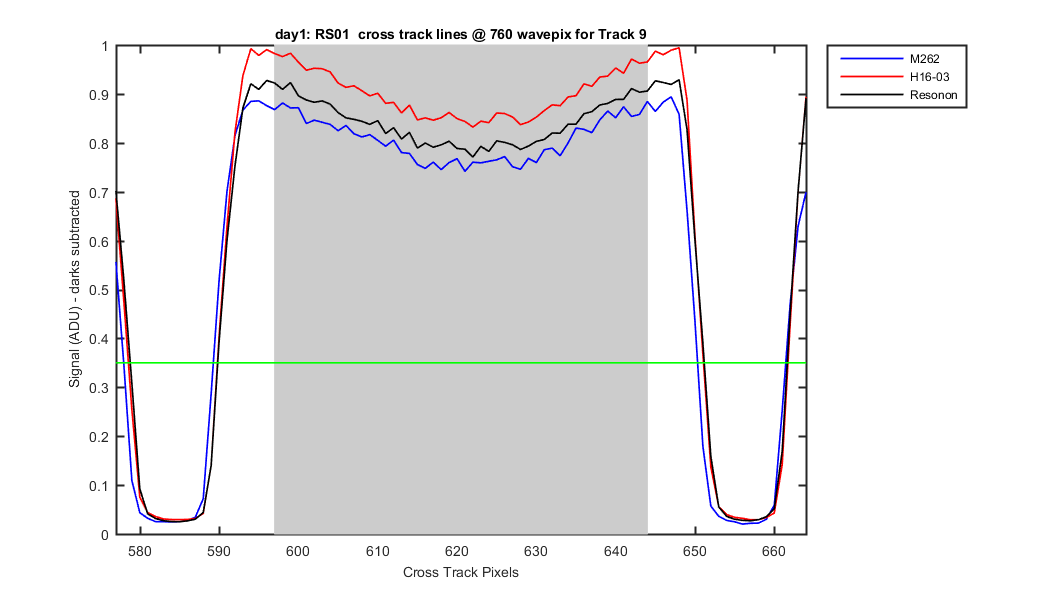
Figure 11
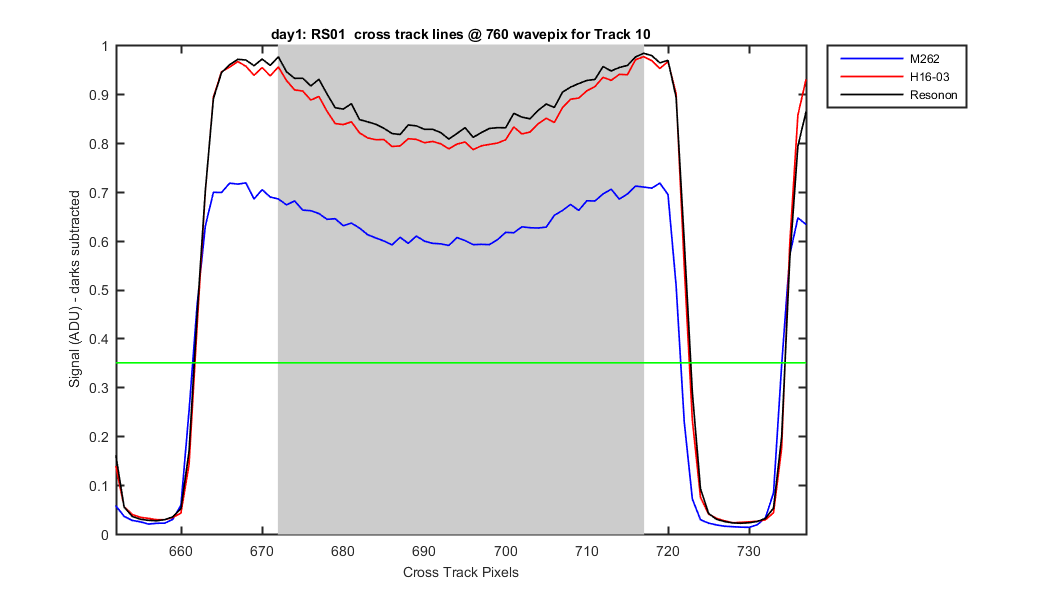
Figure 12
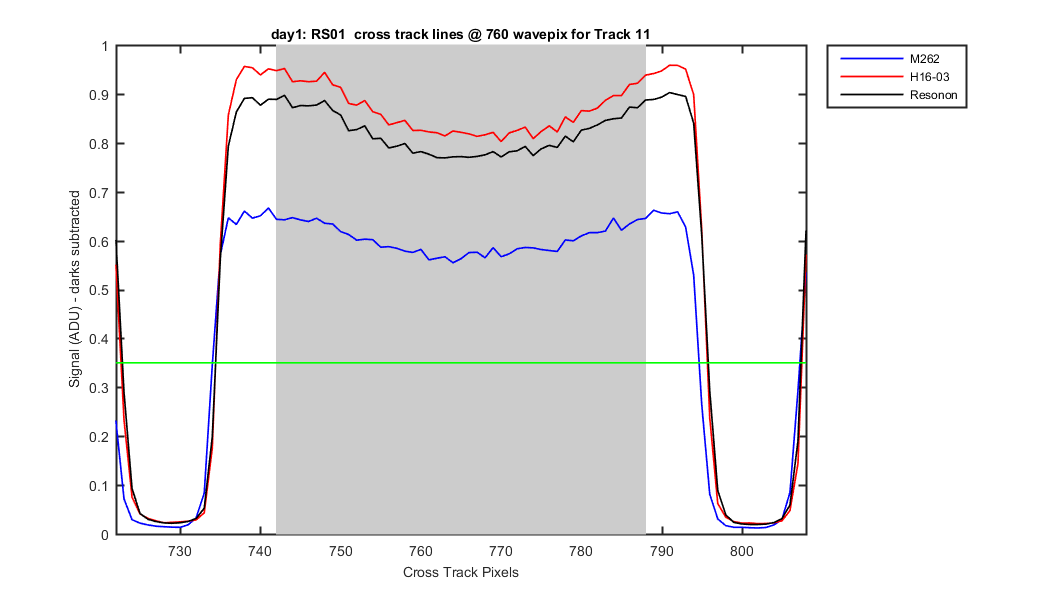
Figure 13
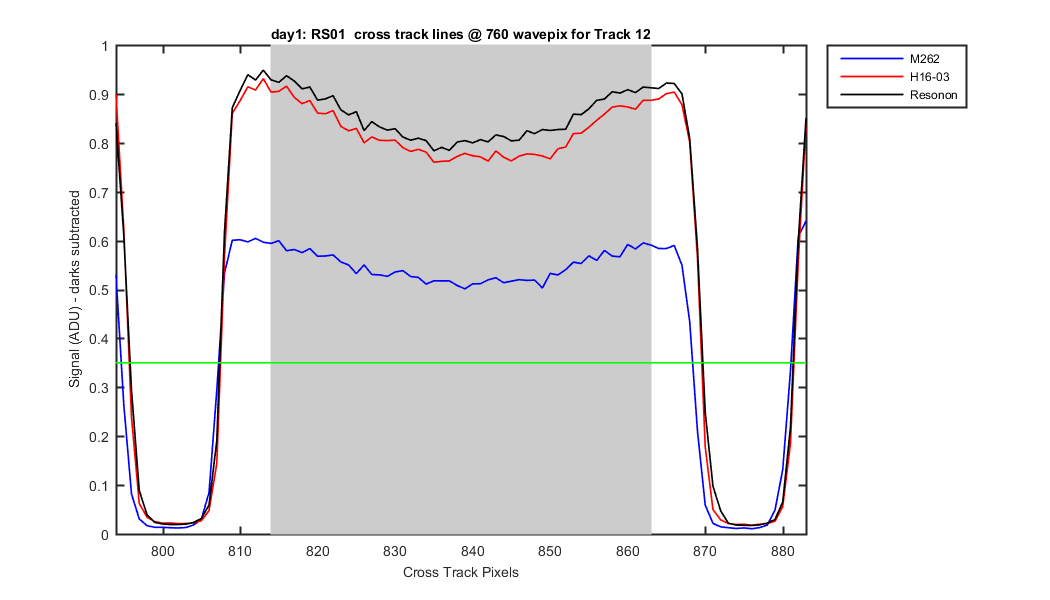
Figure 14
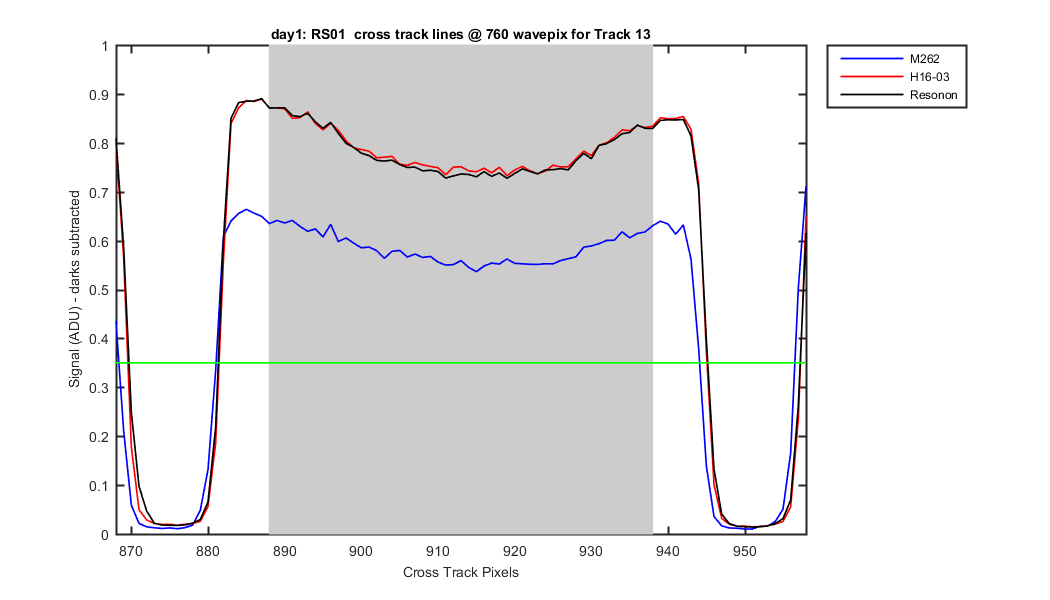
Figure 15