REVISION DATE: 13-Sep-2016 21:17:09
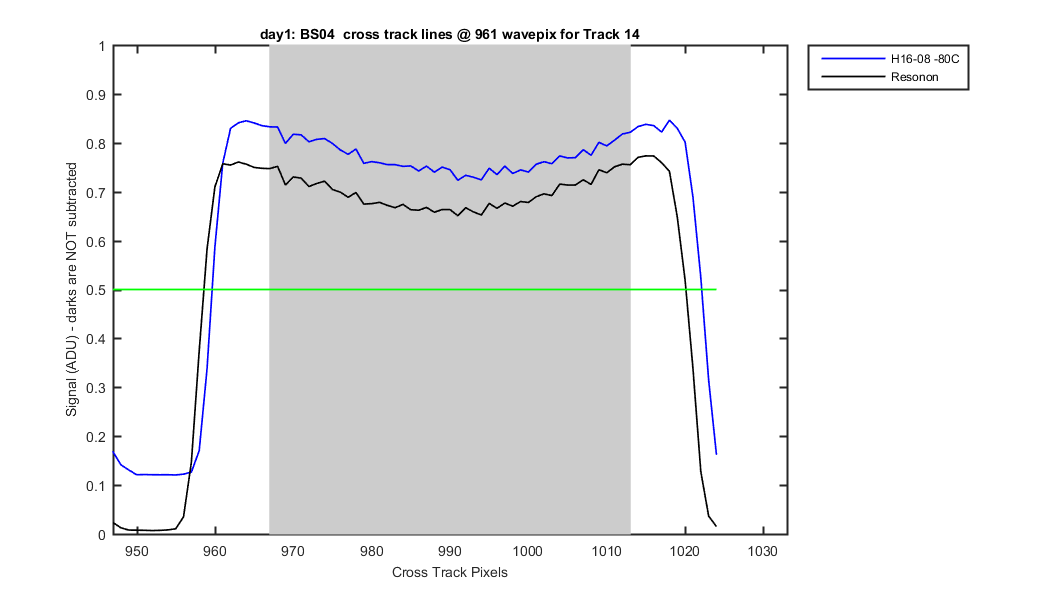
Mike took the first set of BS04 data since the BS04 was shipped from Resonon. The graphs below compare the Resonon Lamps data to the Lamp data Mike took in Hawaii to see how much the tracks moved. For the Hawaii data set I used file 12 which was at -80C
| Track | Left of Track | Right of Track |
|---|---|---|
| 1 | -0.0 | -1.6 |
| 2 | -0.2 | -1.9 |
| 3 | 0.0 | -2.1 |
| 4 | 0.4 | -2.4 |
| 5 | 0.9 | -2.6 |
| 6 | 1.3 | -3.2 |
| 7 | 1.5 | -2.8 |
| 8 | 1.2 | -2.5 |
| 9 | 0.7 | -1.9 |
| 10 | 0.5 | -2.0 |
| 11 | -0.2 | -1.7 |
| 12 | -0.6 | -1.8 |
| 13 | -0.7 | -1.9 |
| 14 | -0.4 | -2.0 |
Figure 1
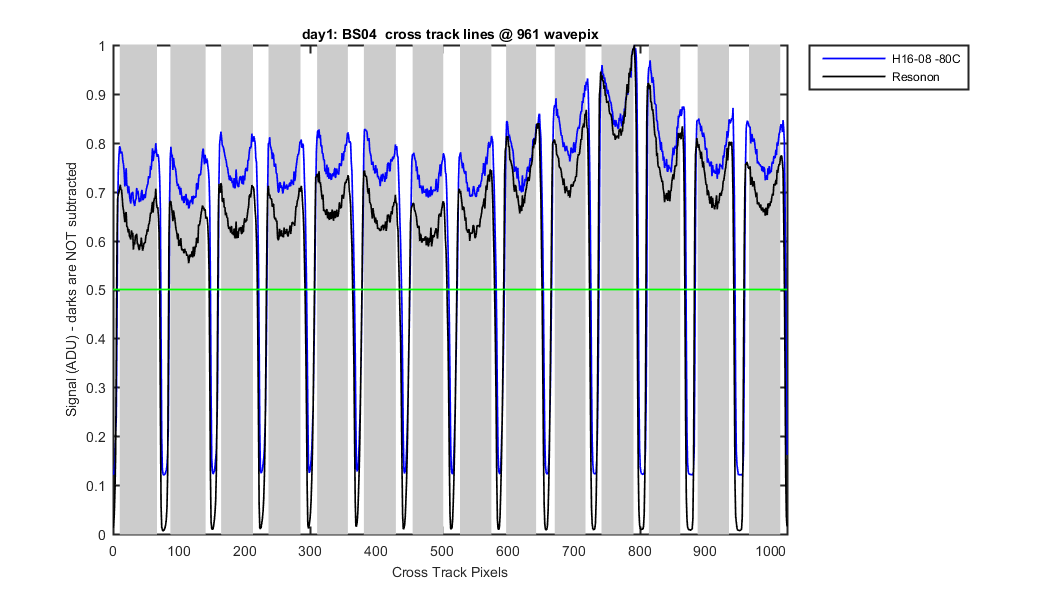
Figure 2
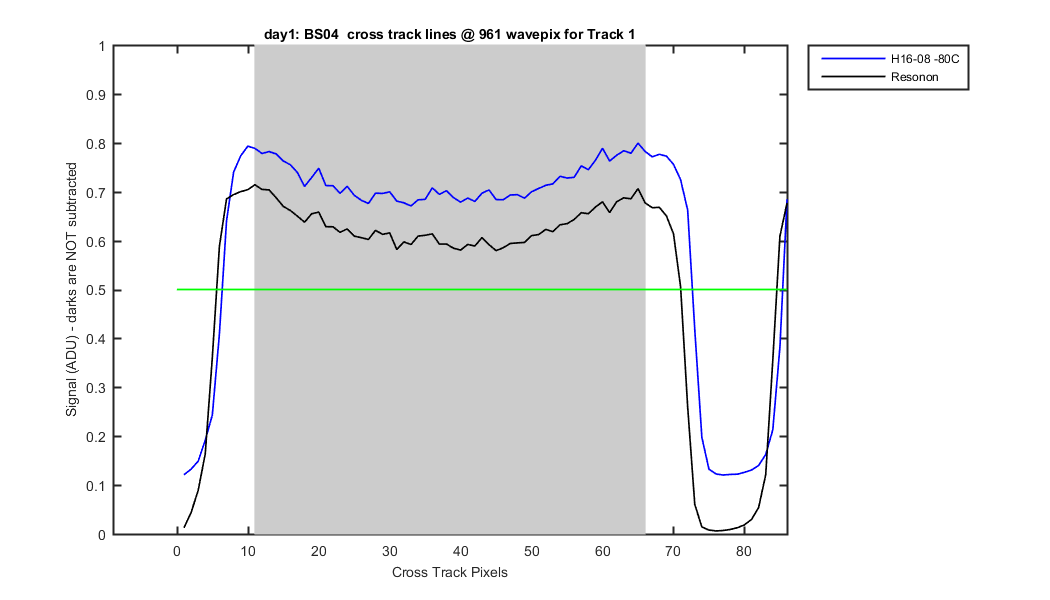
Figure 3
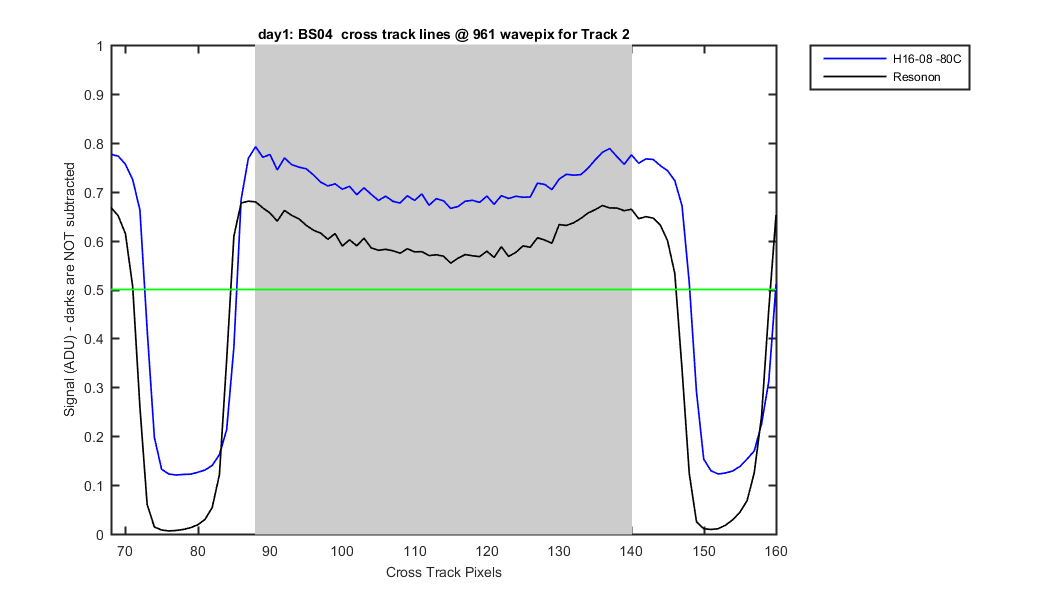
Figure 4

Figure 5
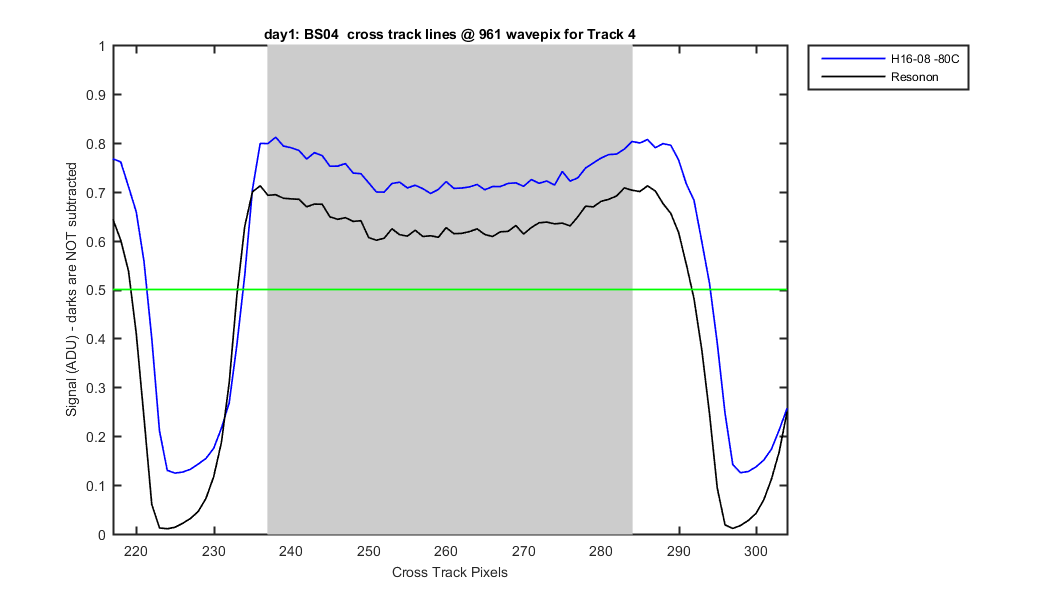
Figure 6
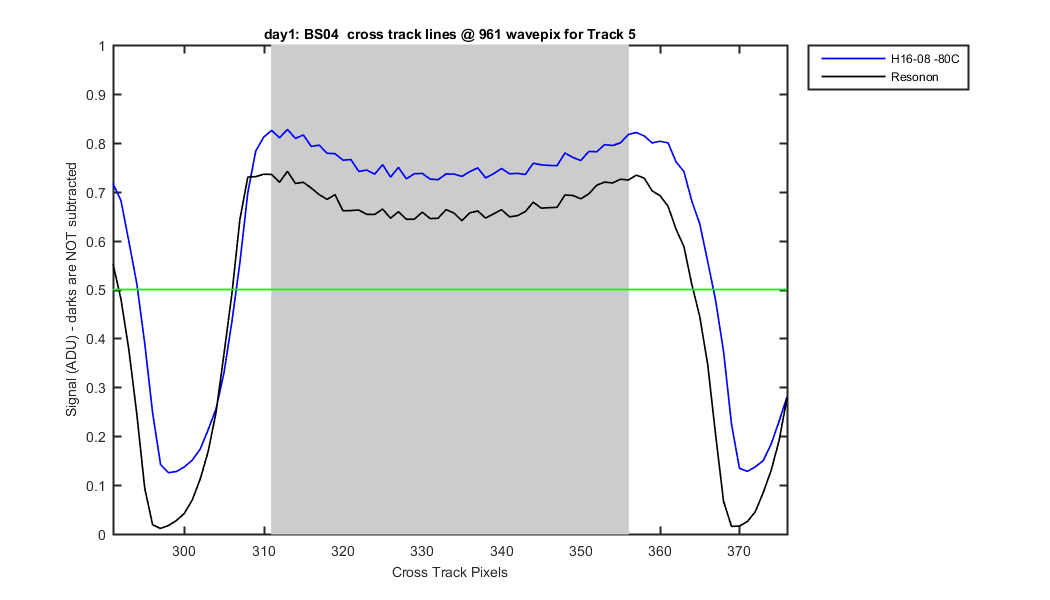
Figure 7
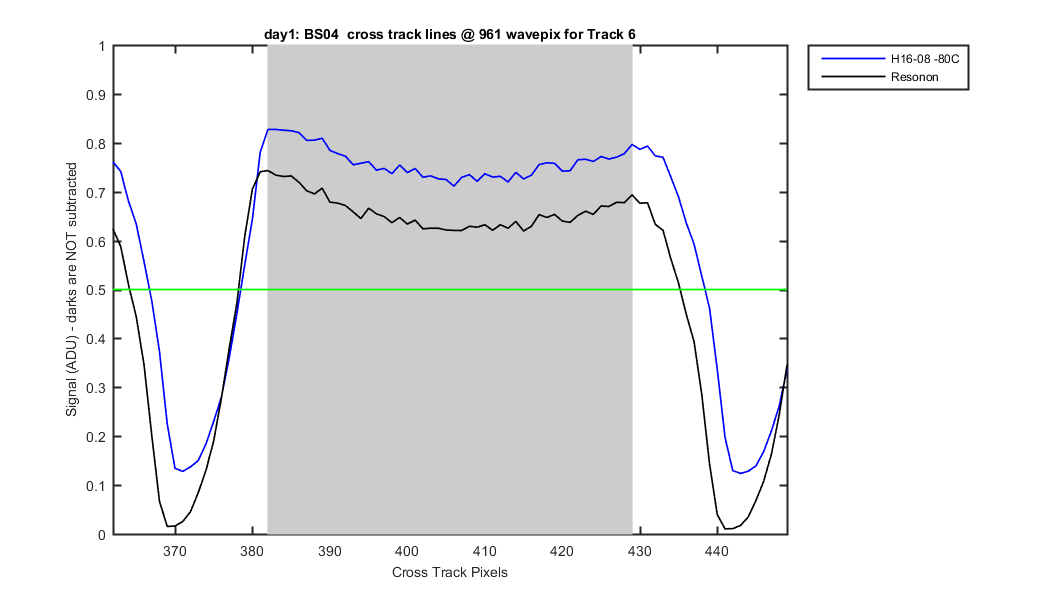
Figure 8
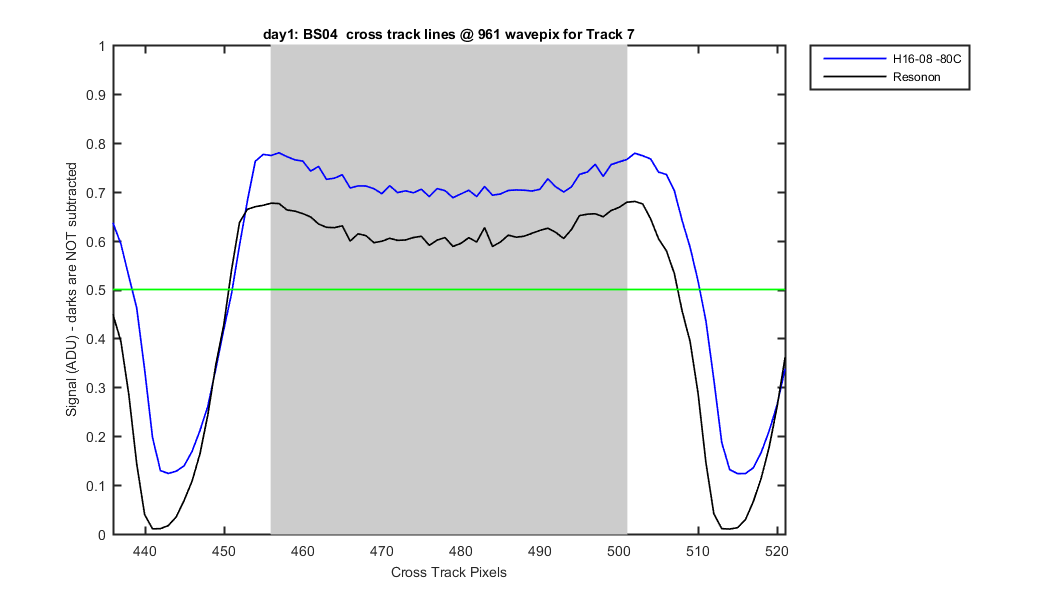
Figure 9
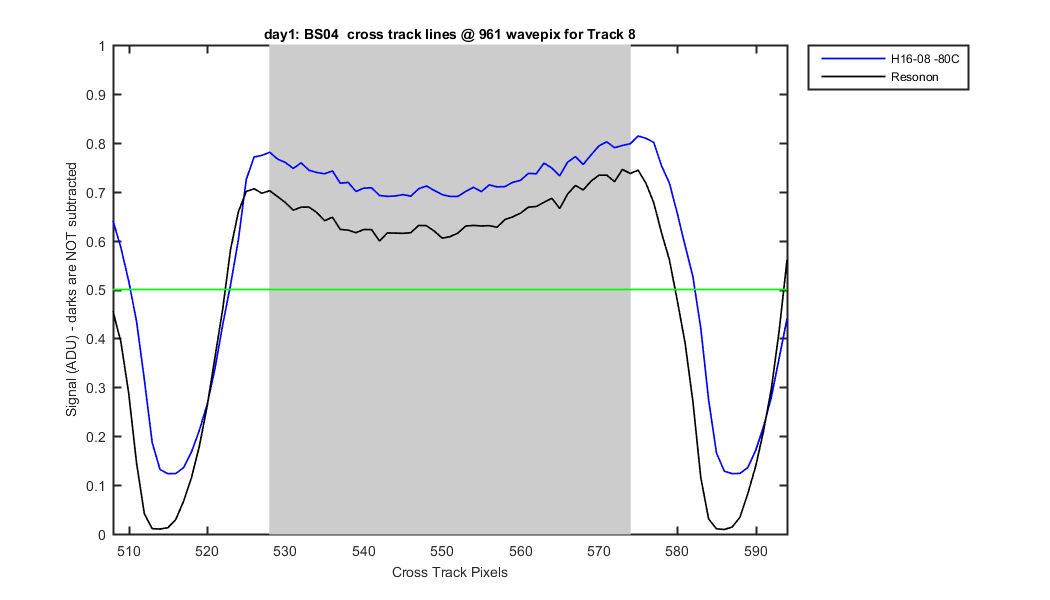
Figure 10
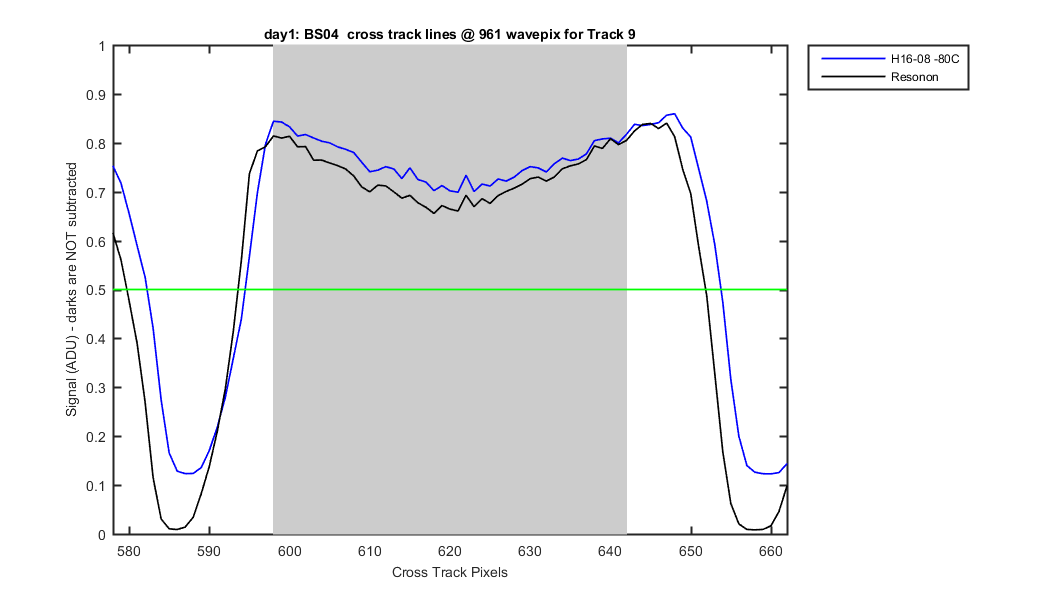
Figure 11
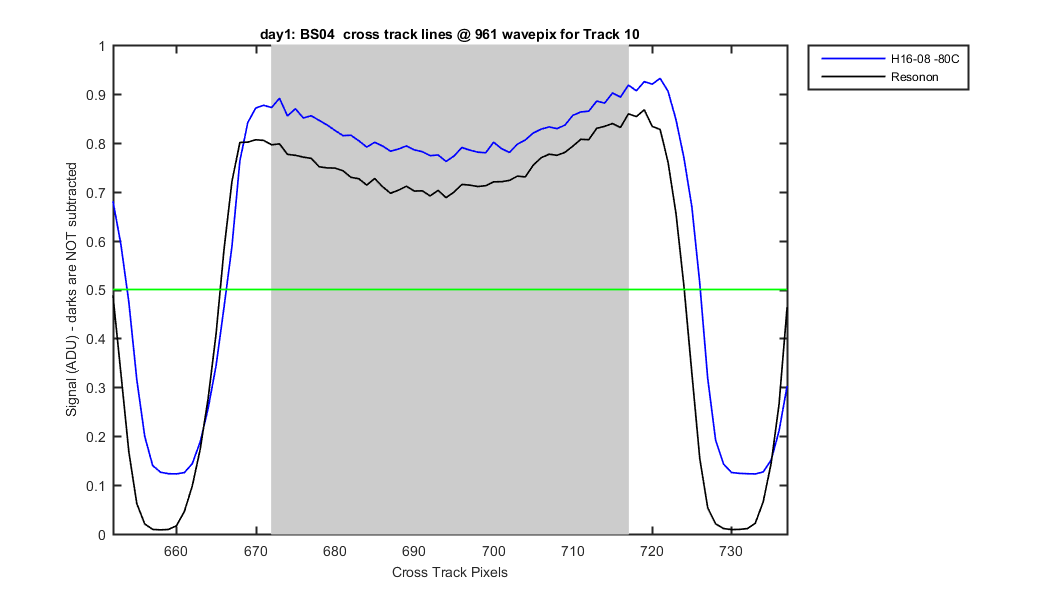
Figure 12
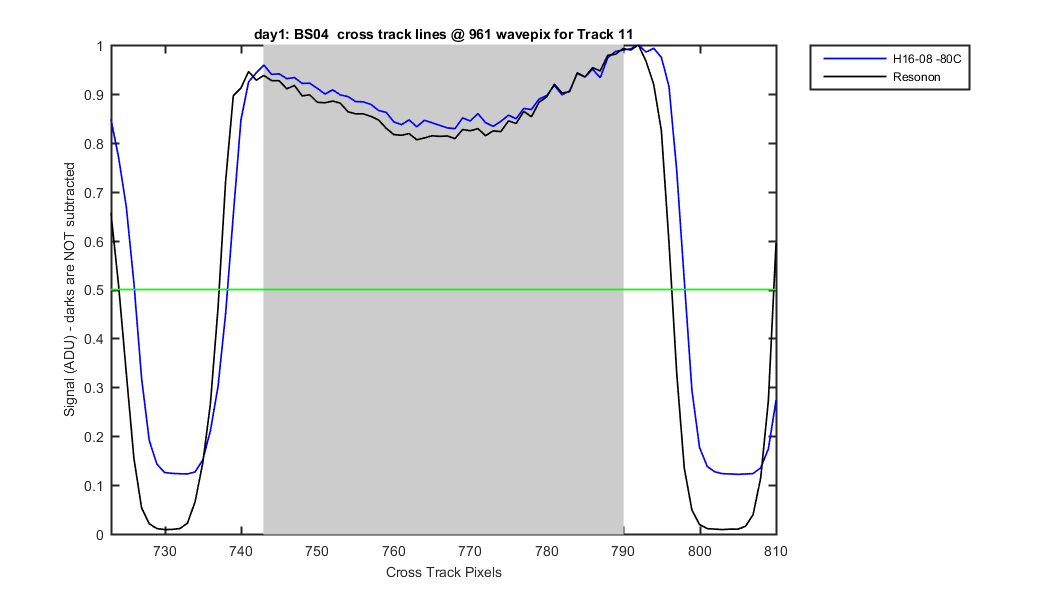
Figure 13
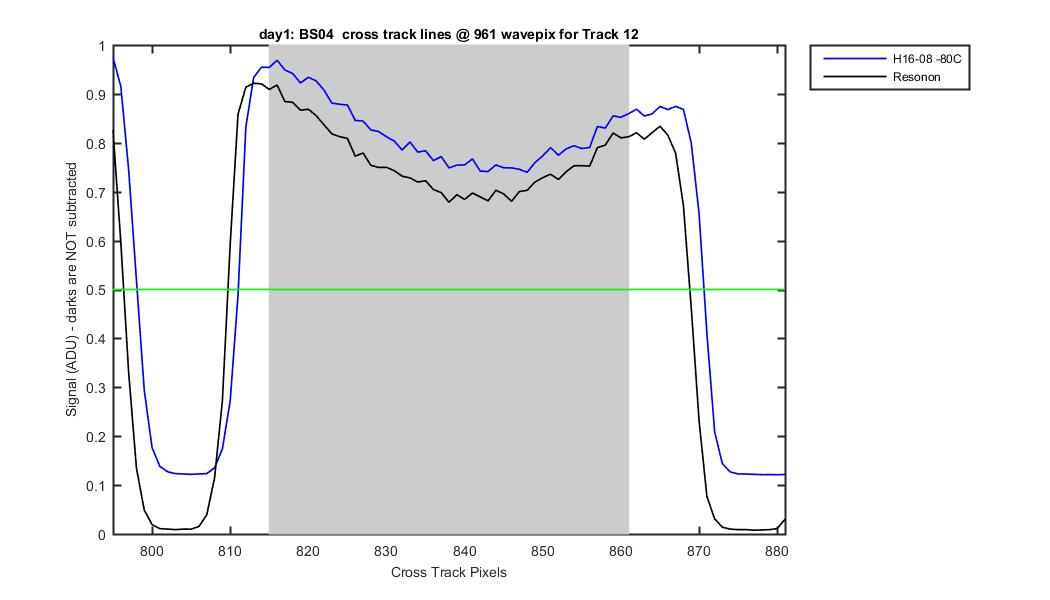
Figure 14
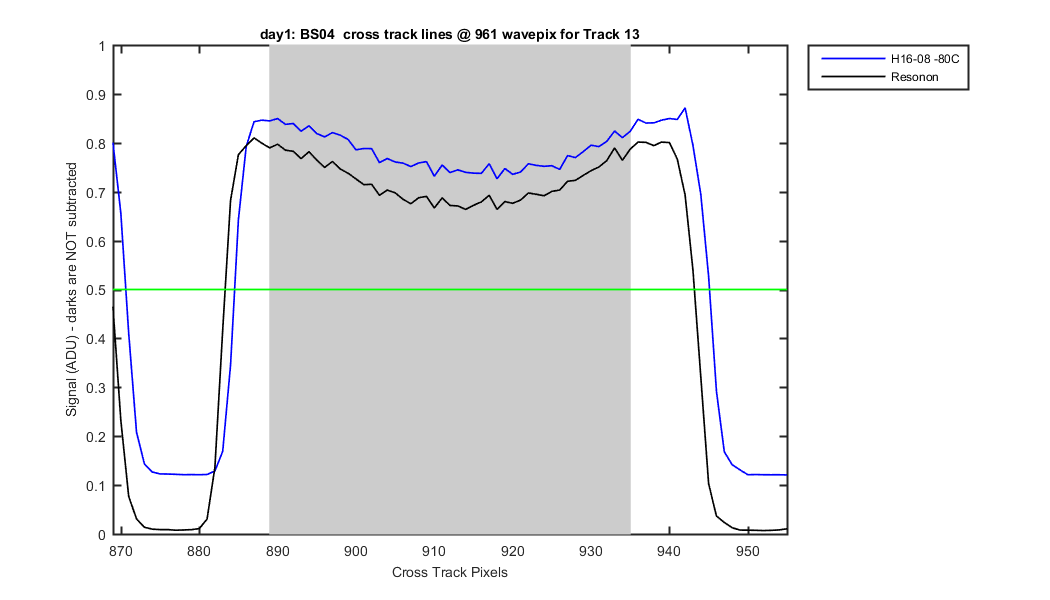
Figure 15