REVISION DATE: 14-Sep-2016 11:43:03
This shows Mike Oriel Lamp data collected using all the fibers and at 4 different temperatures.
Figure 1
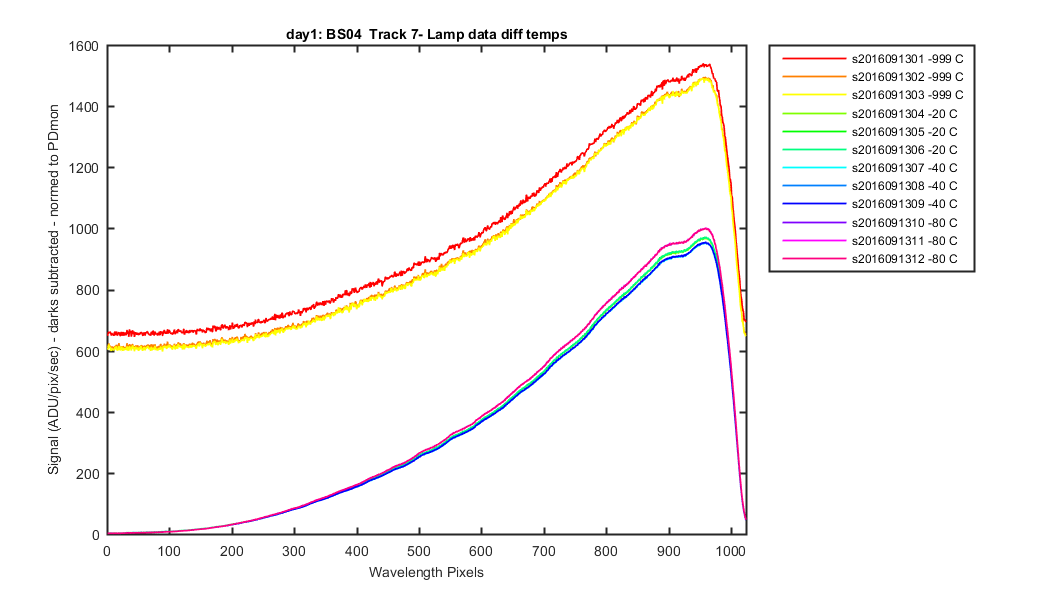
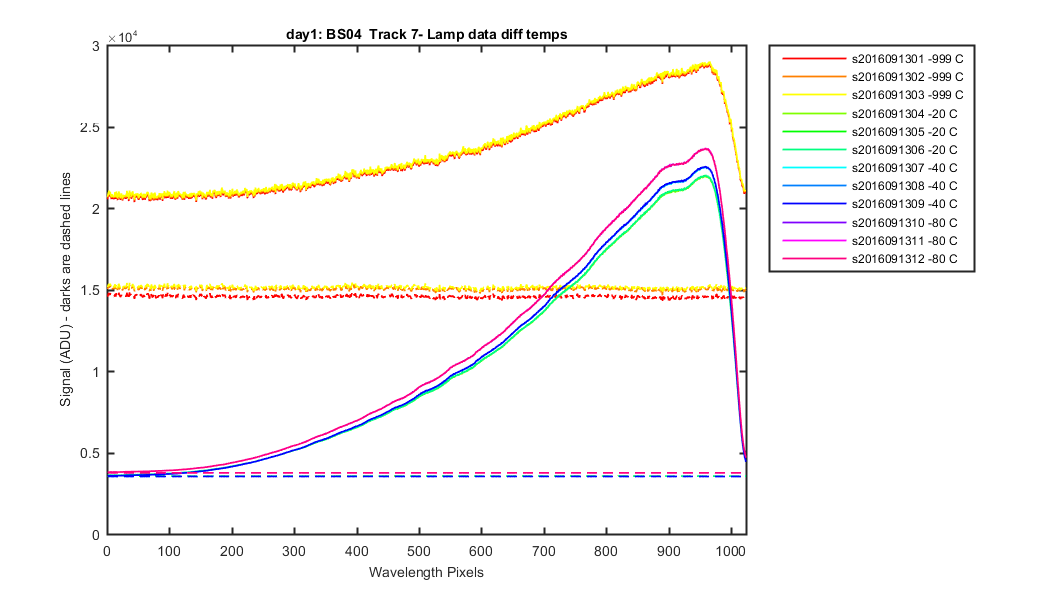
Figure 2
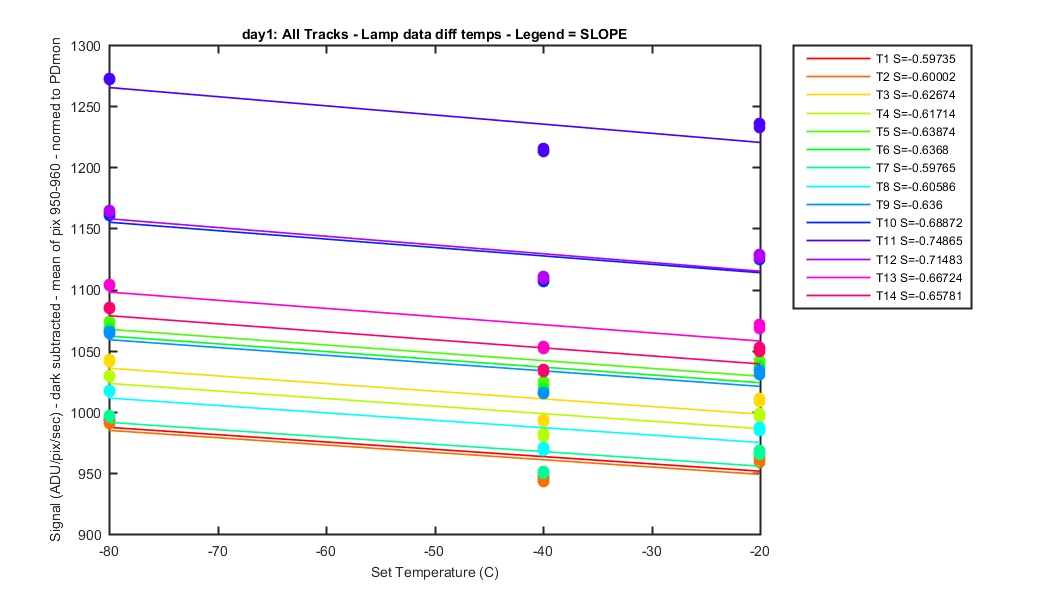
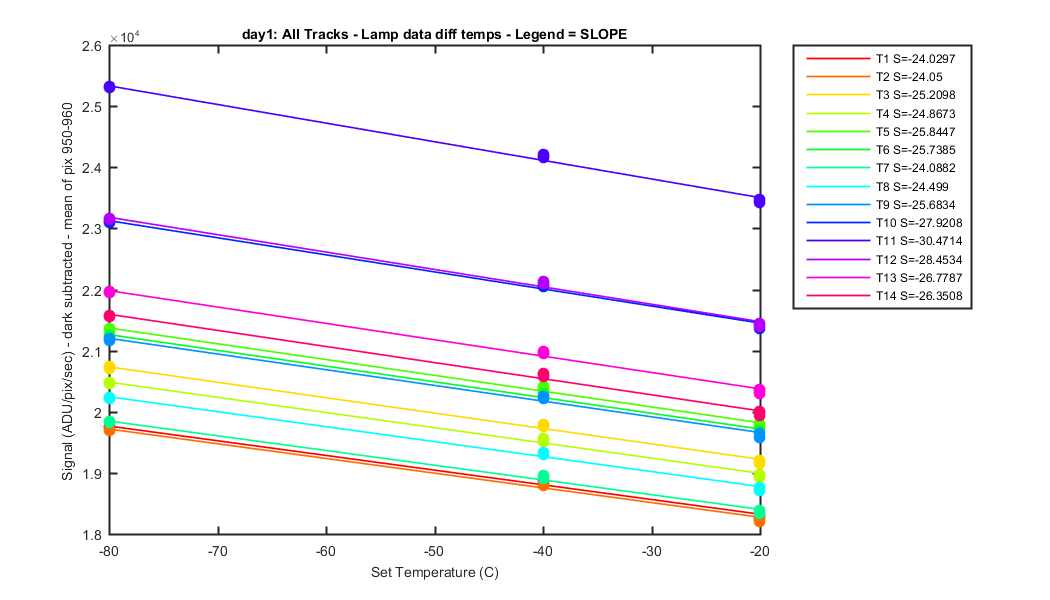
I took the mean for pixels 950-960 (near the max) for each file and track in ADU/pix/sec. I then plotted them verses set temperature. As the title says the legend contains the track number and the slope of the fit line for each track. For this data set I have NOT normalized but the Photo dioe monitor
Figure 3
I redid Figure 3 but normalizing the mean of the Signal by the PhotoDiode Monitor values this, removes A LOT of the slope.
Figure 4