REVISION DATE: 13-Sep-2016 21:13:54
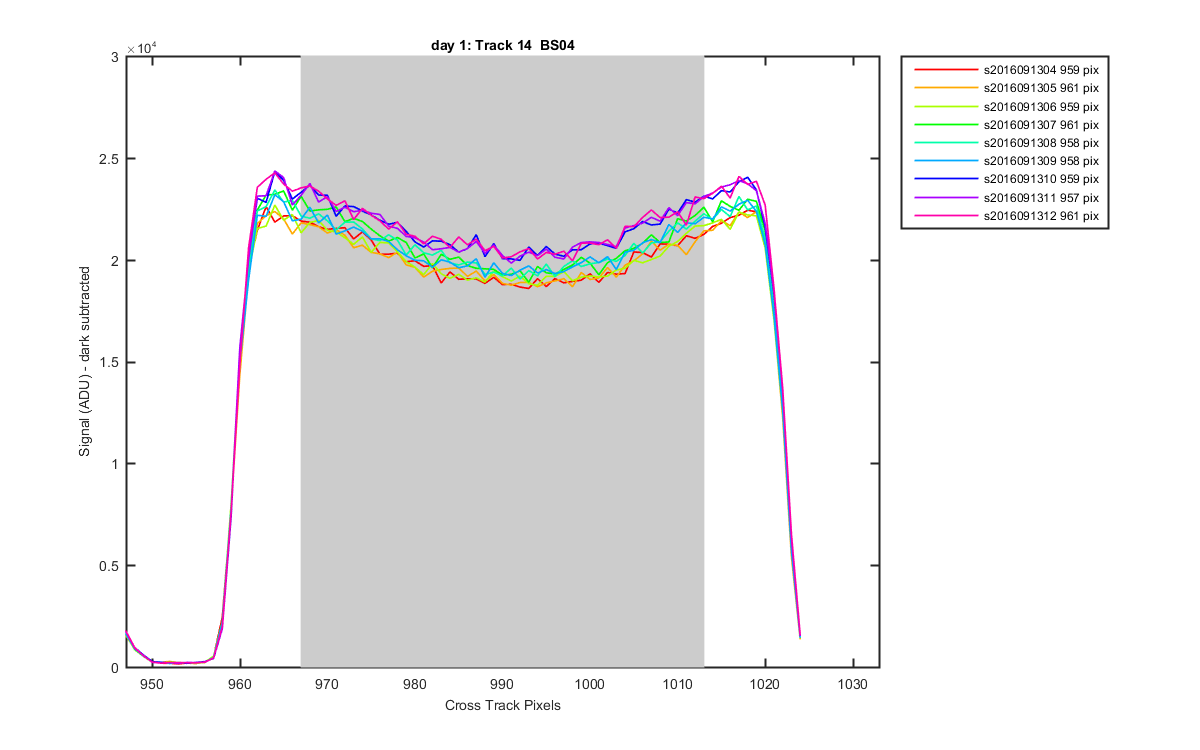
The graphs below show how I defined the tracks. Grey patches are what is averaged for each track. These are created from Oriel data, data sets 4 - 12 (temp control on and looking at the lamp). The track definitions are from the Resonon, on April 2016.
Track pixels:
Track:  1       2       3       4       5       6       7       8       9      10      11      12      13      14
Left:   11      88     165     237     311     382     456     528     598     672     743     815     889     967
Right:  66     140     212     284     356     429     501     574     642     717     790     861     935    1013
Figure 1
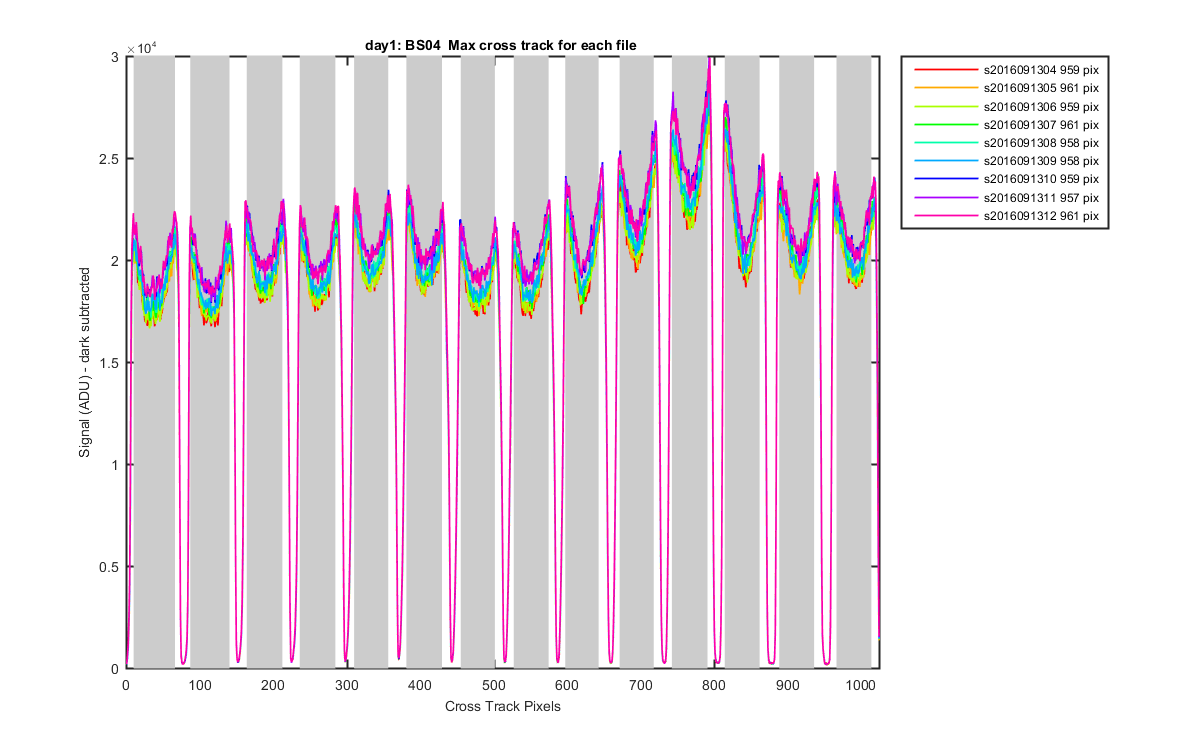
Figure 2
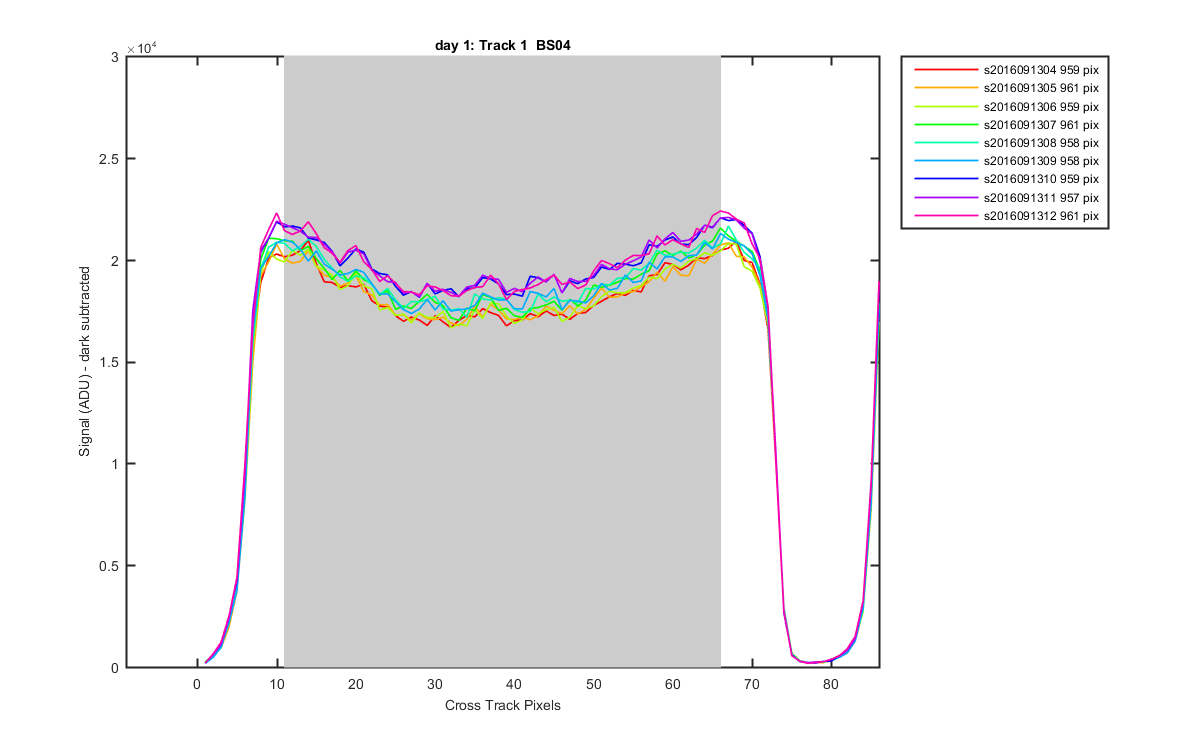
Figure 3
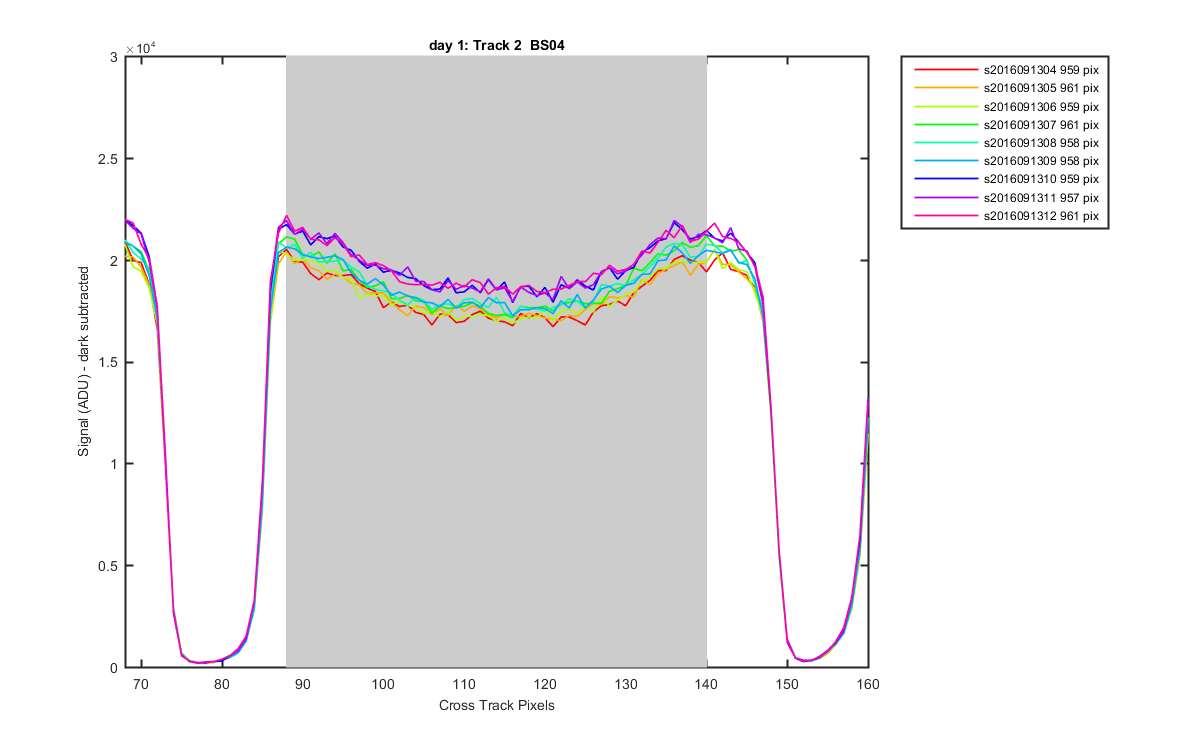
Figure 4
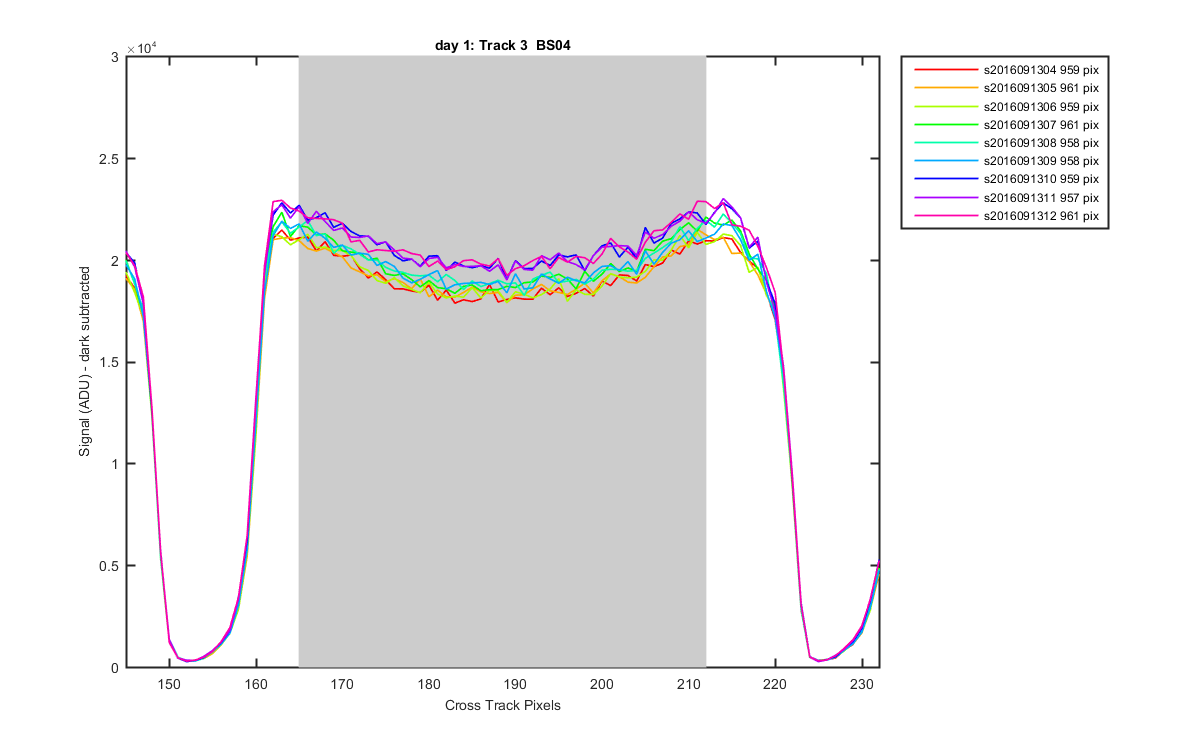
Figure 5
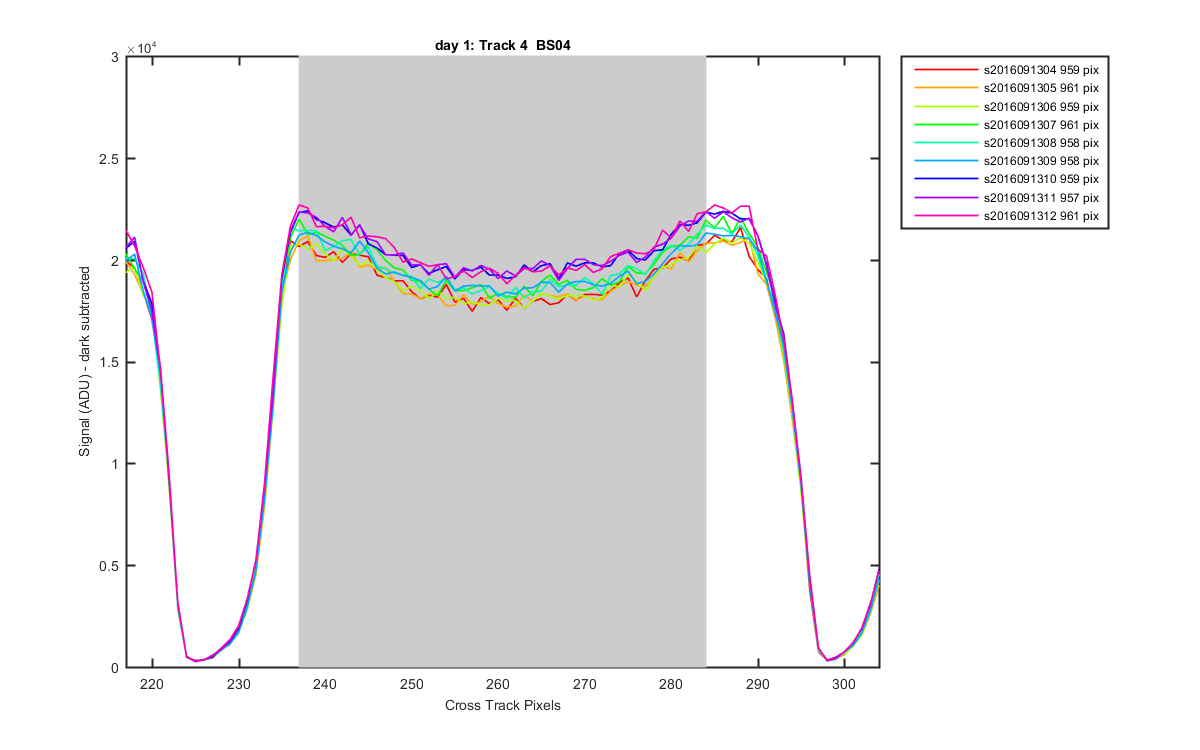
Figure 6
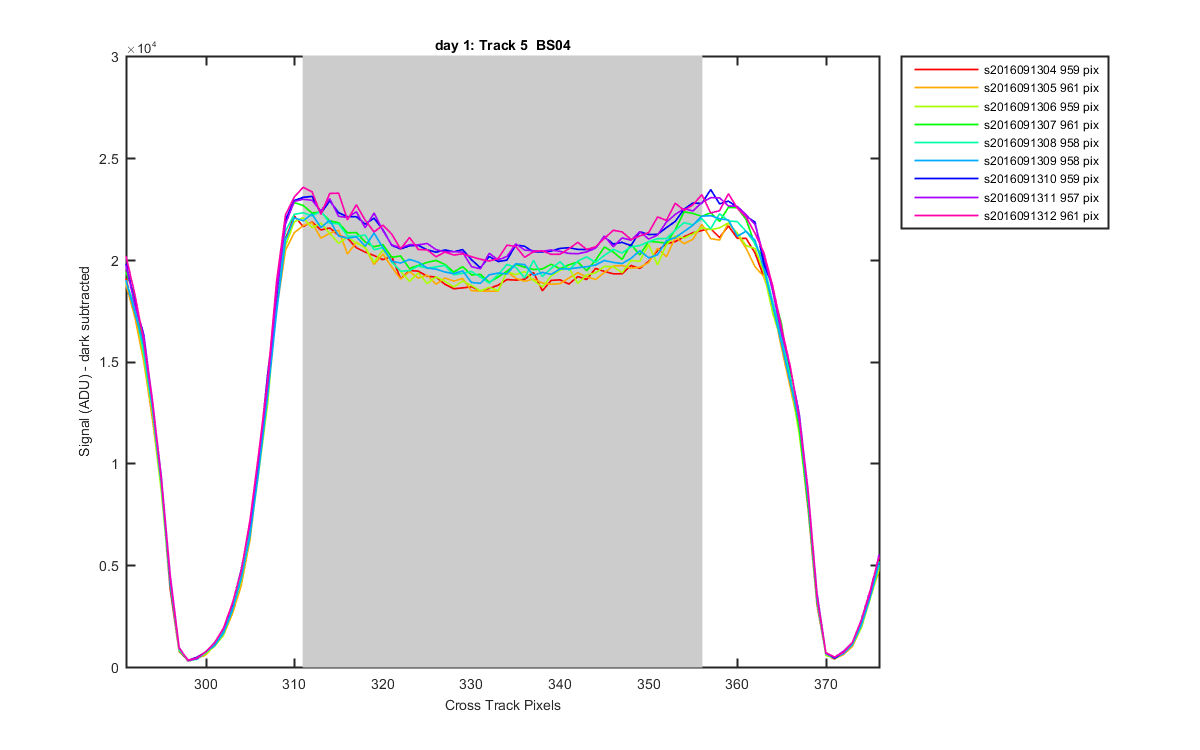
Figure 7
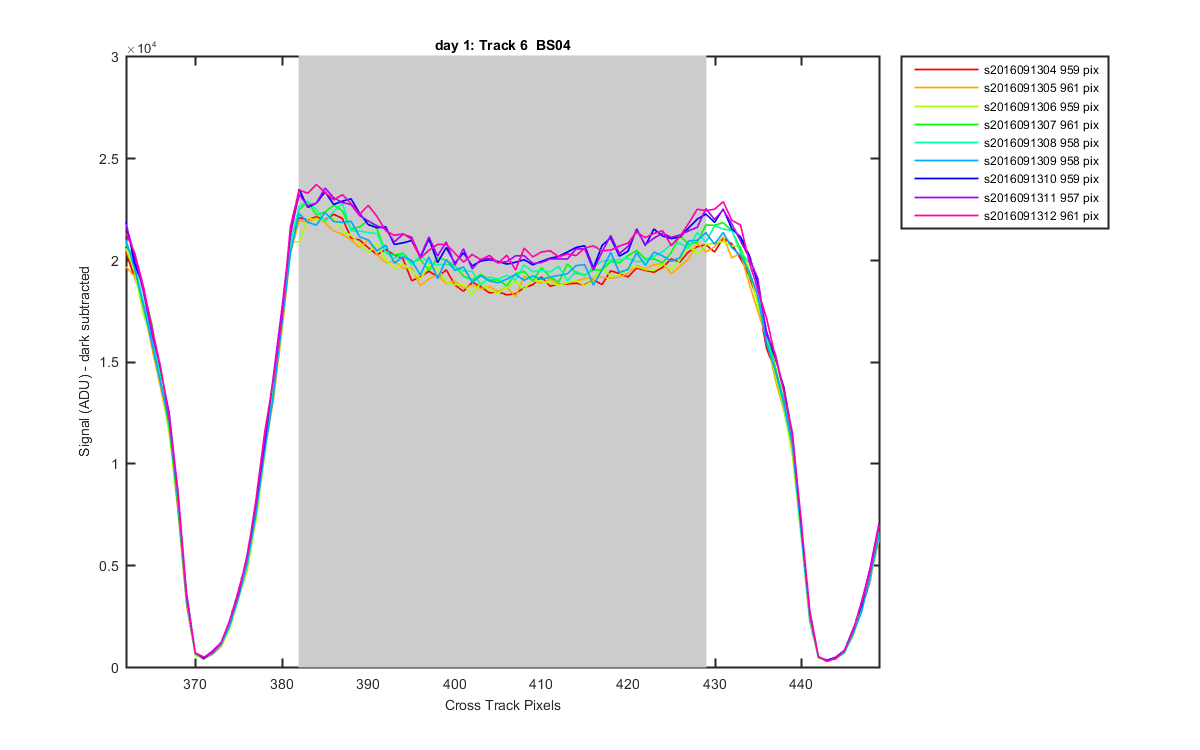
Figure 8
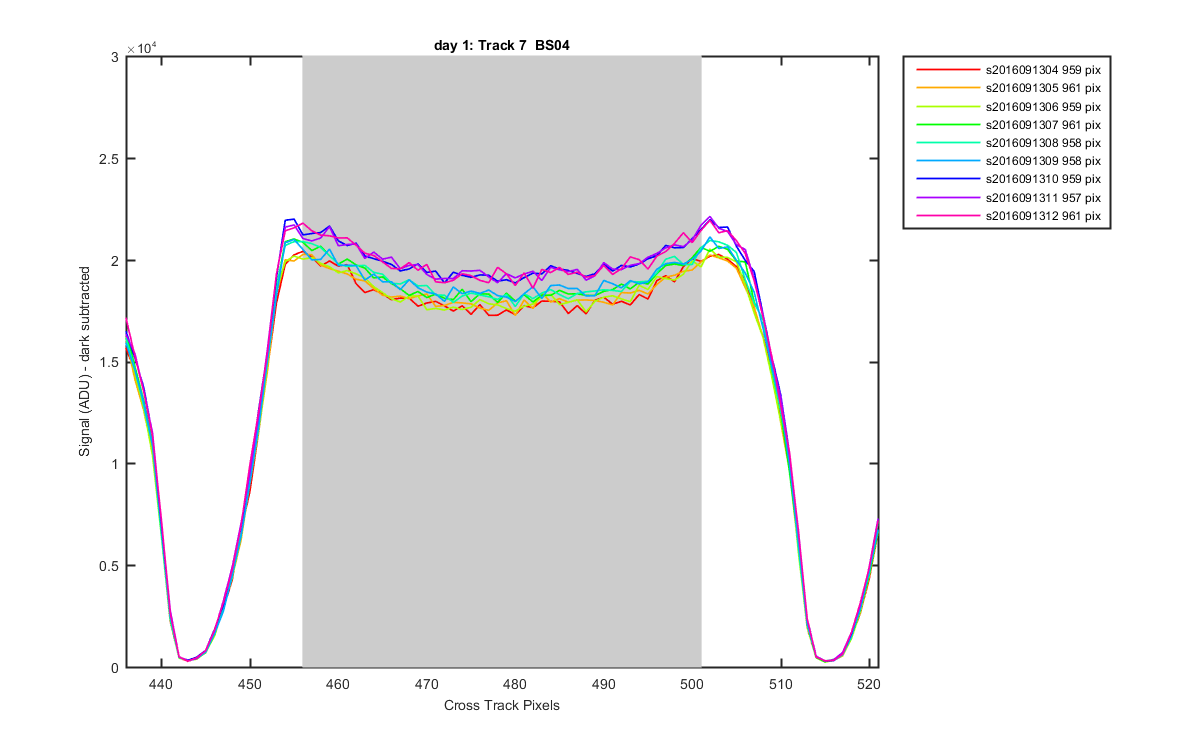
Figure 9
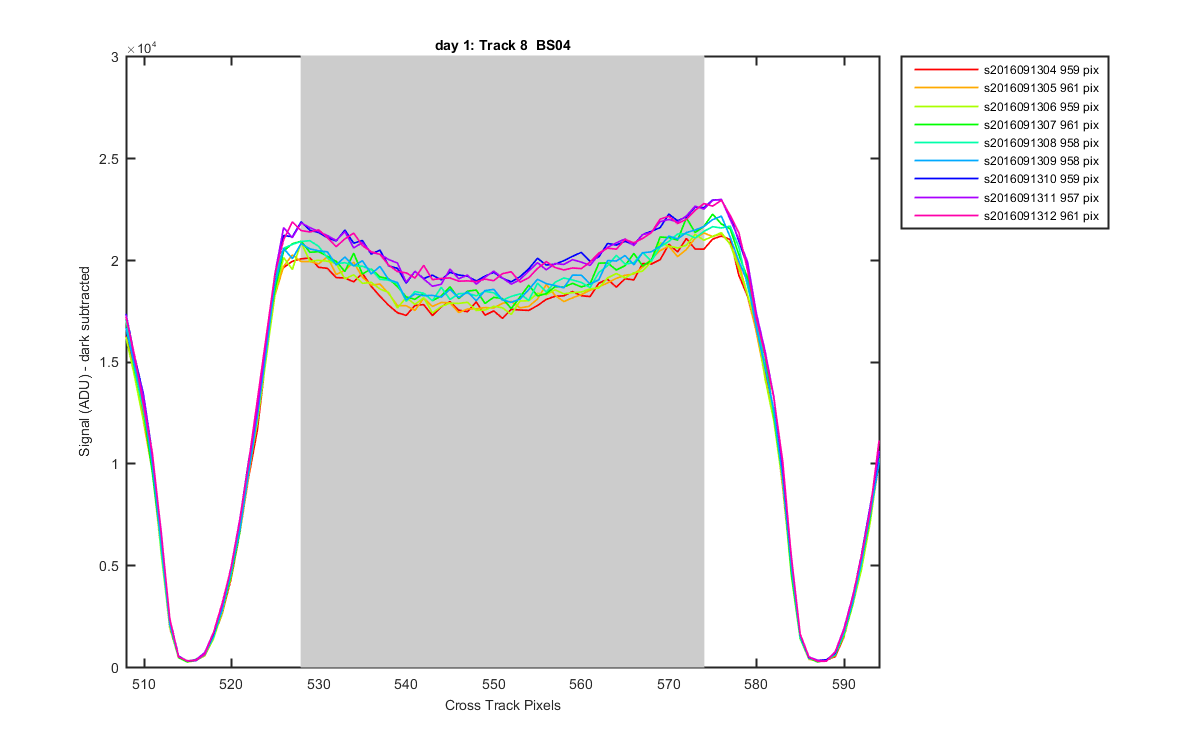
Figure 10
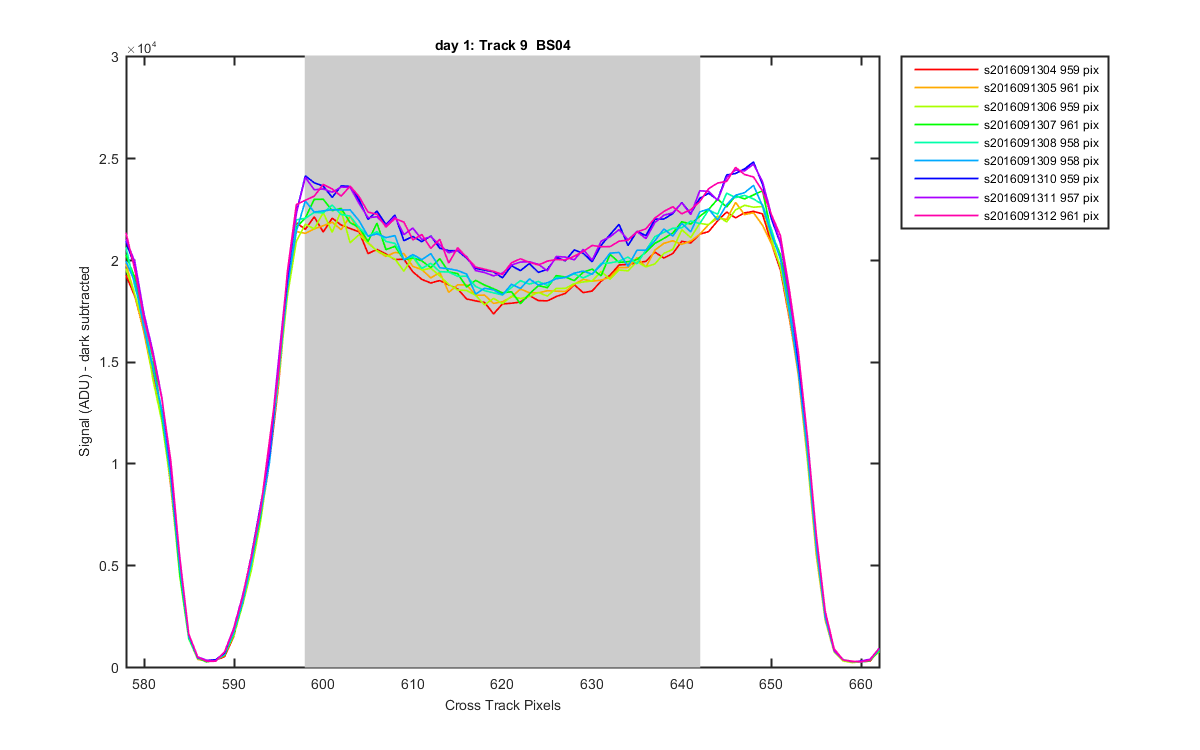
Figure 11
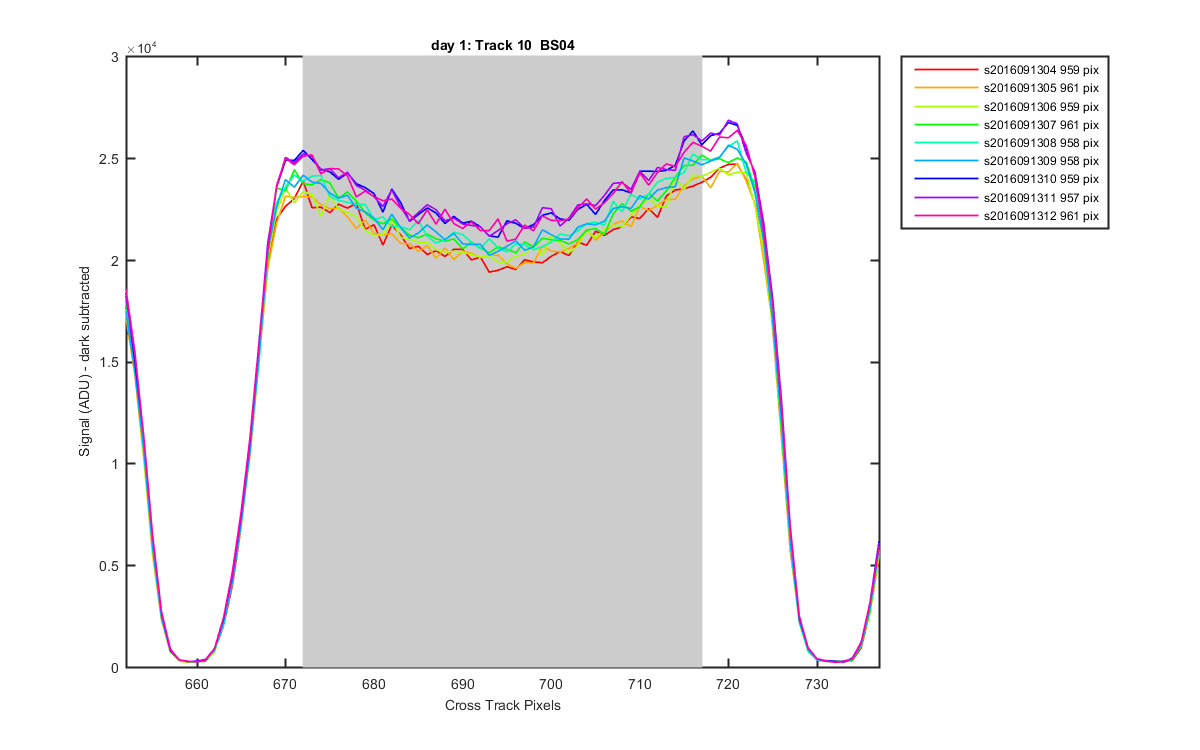
Figure 12
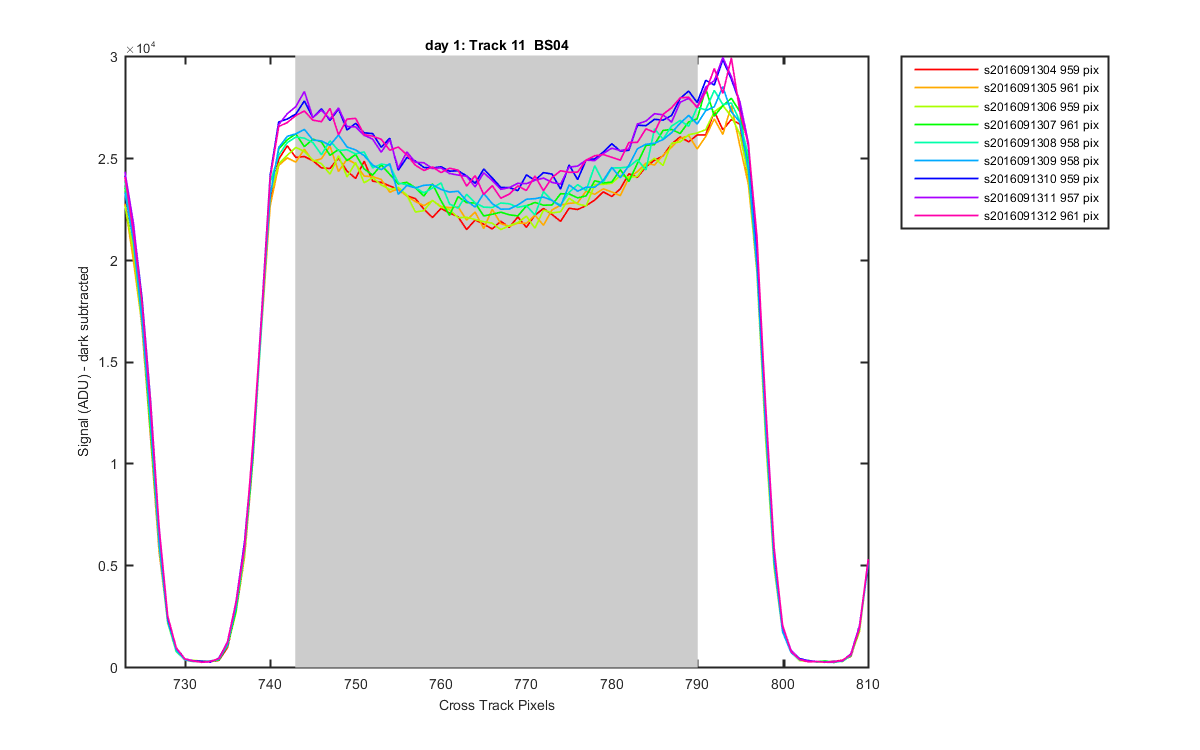
Figure 13
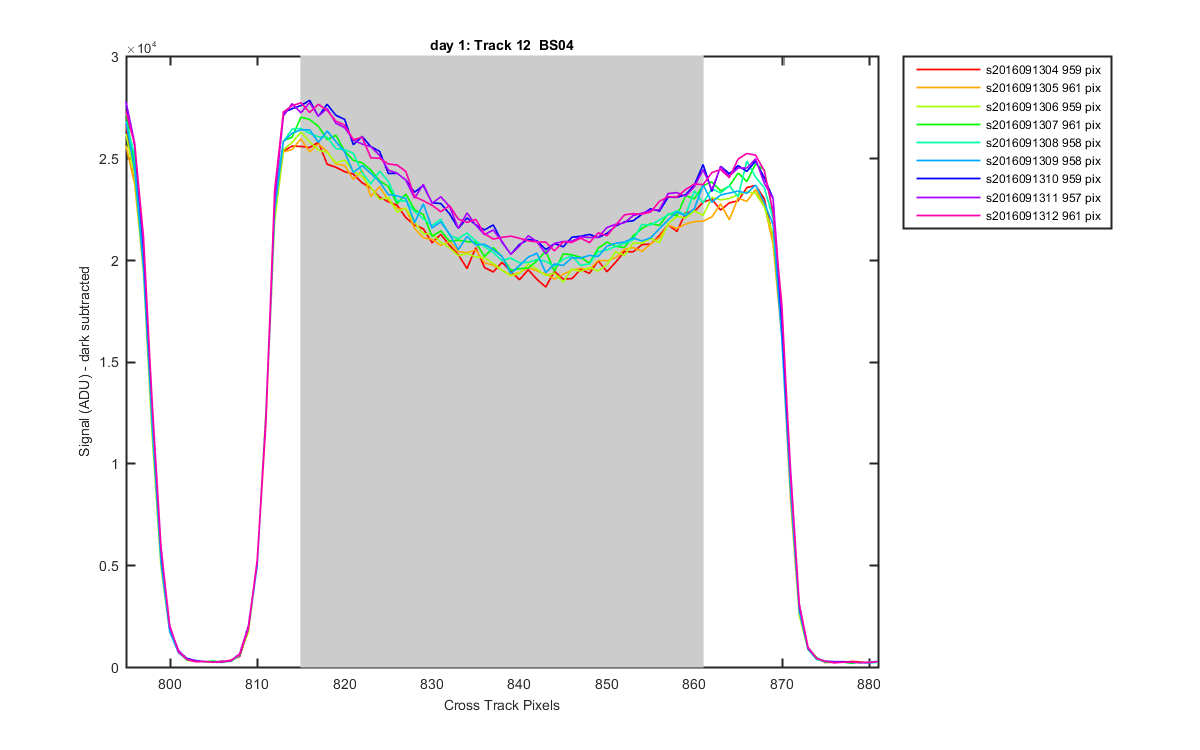
Figure 14
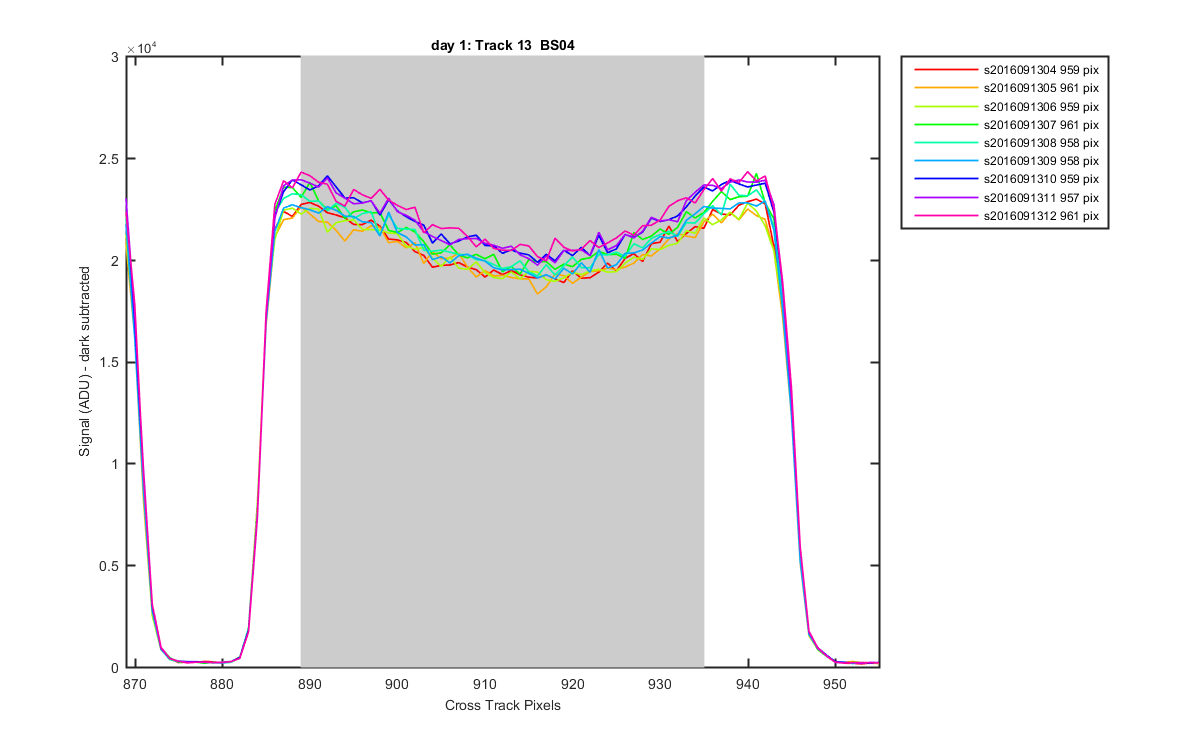
Figure 15