REVISION DATE: 18-Oct-2016 15:16:10
THESE GRAPHS are the "FULL TRACK" graphs. The tracks are defined from between track dark to between track dark.
Mikes first testing of the saturated and unsatured laser data on track 7 at 500 nm. Mike started with unsaturated laser data and slowly increased the laser power to get more and more saturated data. In order to try to "scale" in the saturated a unsaturated data Mike took a number of measurements during the laser data. He had his usual Photodiode monitore data in an ASCII file. Then in addition there was the laser power, laser internal 355 nm PDmon, Gentec laser power detector and the Gentec laser power detector "zero" value. For more detail on these read Mikes day3 email and see his log sheets. The 23 laser files are plotted below and and the all the associated auxilliary data. I then plotted the laser data normalized by each of the auxilliary data set just for fun. Looks like the PDmon and Gentec Laser power detector do the best job of normalizing the data.
The reason Mike takes all the auxiiliary data is because the Resonon system has such low stray light we can not get a good idea of what the delta shape looks like from one measurement. If the peak is not saturated then we can not see the delta shape and if the peak is saturated so we can see the delta shape then we can not use the in-band area to normalize the laser data. So we have to take both and merge them together. To get the levels right for the merging we need to scale the laser data sets to the same scale. We dont have the exact right system to do this so Mike is taking a number of auxilliary data sets to see if one will work.
Note all the data are Net signals which means lite - dark and divided by int time and "bin factor"
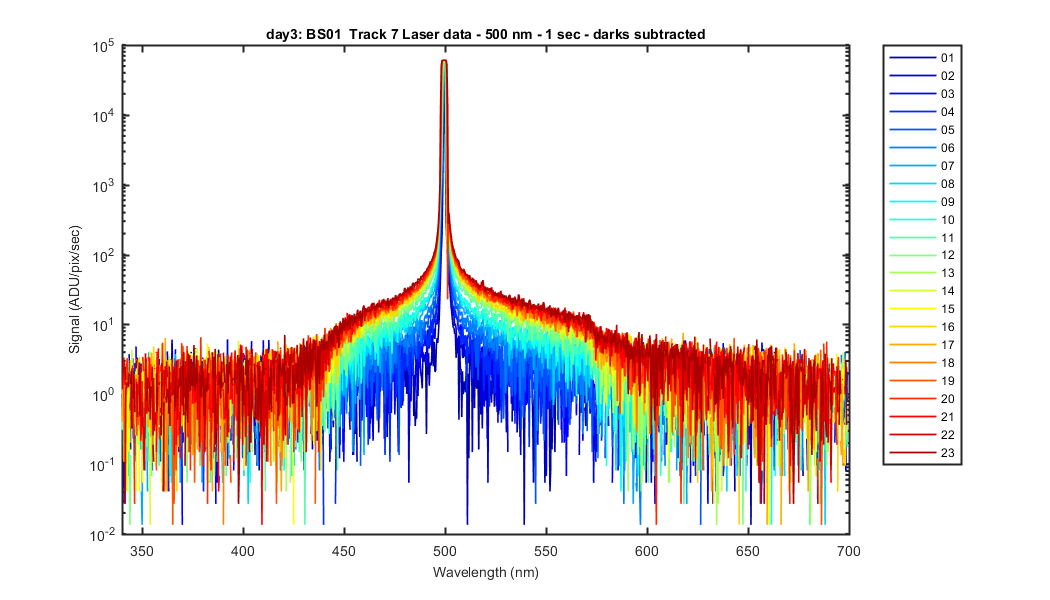
All the laser data. Files 01 and 02 are unsaturated and the rest are saturated more than more. Note the large red/orange spike in on the right edge of the peak is from File num 20. It is not from a spike but appears to be cause my saturation. Other files show a similar feature but not as large.
Figure 1
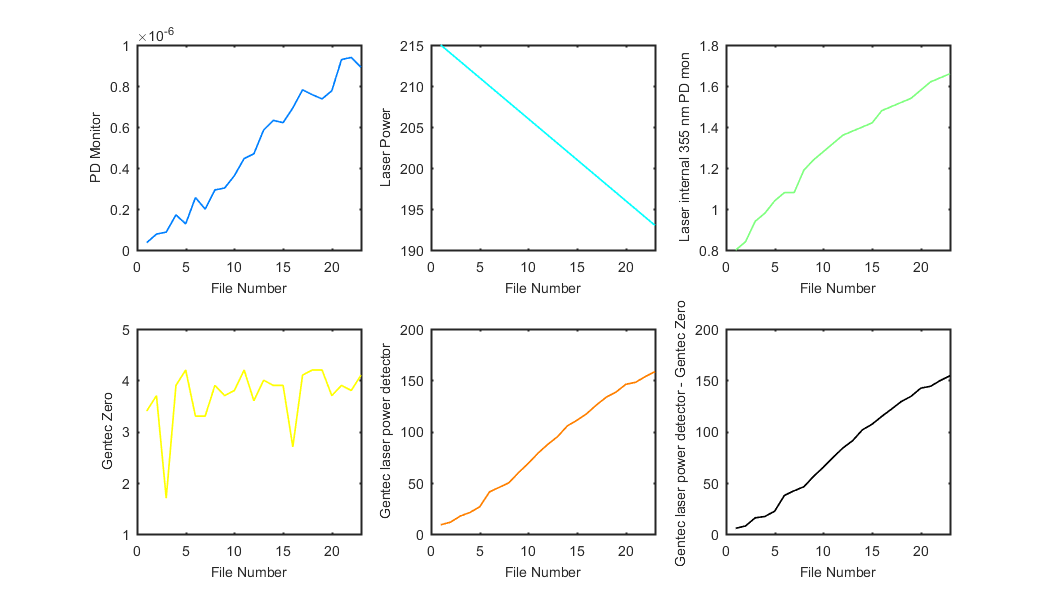
The Auxilliary data Mike took. The black line is the Gentec laser power detector - the Gentec zero. Mike is not sure what the zero means so I thought I would plot it just in case.
Figure 2
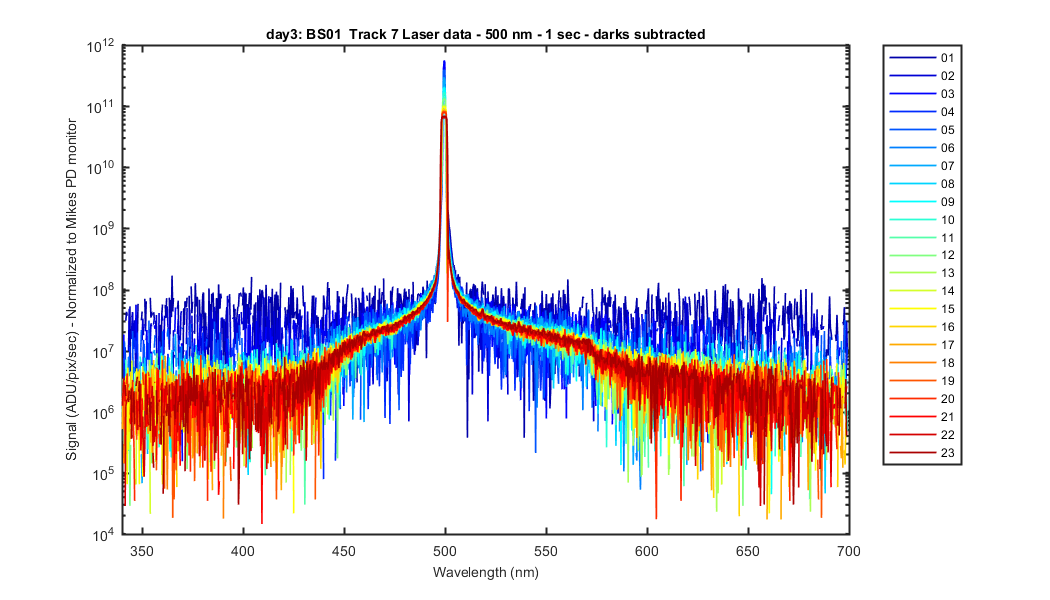
Laser data again, normalized to the Photo Diode Monitior. Seems to do a pretty good job of getting the data on the same scale so the overlay each other.
Figure 3
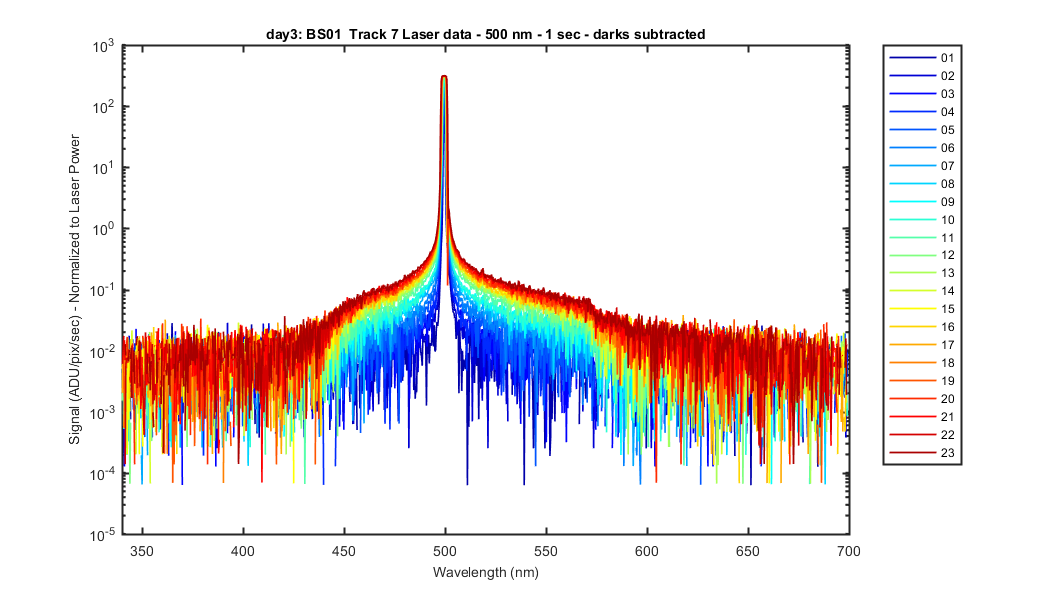
Laser data again, normalized to the Laser Power. Not a good proxy.
Figure 4
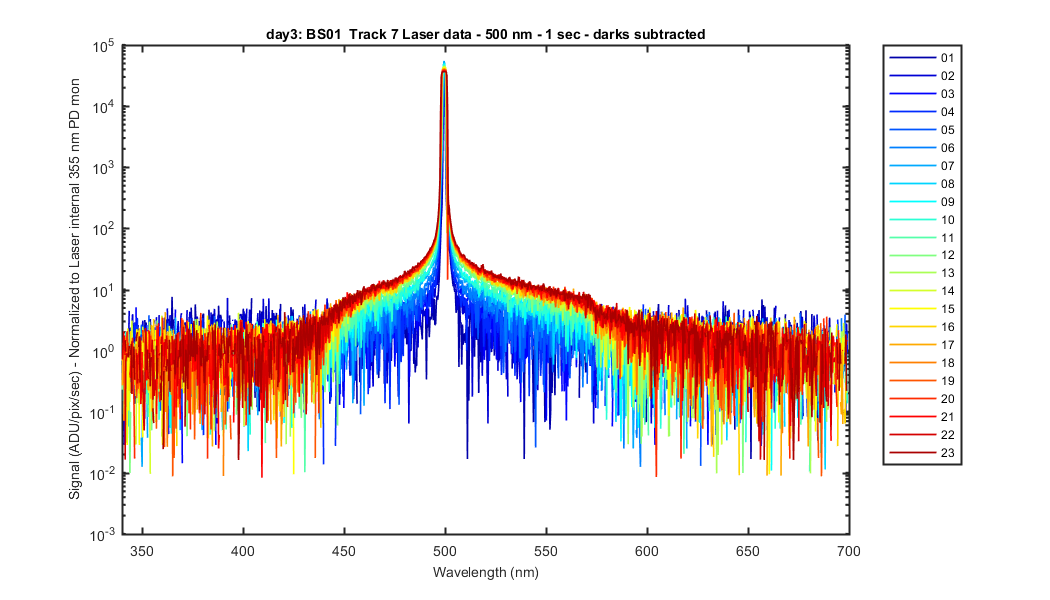
Laser data again, normalized to the laser internal 355 nm PDmon. Not a good proxy.
Figure 5
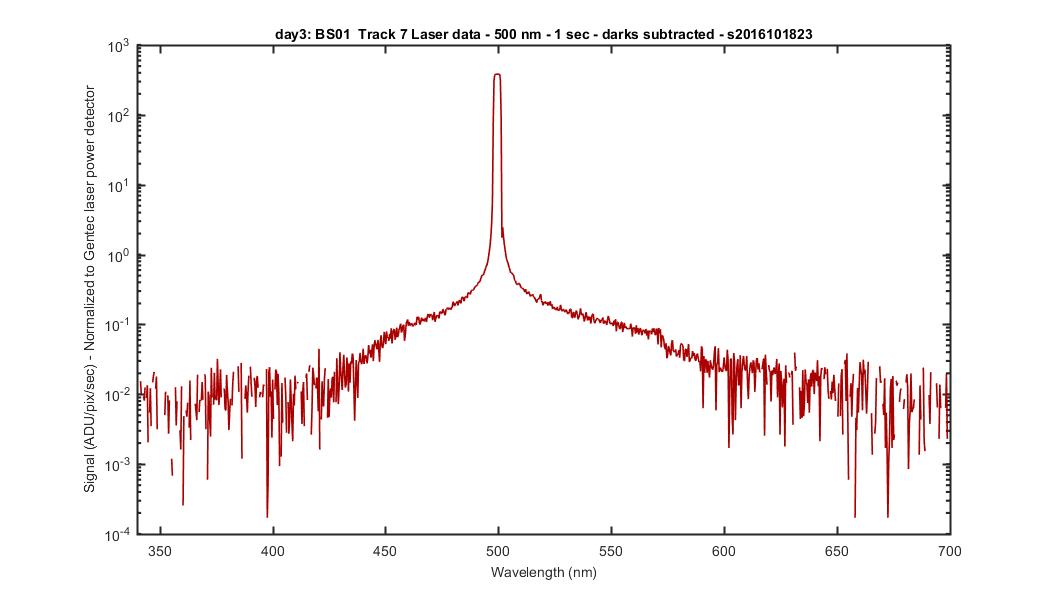
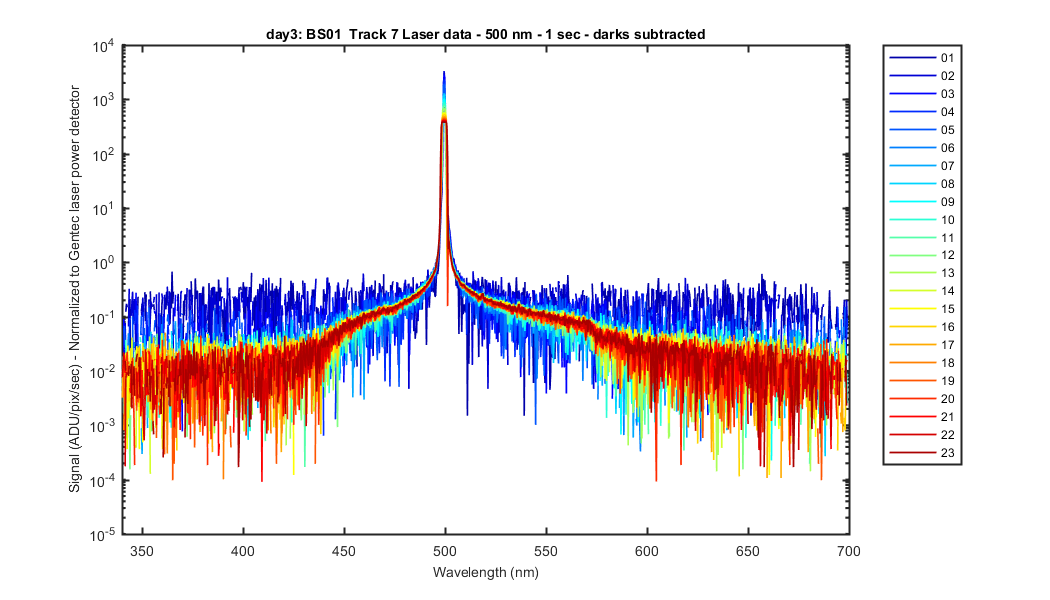
Laser data again, normalized to the Gentec laser power detector . Also does a good job.
Figure 6
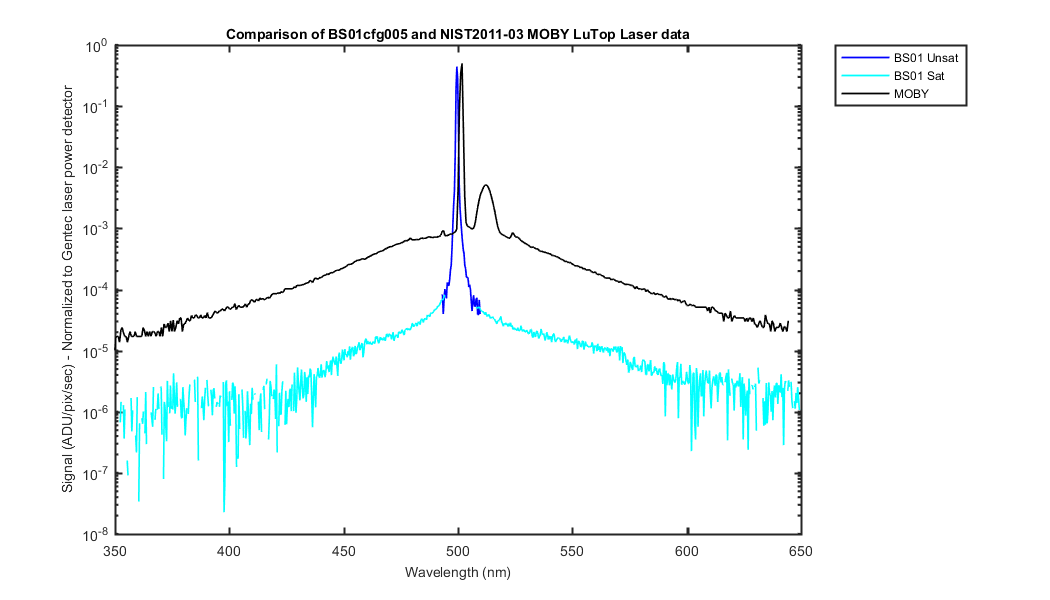
Ken asked me to make a graph comparing the laser data to the MOBY LuTop data. The black line is MOBY from NIST 2011-03 for the LuTOp data at 501 nm. The two blue lines are the saturated and unsaturated laser data sets. Normalized to the Gentec laser power detector and then the in-band area of the unsaturated laser data. So they BS01 and MOBY laser data are on the same scale.
Figure 7
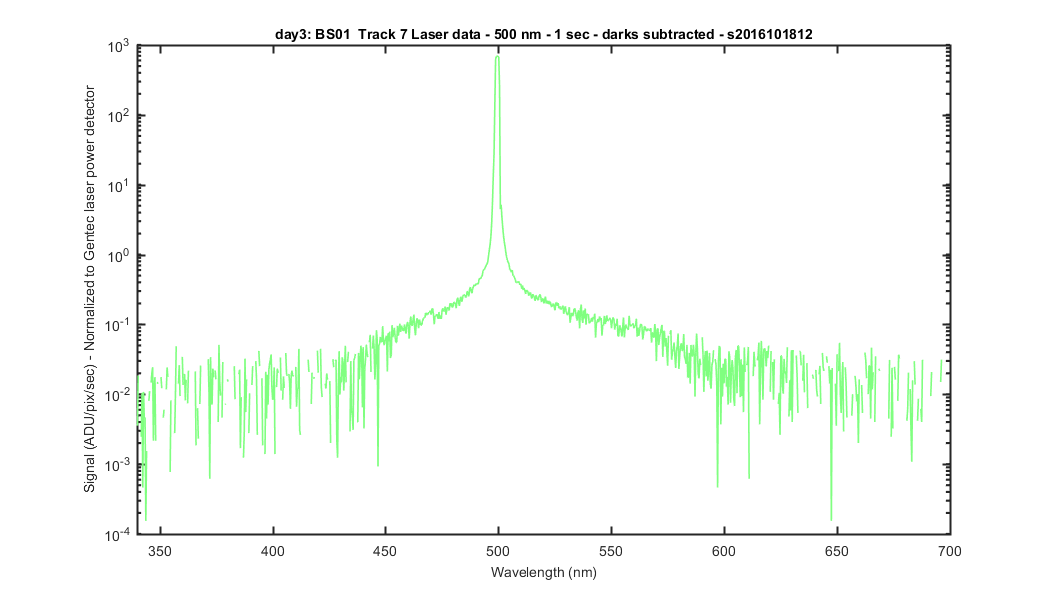
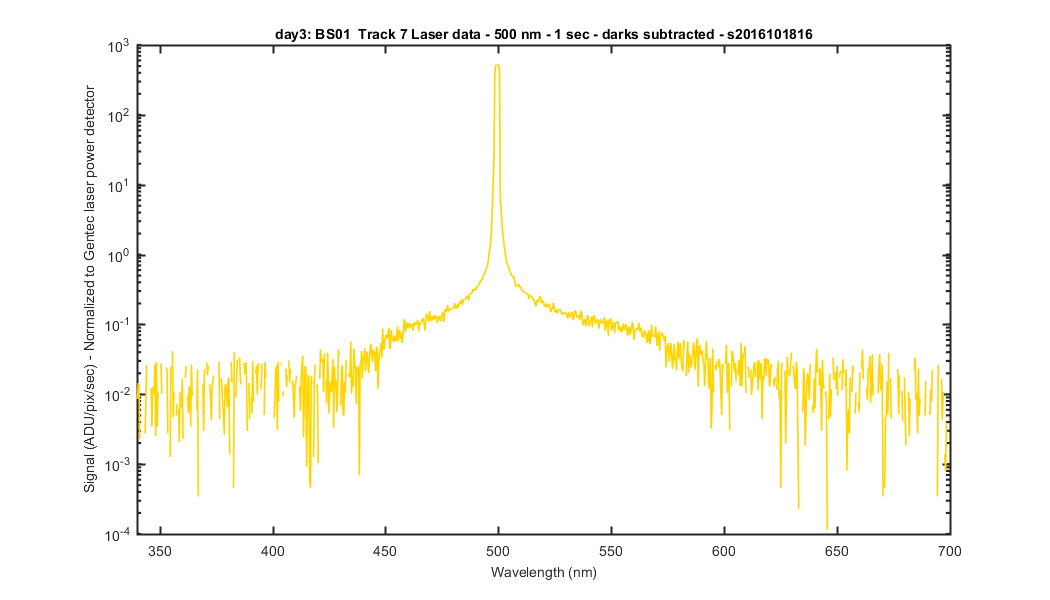
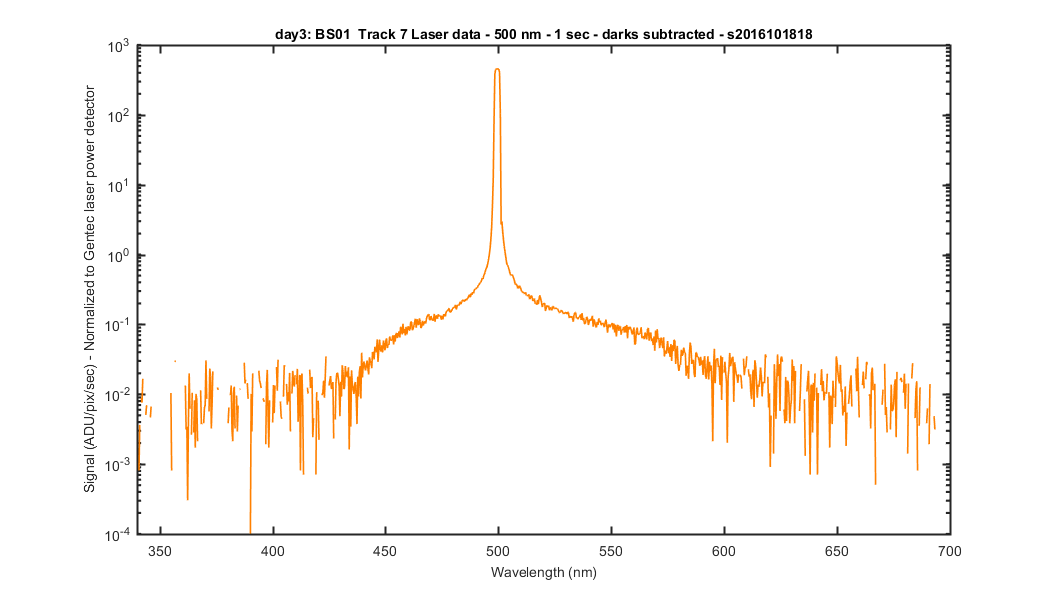
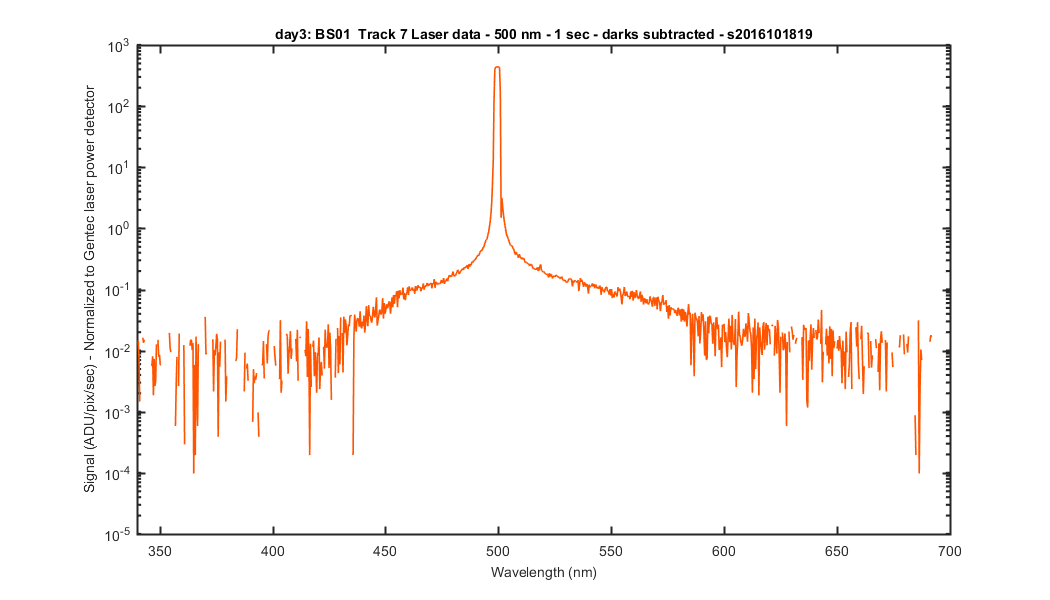
The rest of the graphs are the individual laser data sets, so you can see them individually.
Figure 8
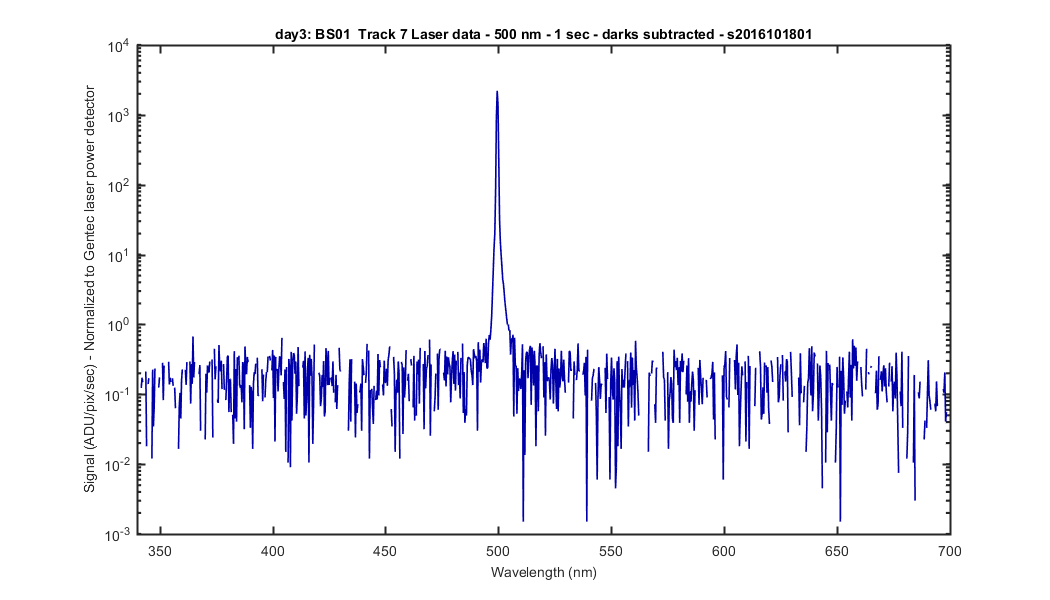
Figure 9
Figure 10
Figure 11
Figure 12
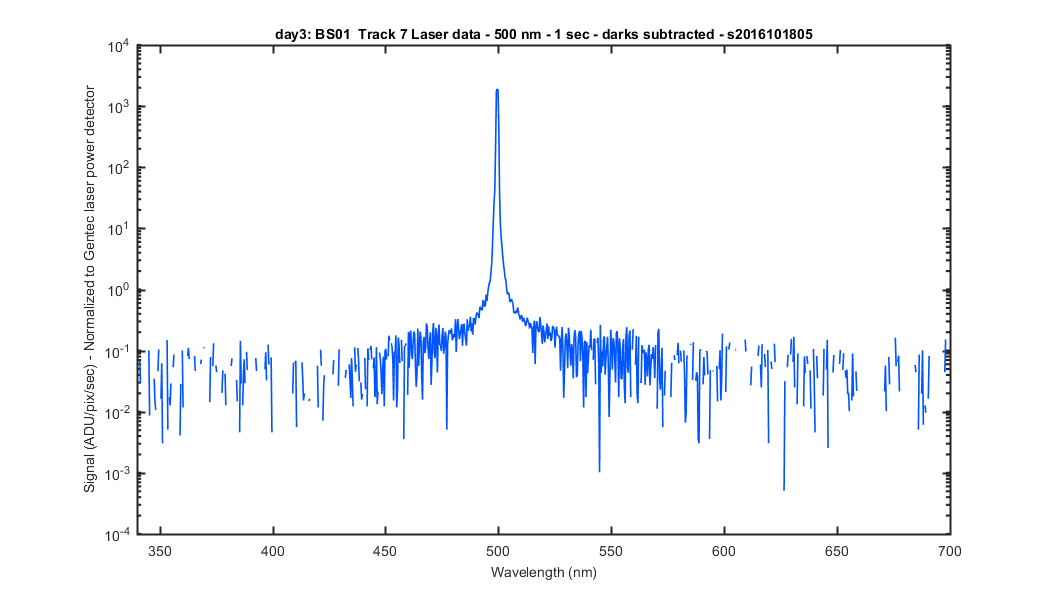
Figure 13
Figure 14
Figure 15
Figure 16
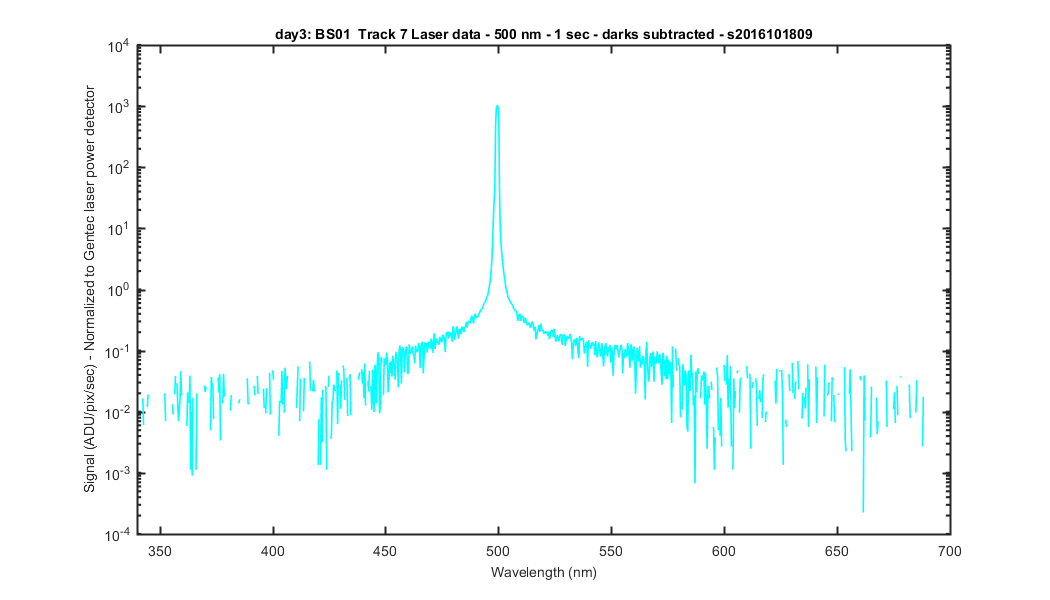
Figure 17
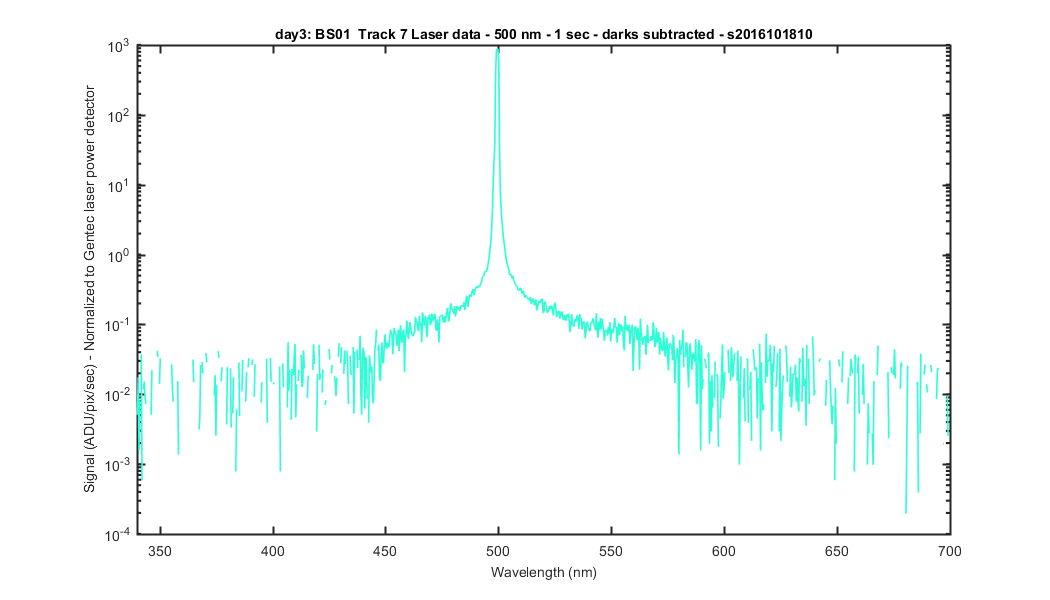
Figure 18
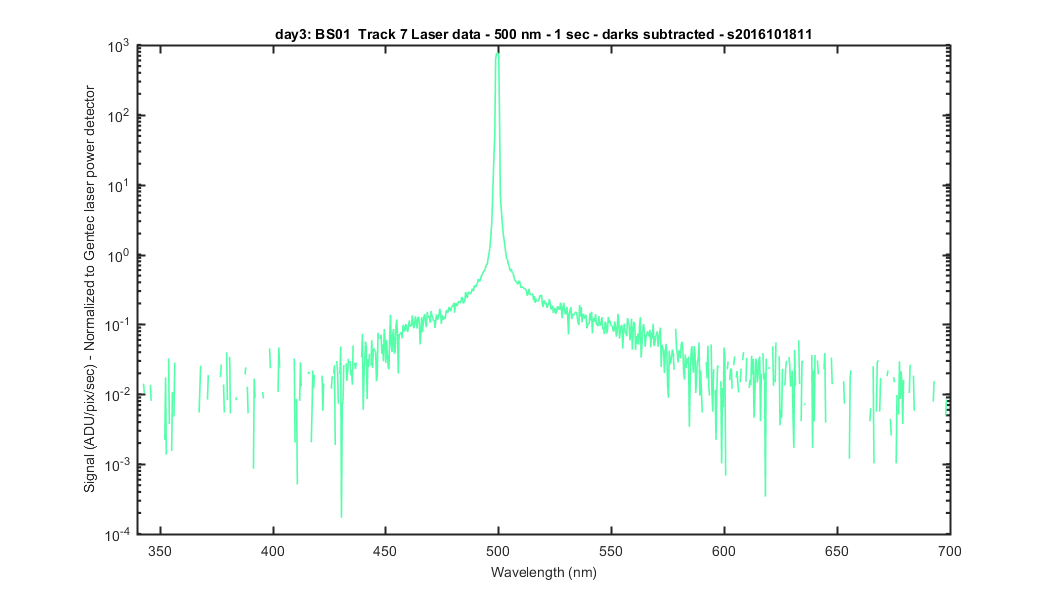
Figure 19
You can see a spike on the right side of the peak here. This is in the light image cause I think my saturation, not a noise spike in the data.
Figure 20
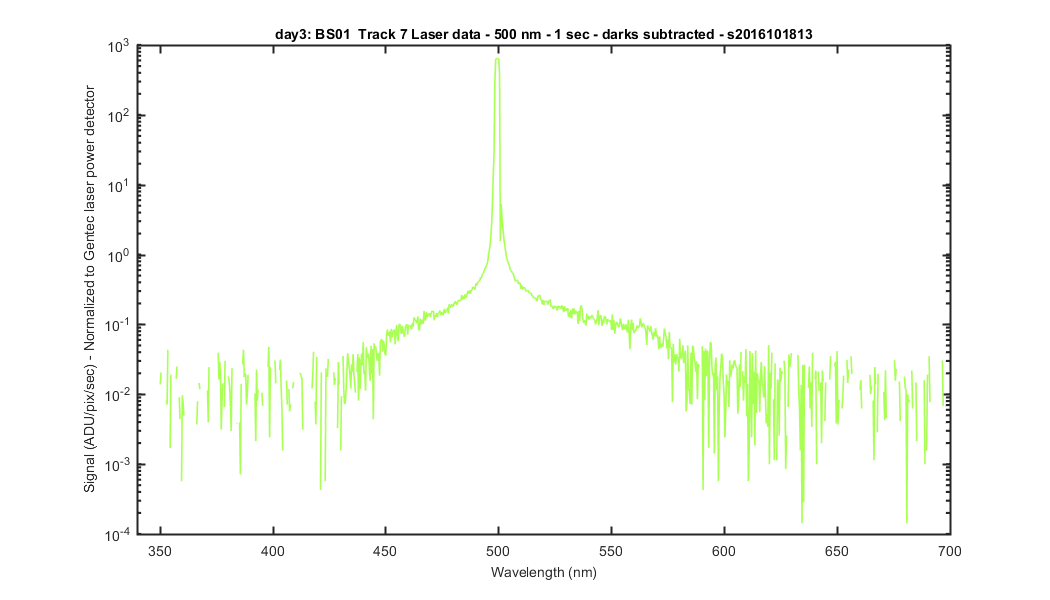
Figure 21
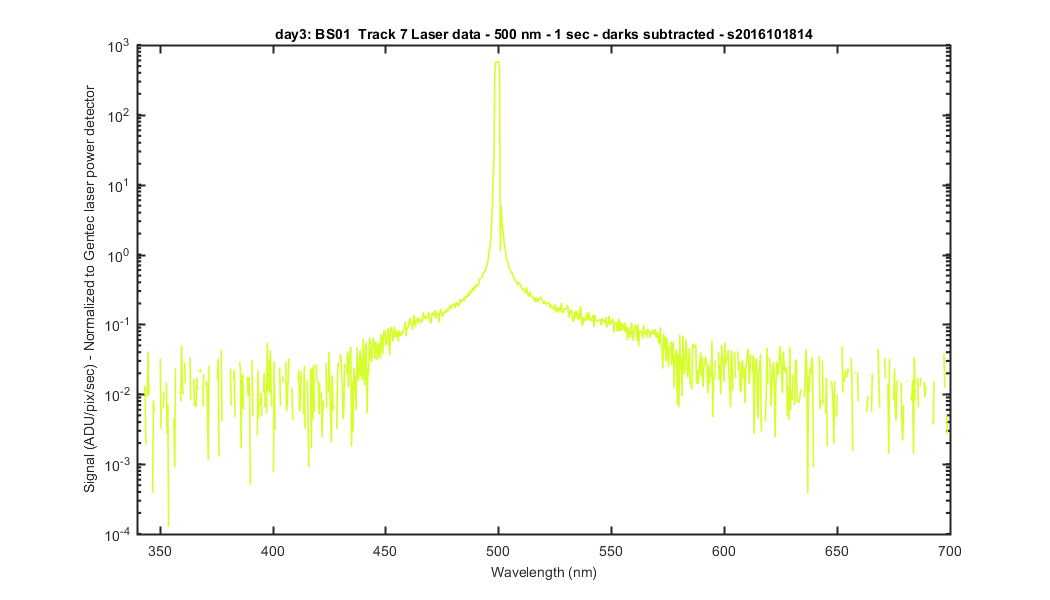
Figure 22
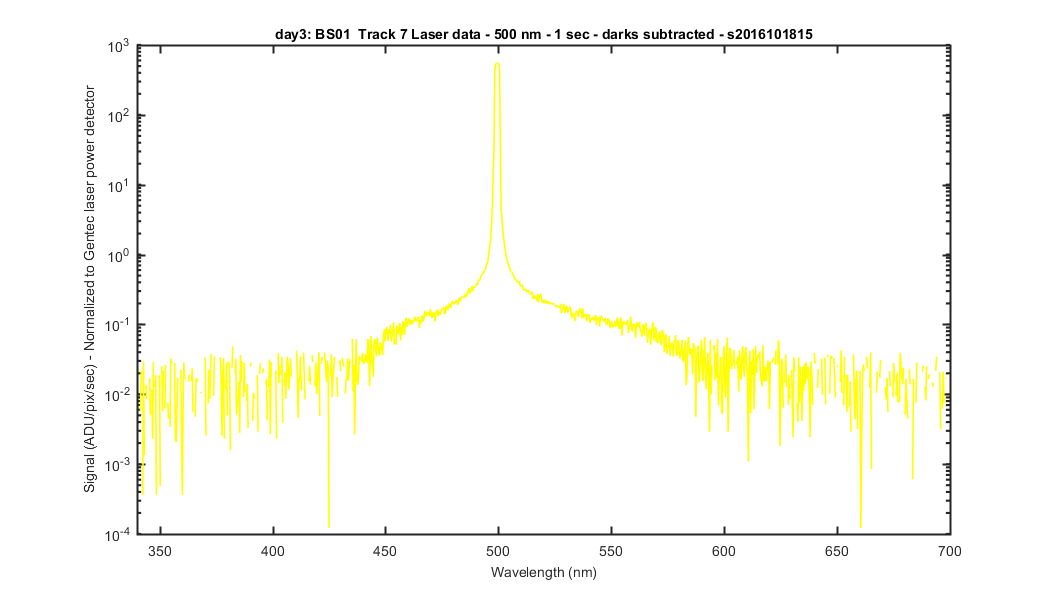
Figure 23
You can see a spike on the right side of the peak here. This is in the light image cause I think my saturation, not a noise spike in the data.
Figure 24
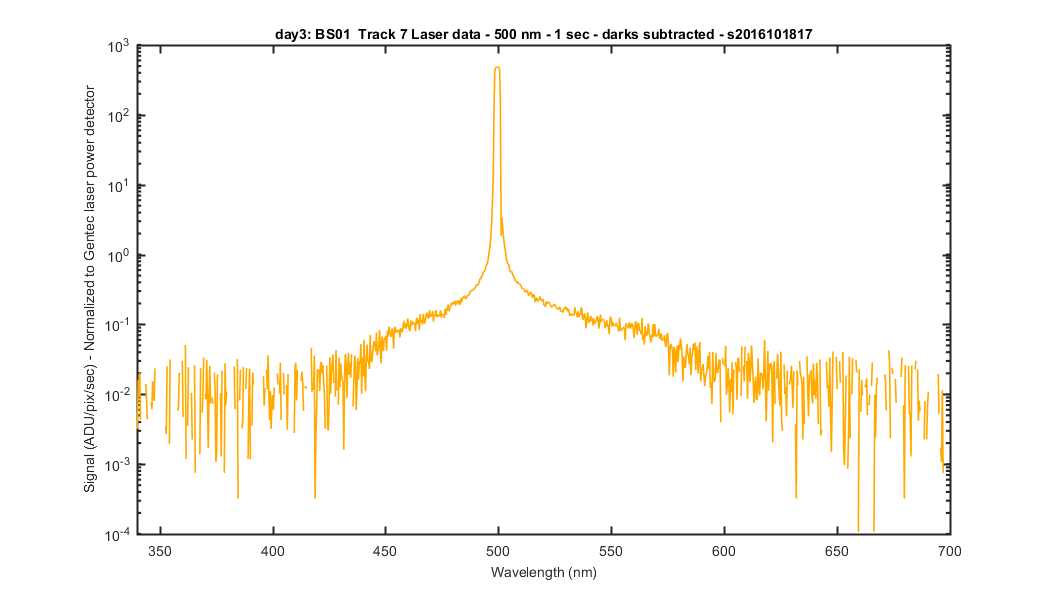
Figure 25
You can see a spike on the right side of the peak here. This is in the light image cause I think my saturation, not a noise spike in the data.
Figure 26
You can see a spike on the right side of the peak here. This is in the light image cause I think my saturation, not a noise spike in the data.
Figure 27
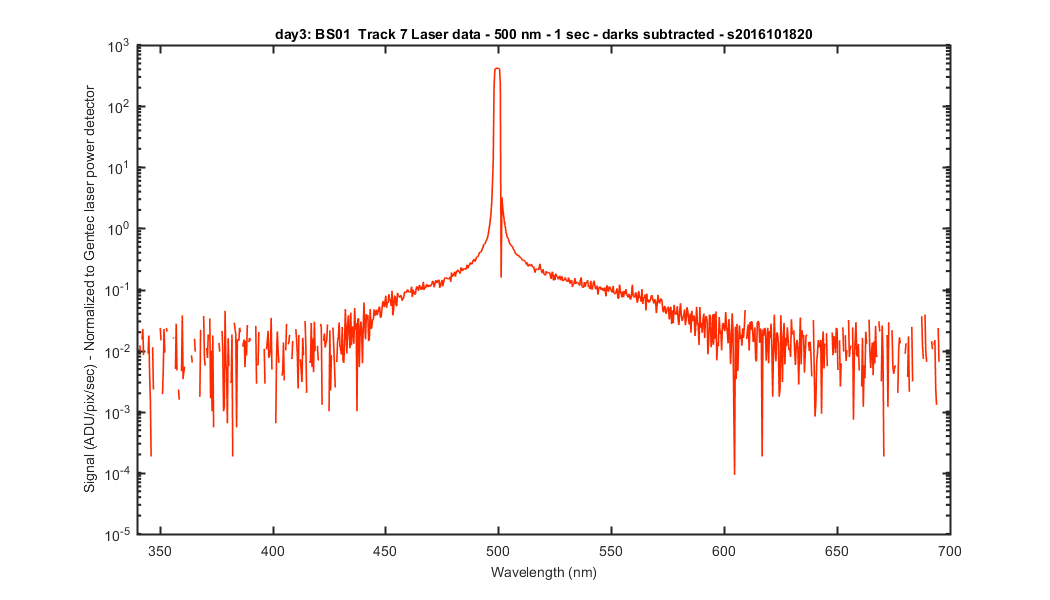
Figure 28
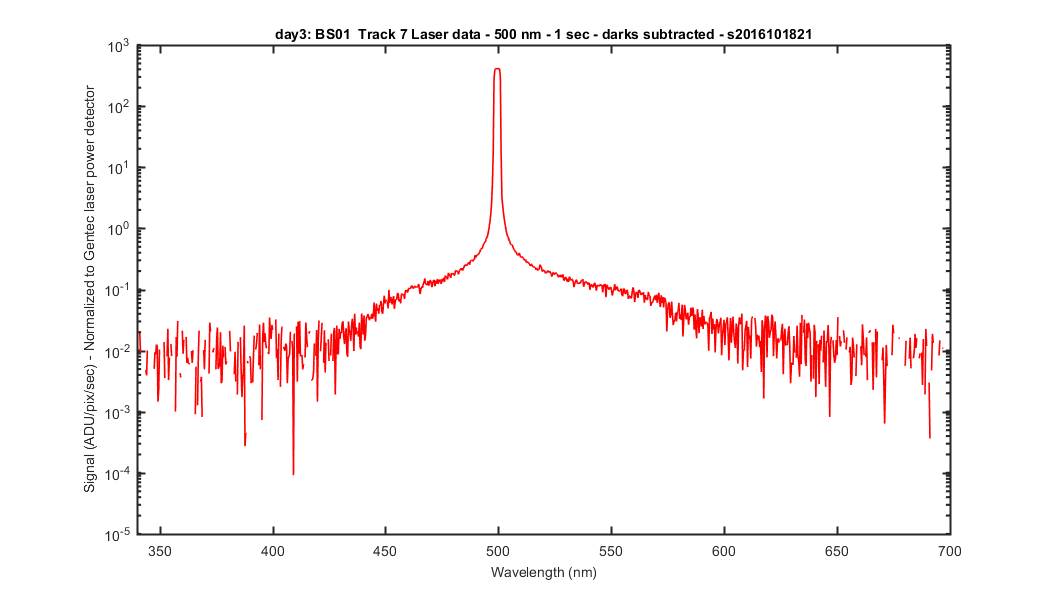
Figure 29
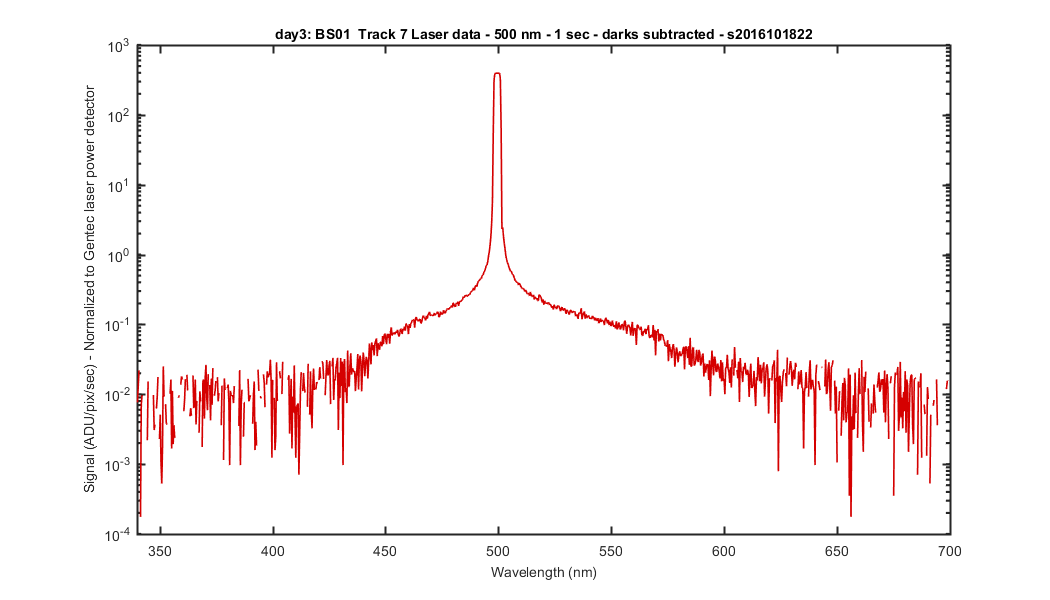
Figure 30