REVISION DATE: 16-Sep-2016 14:14:13
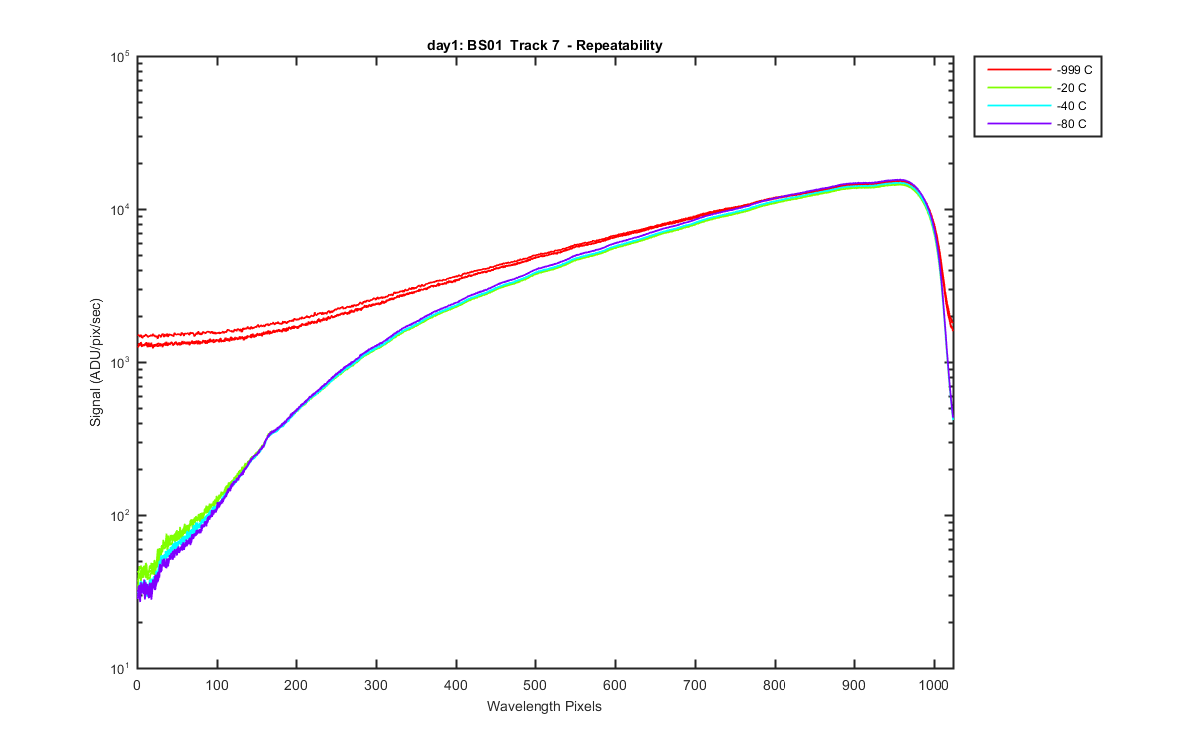
My attempt at using Mikes 3 repeats for each of the 4 temperature settings to look at repeatablility and the standard deviation across the array. All the data are dark subtracted.
The 12 files collected at 4 temperature settings
Figure 1
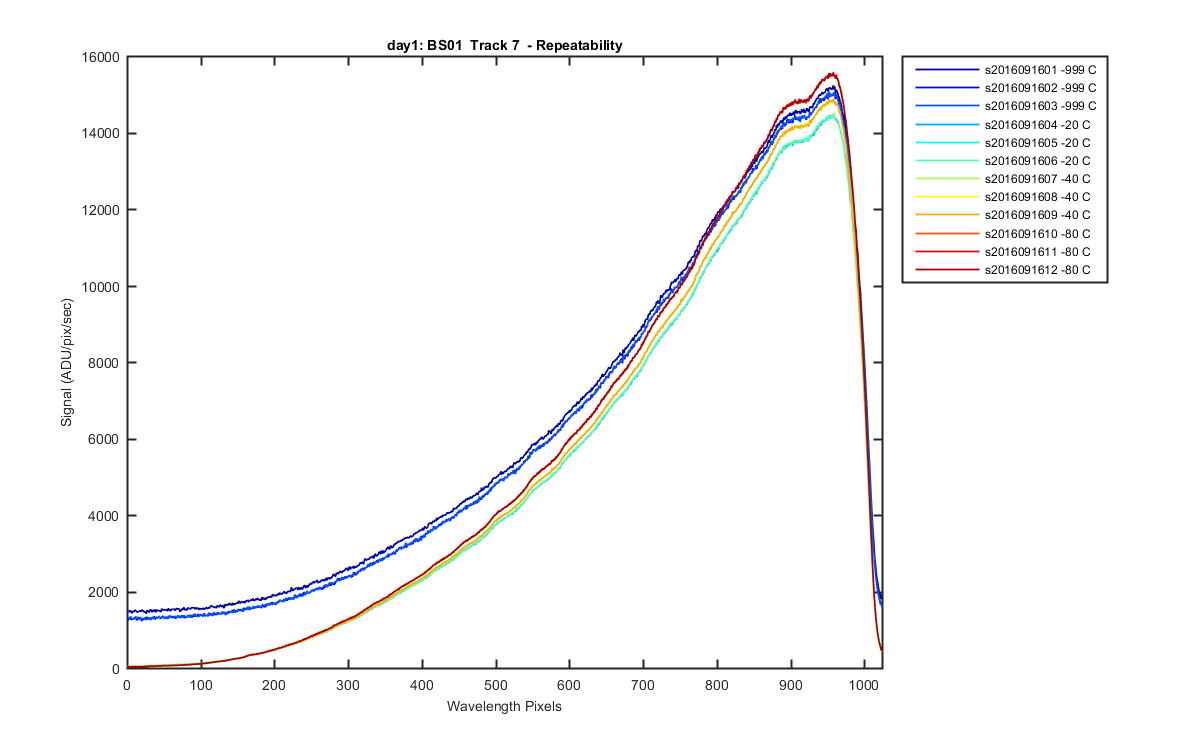
Figure 2
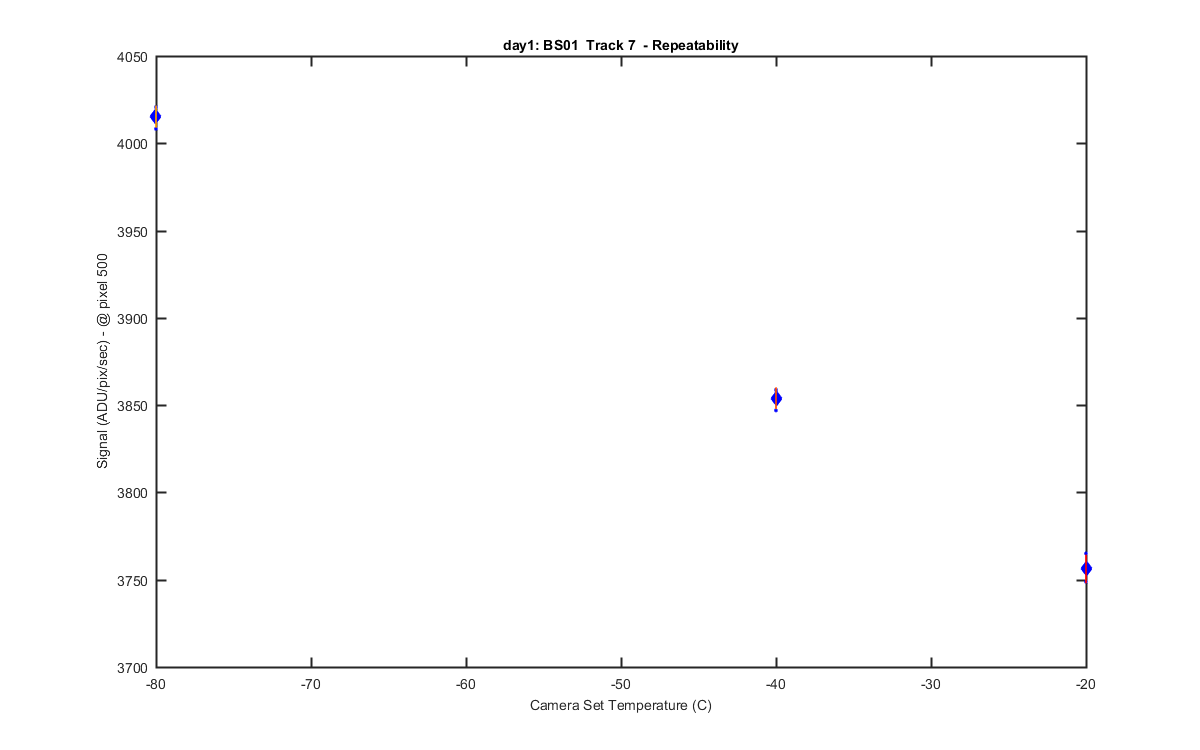
The temp controled files only. The diamond is the mean of the three files from the temp on the x-axis for pixel 500. You can barely see it but the line is the +- std.
Figure 3
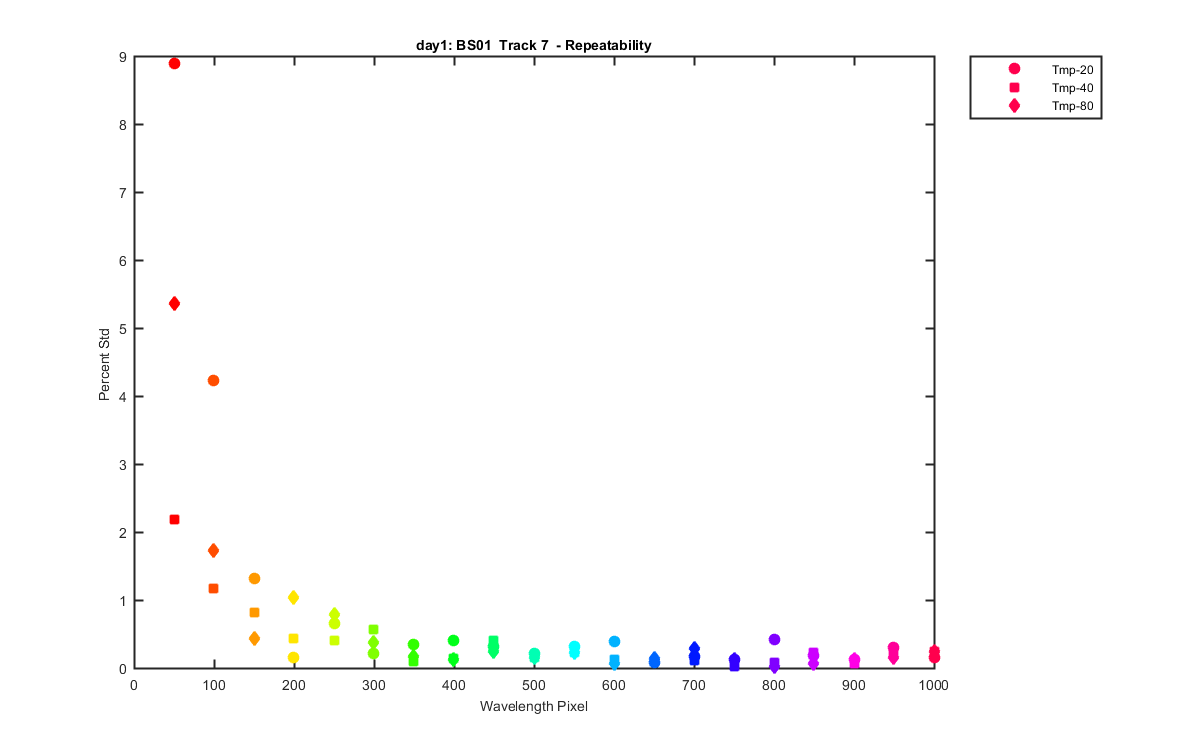
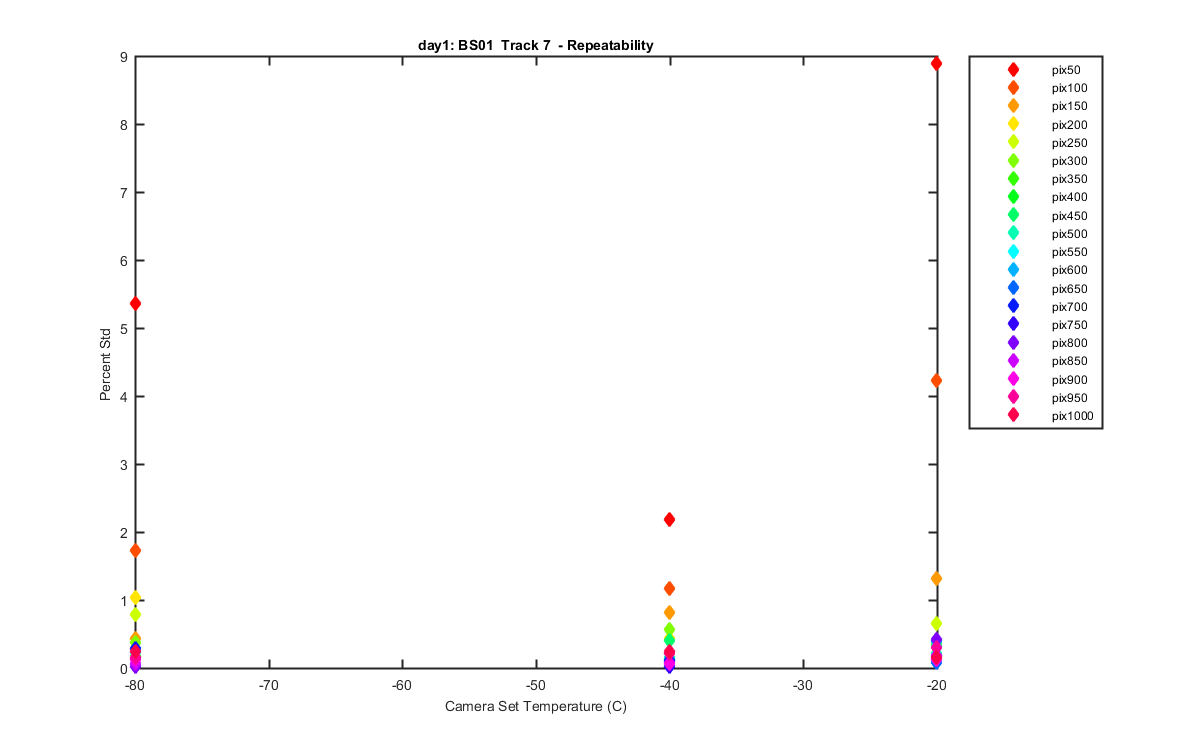
Plot of the percent standard deviations by set temperature. Each %std is calculated from the mean of the three files taken at temp X and for pixel Y.
Figure 4
Same as FIgure 4 put plotted vers pixel with temperature indicaetd by symbol.
Figure 5