REVISION DATE: 15-May-2017 13:54:19
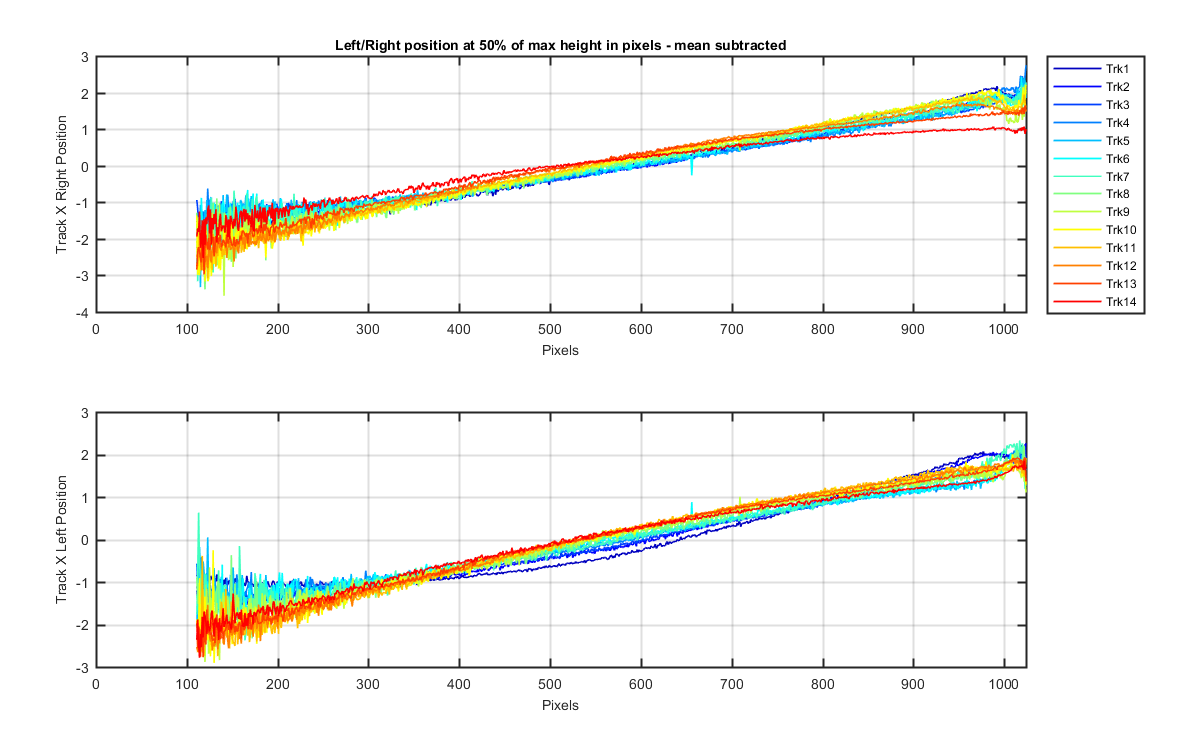
To look at track movement I created an algo that found the left and right track position at 50% of the max height. But this could also be used to show the curvicure of the tracks edges and movements for the whole track not just a few pixels. So for only one file the s*12.fits file I calculated the track positions for Track 1-14. I threw out the low signal level data since the algo does not work when the signal is really low.
Thre first 14 graphs show the track in relation to the defined track. The last one shows the left and right edge positions for each track for that one file. I have subtracted the mean track position so they all lay on top of each other.
Figure 1
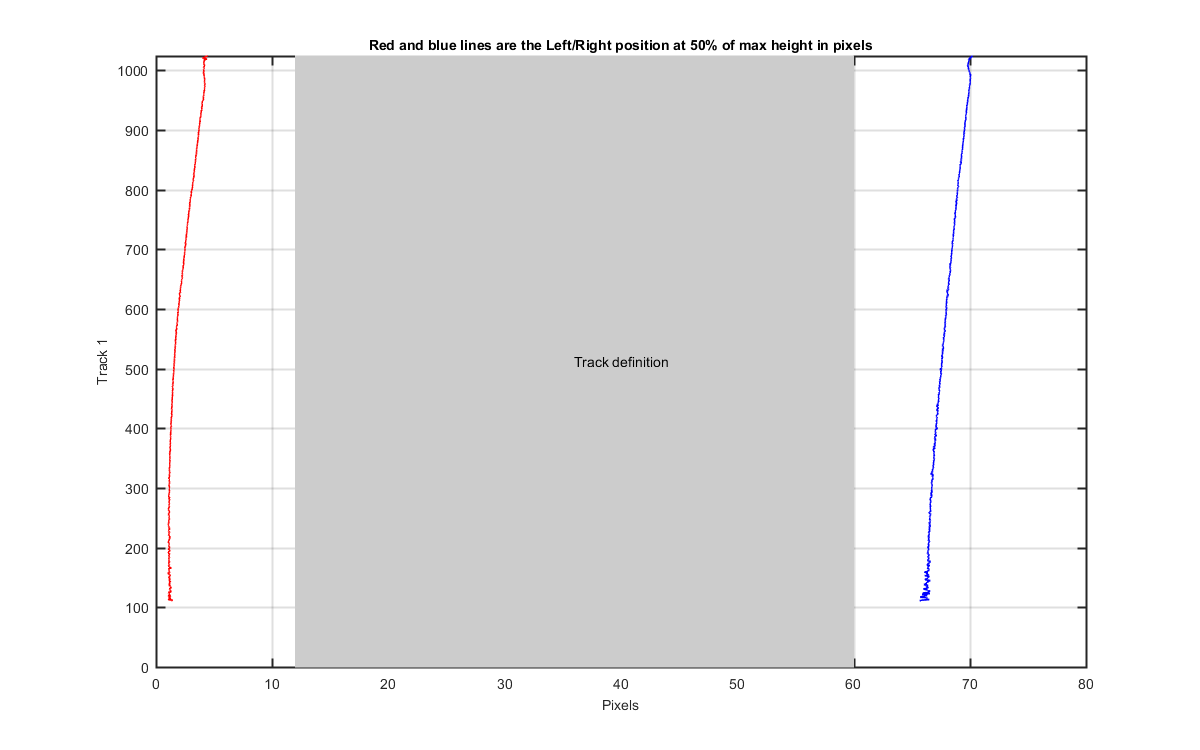
Figure 2
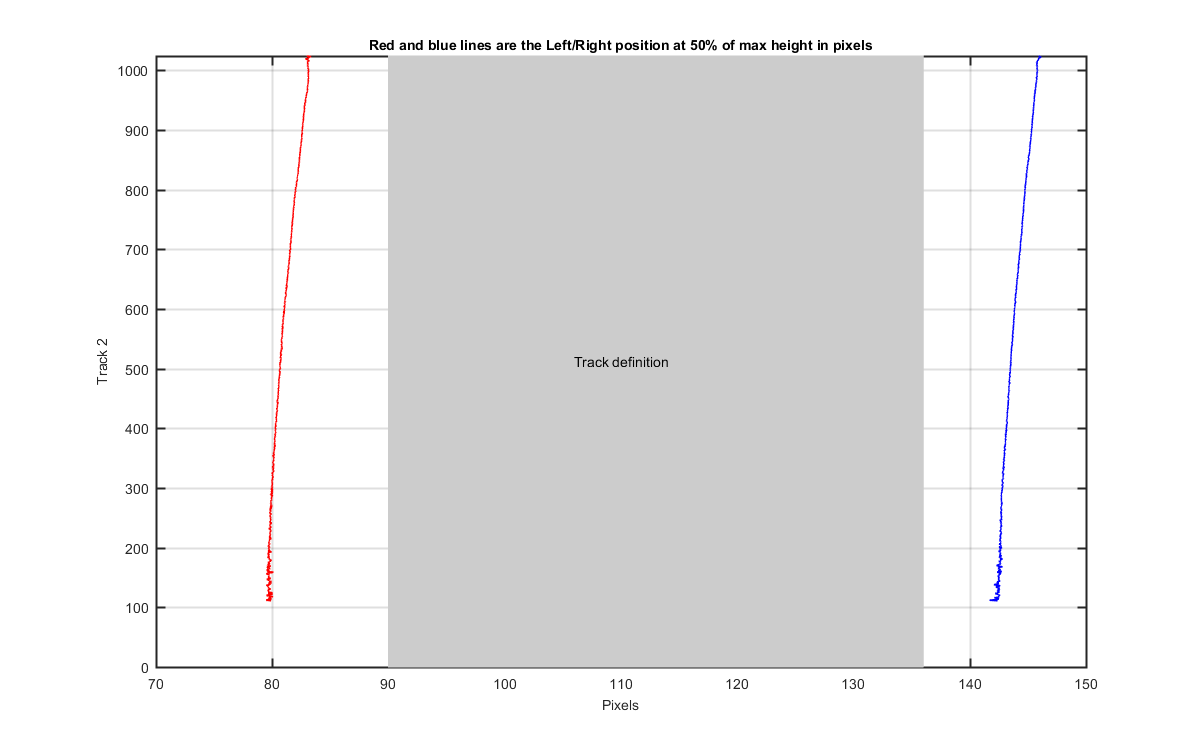
Figure 3
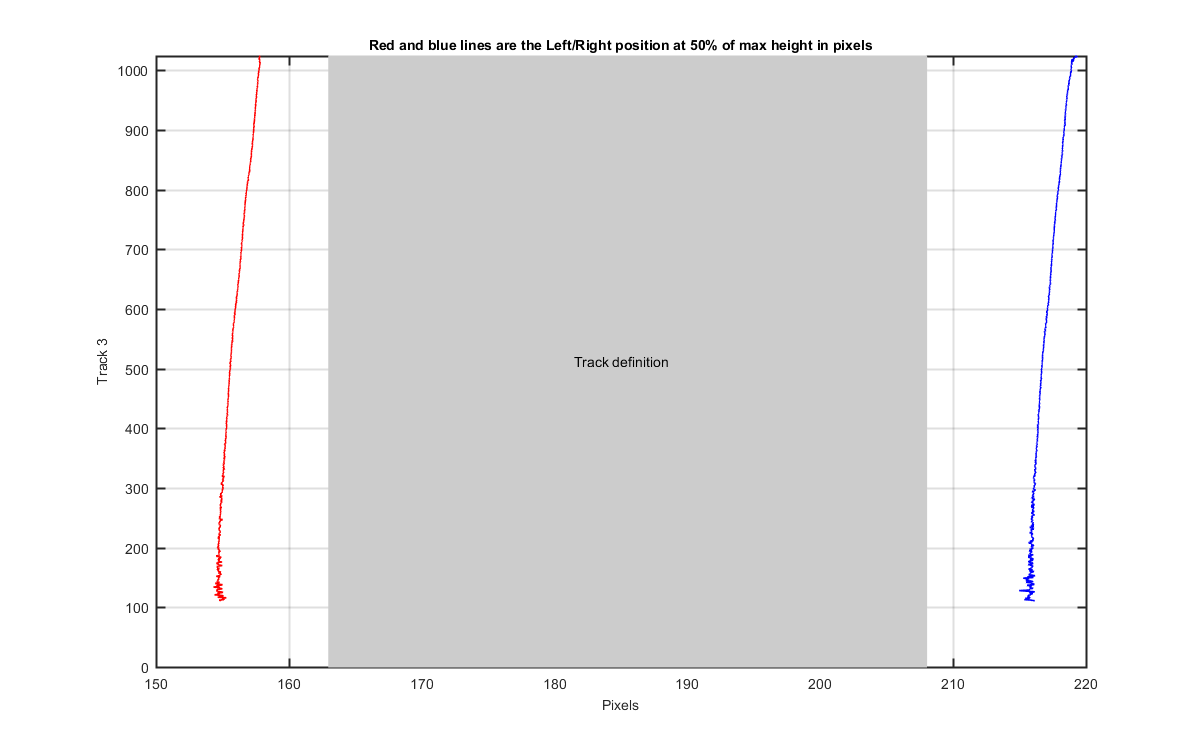
Figure 4
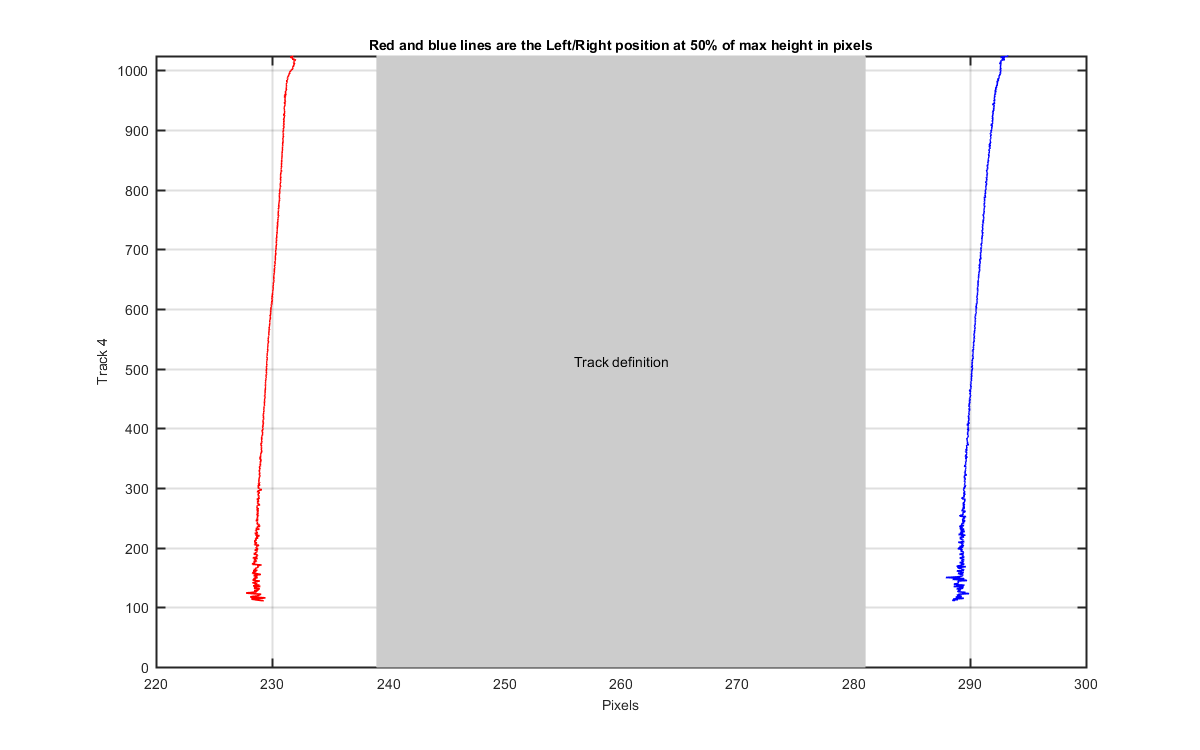
Figure 5
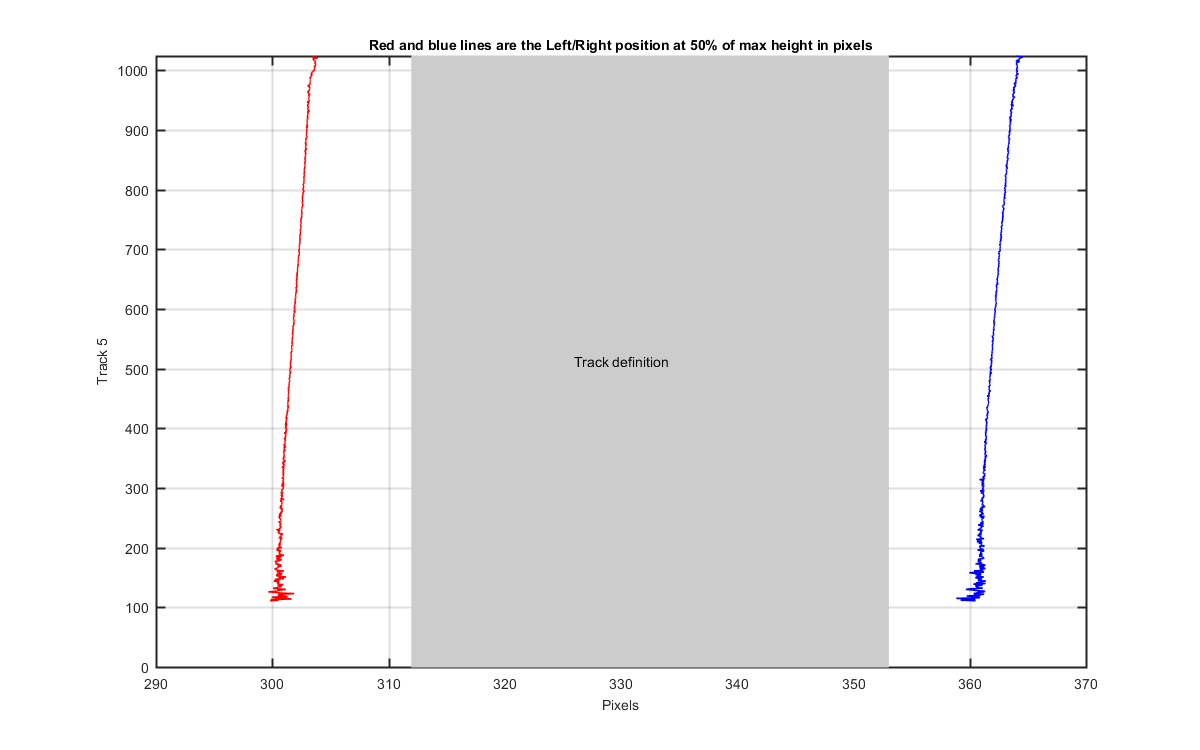
Figure 6
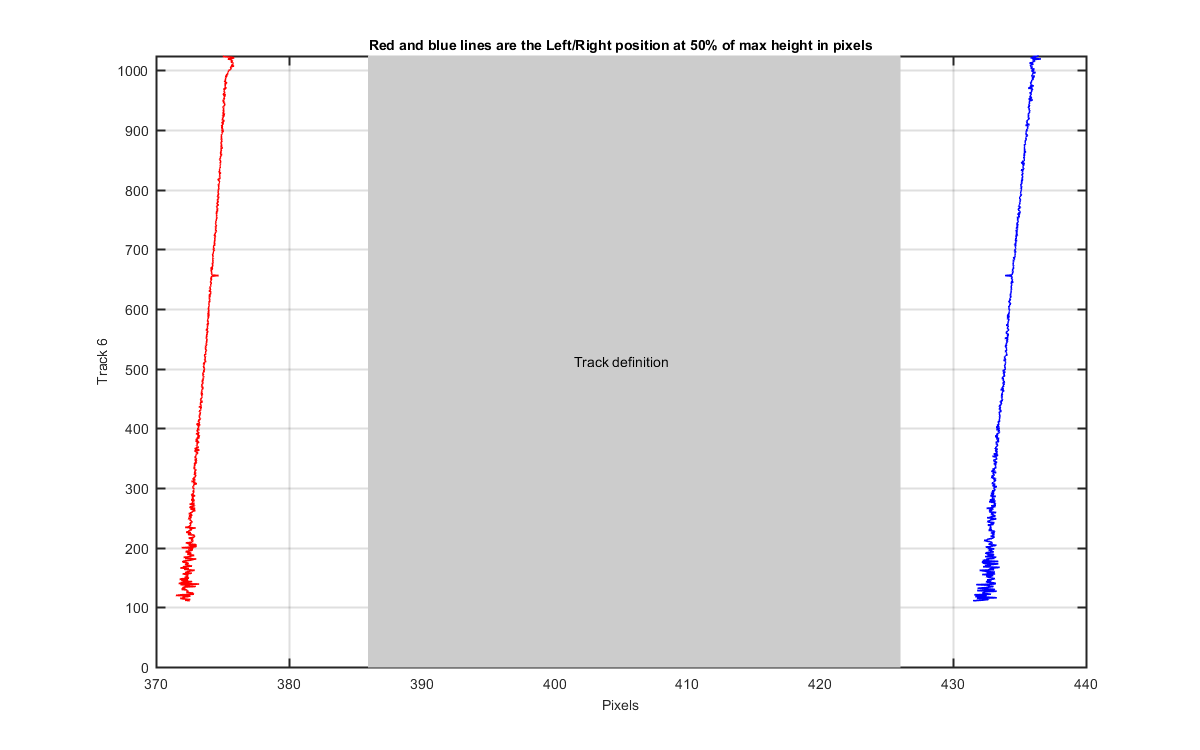
Figure 7
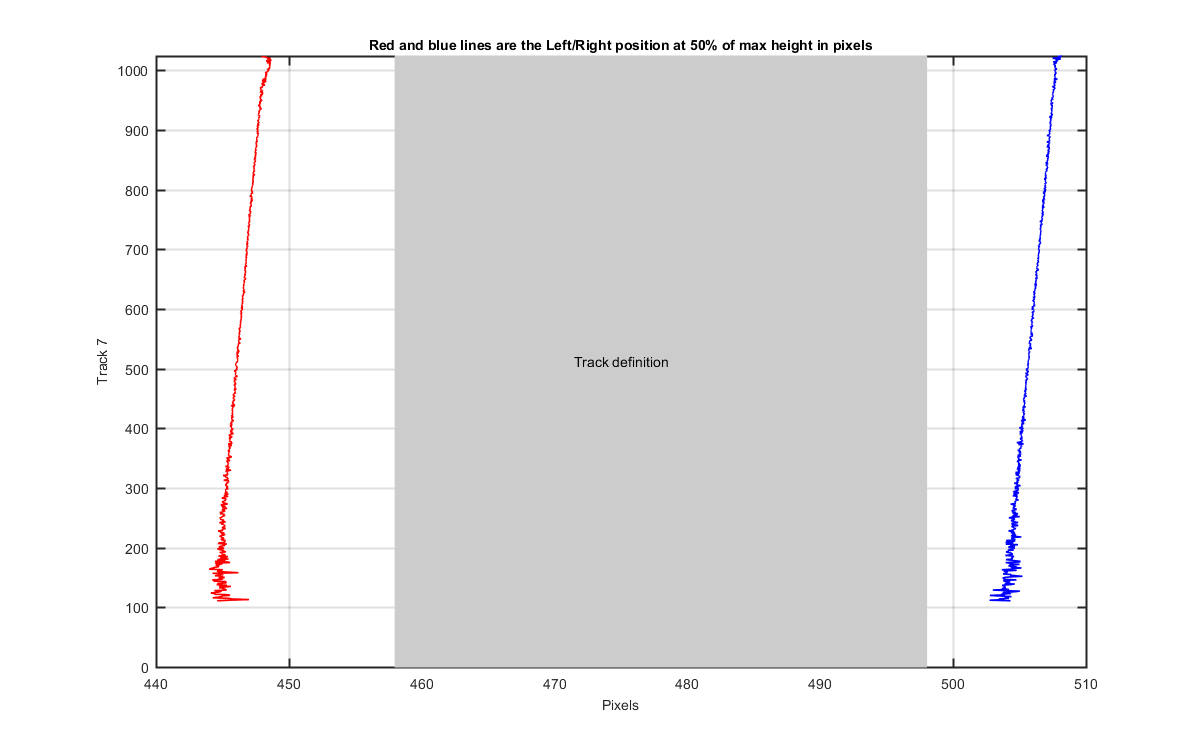
Figure 8
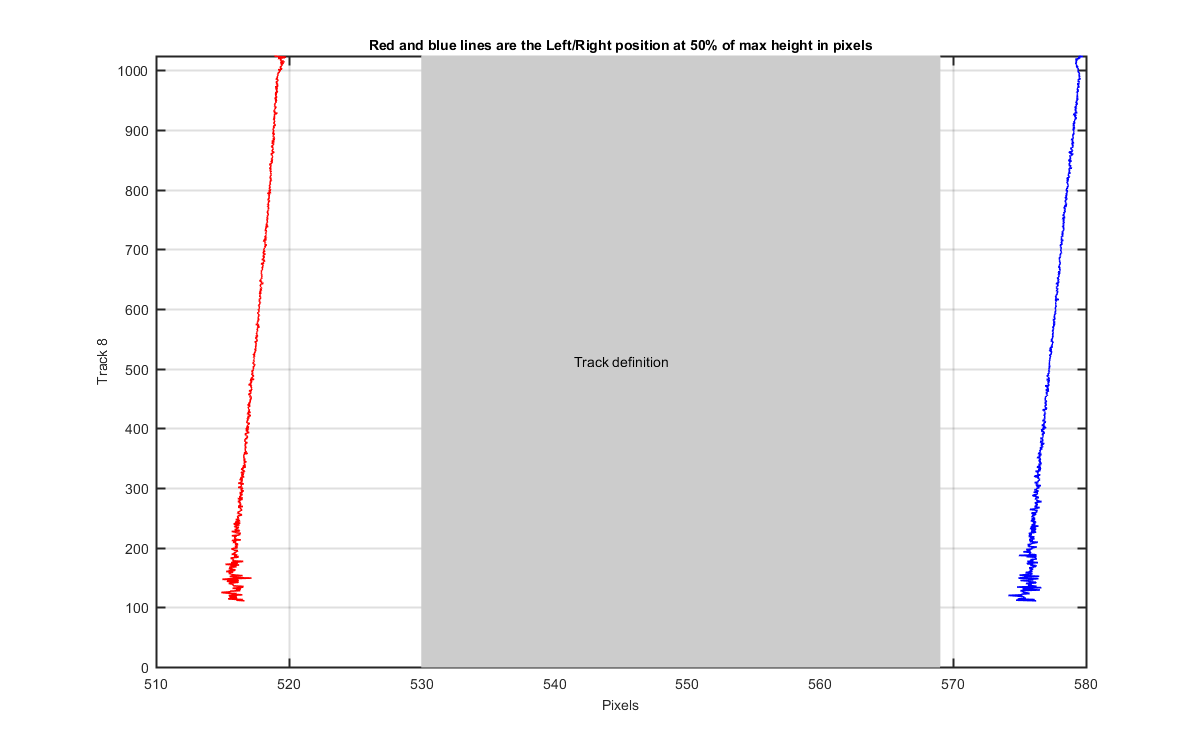
Figure 9
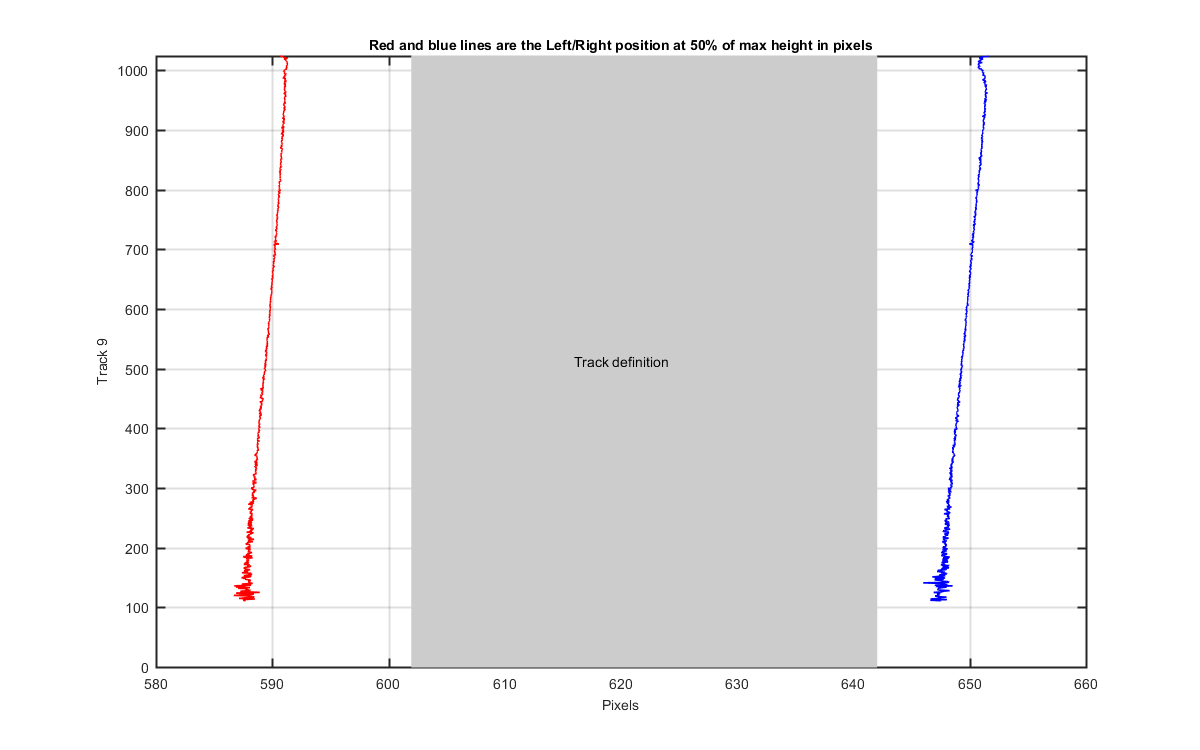
Figure 10
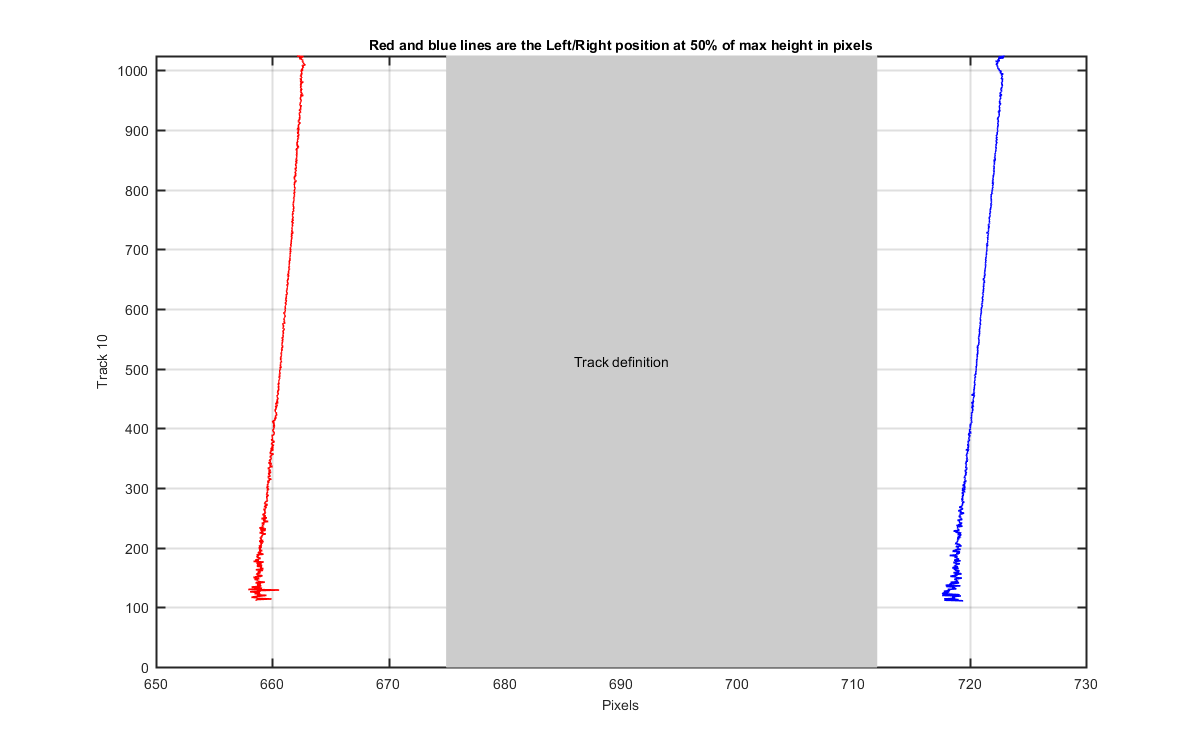
Figure 11
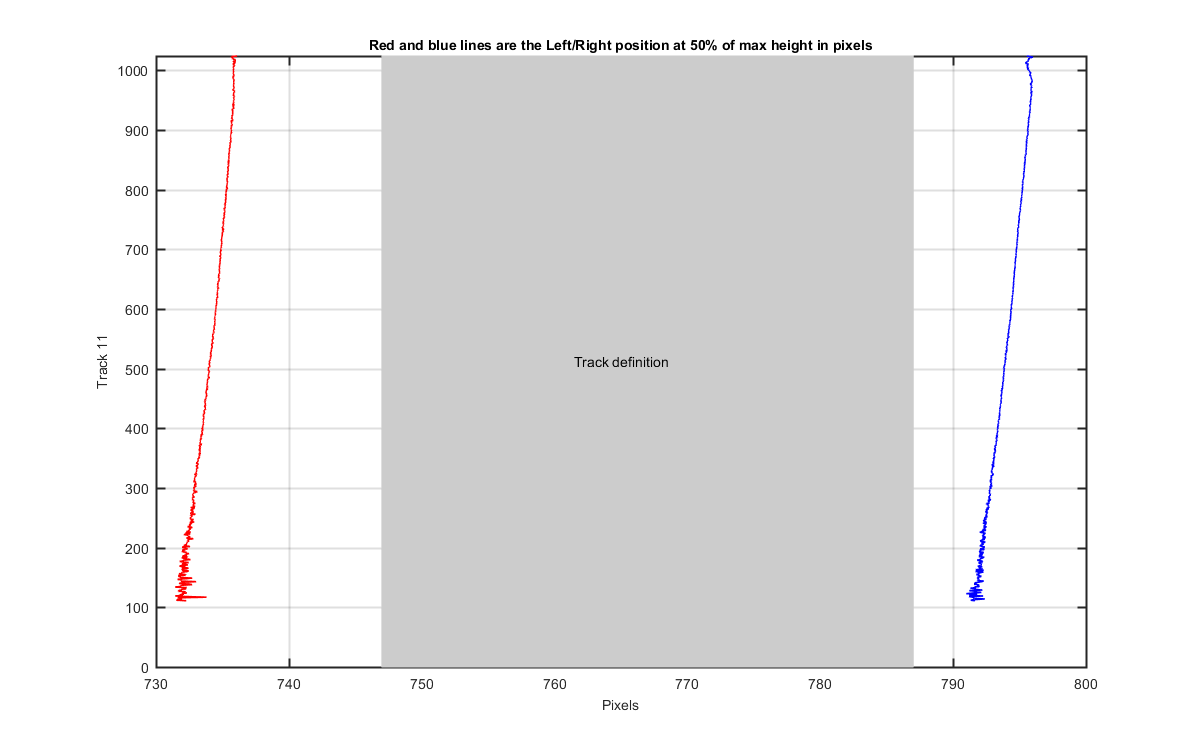
Figure 12
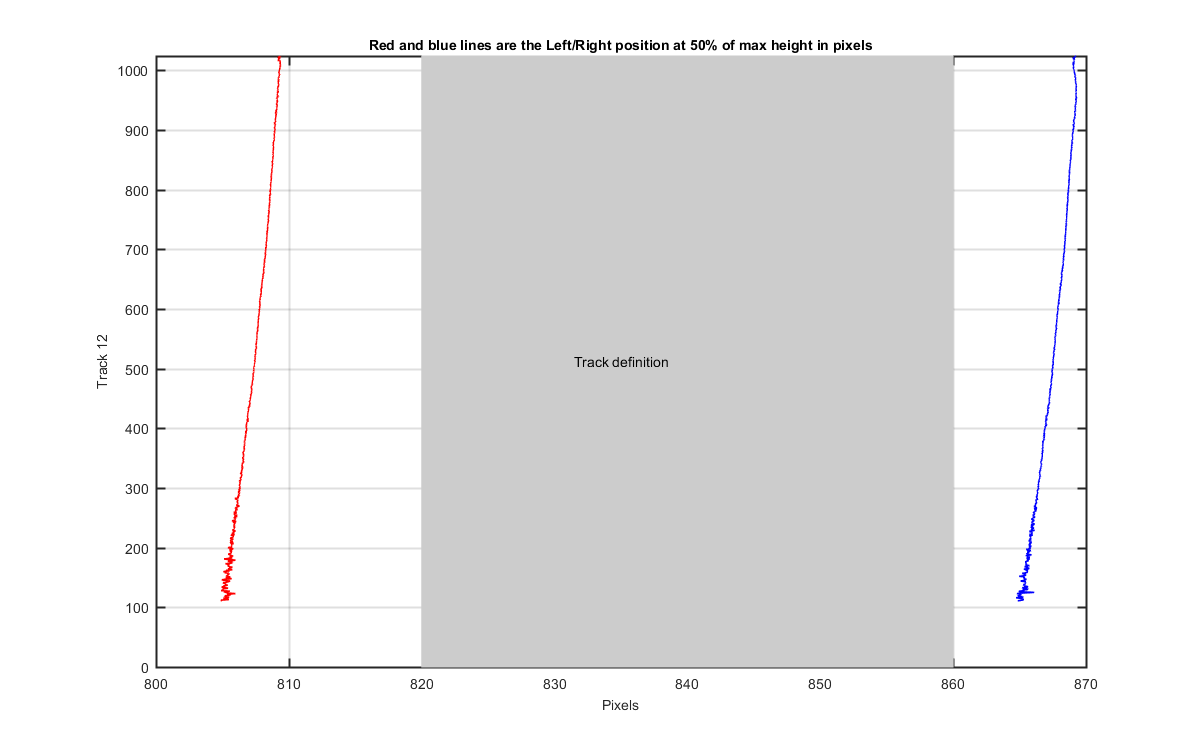
Figure 13
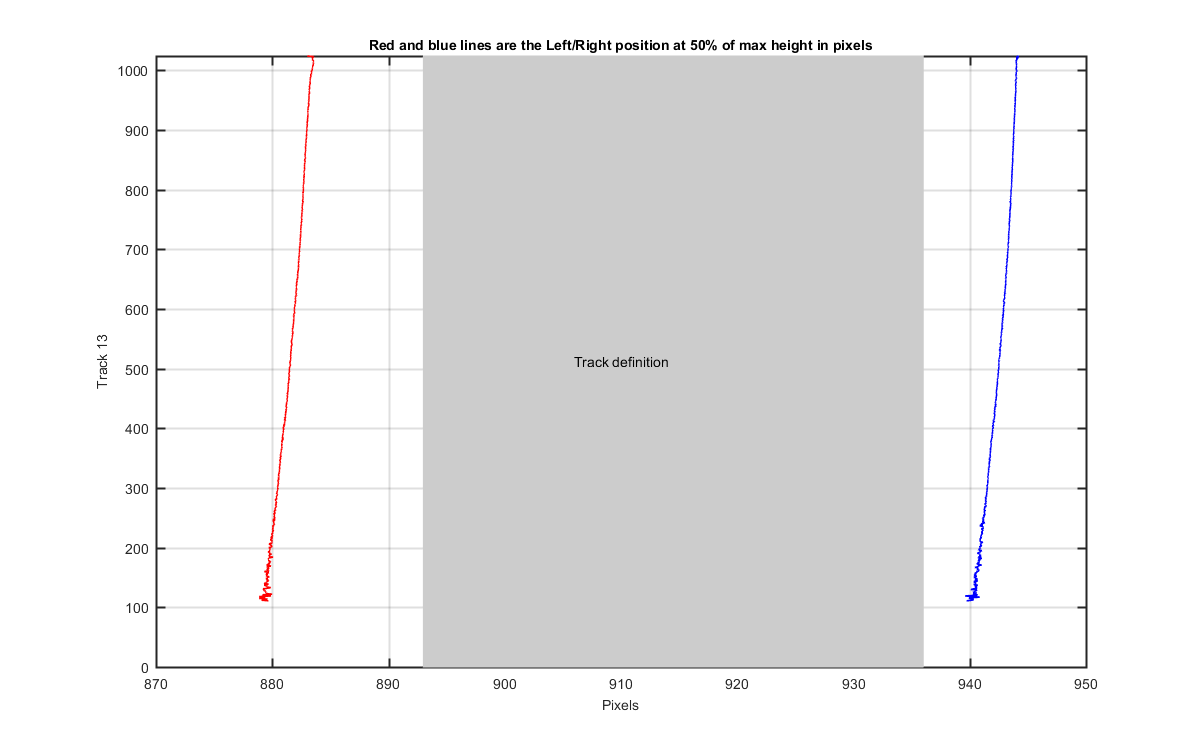
Figure 14
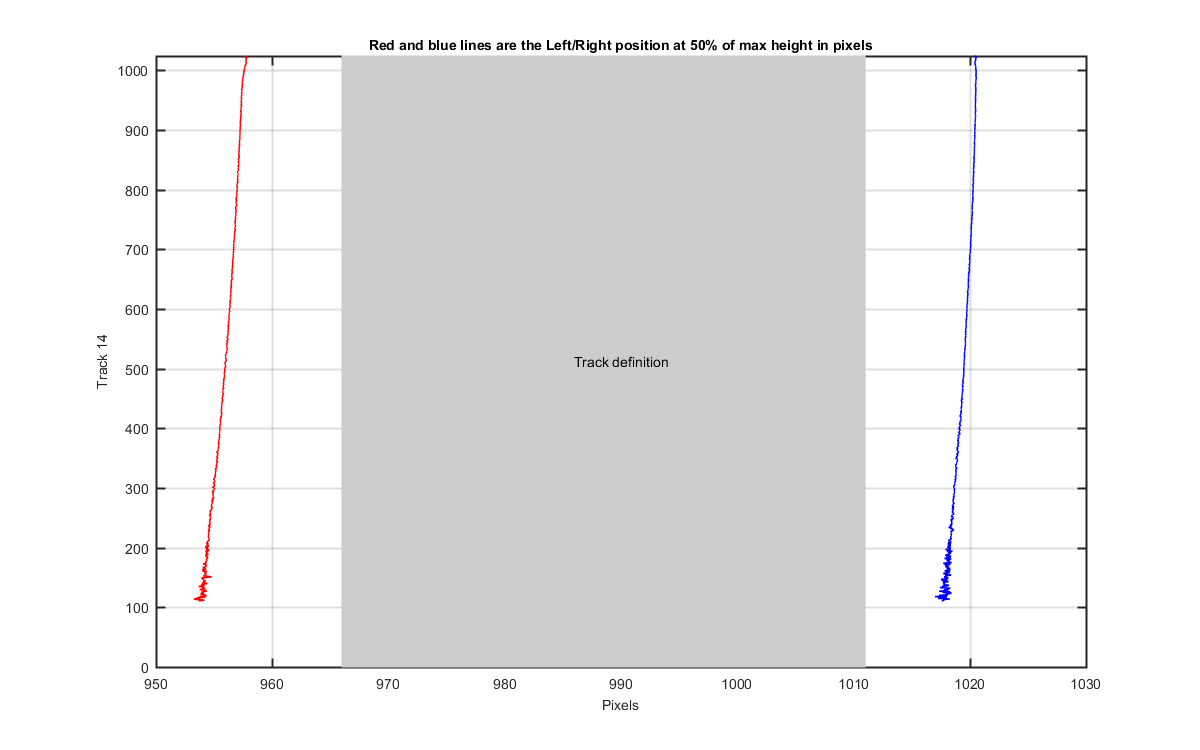
Figure 15