REVISION DATE: 16-Sep-2016 12:35:57
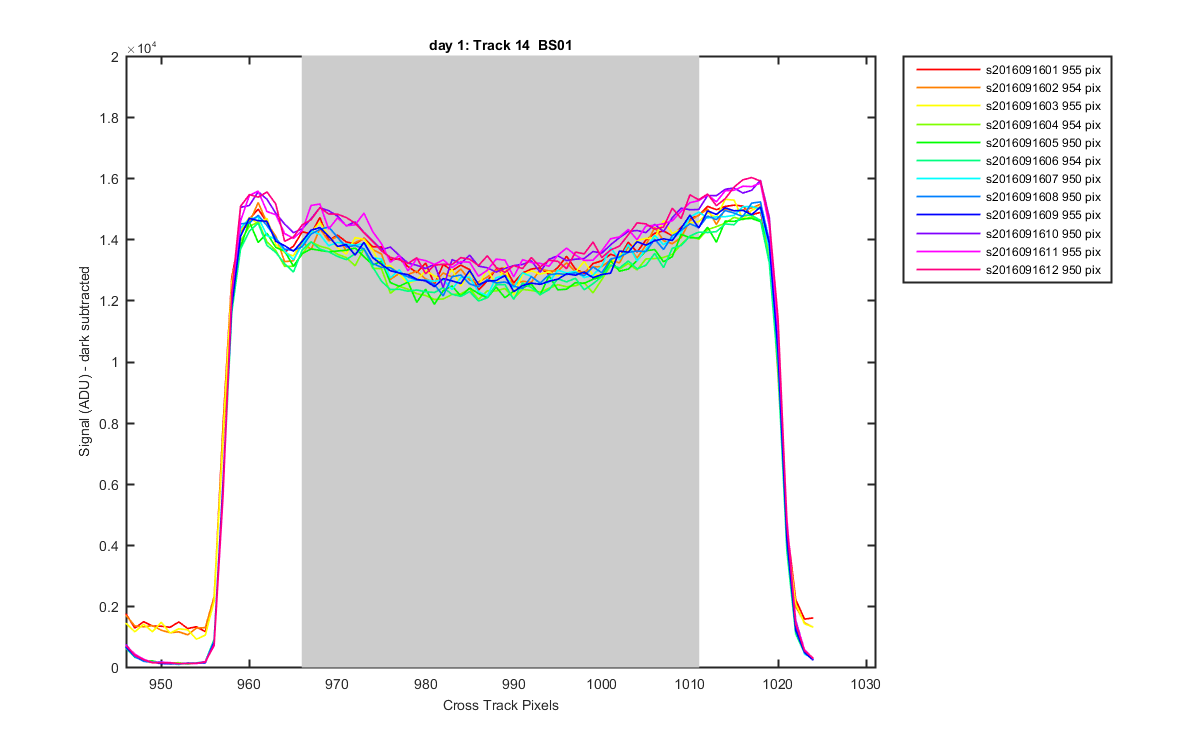
The graphs below show how I defined the tracks. Grey patches are what is averaged for each track. These are created from Oriel data, data sets 1 - 12 (temp control on and off and looking at the lamp). These are the new track definition for BS01cfg005.
Track pixels:
Track:  1       2       3       4       5       6       7       8       9      10      11      12      13      14
Left:   12      90     163     239     312     386     458     530     602     675     747     820     893     966
Right:  60     136     208     281     353     426     498     569     642     712     787     860     936    1011
Figure 1
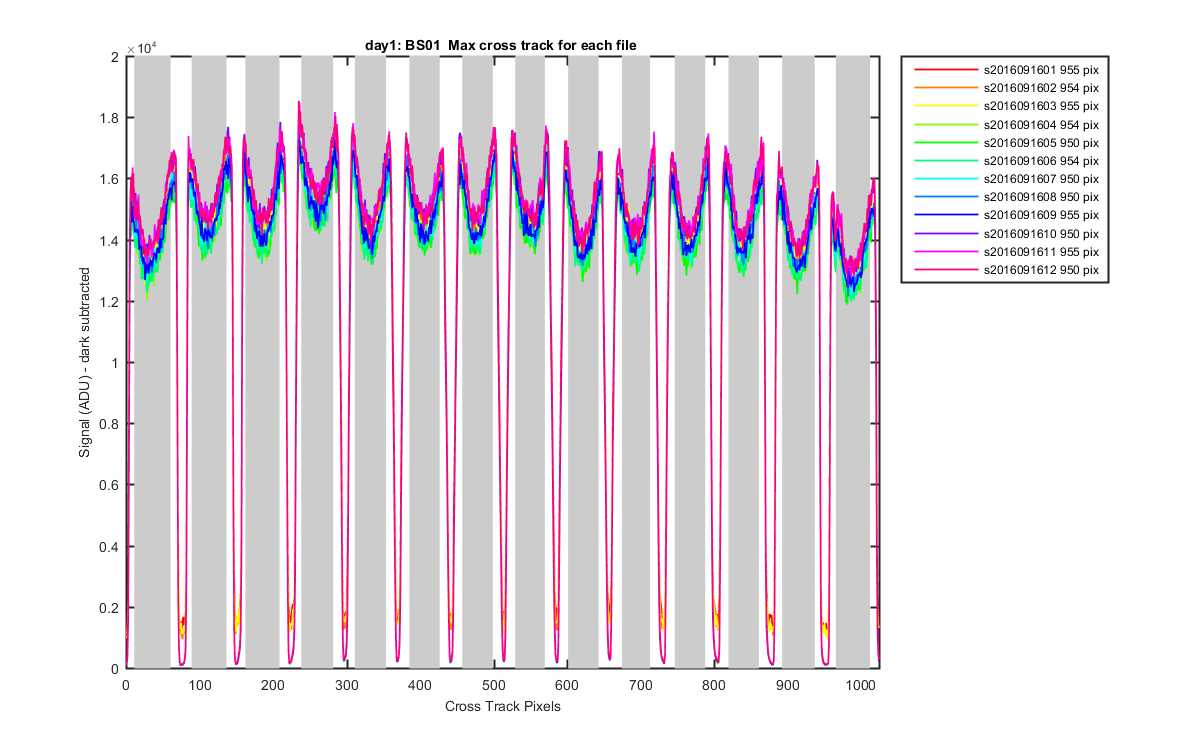
Figure 2
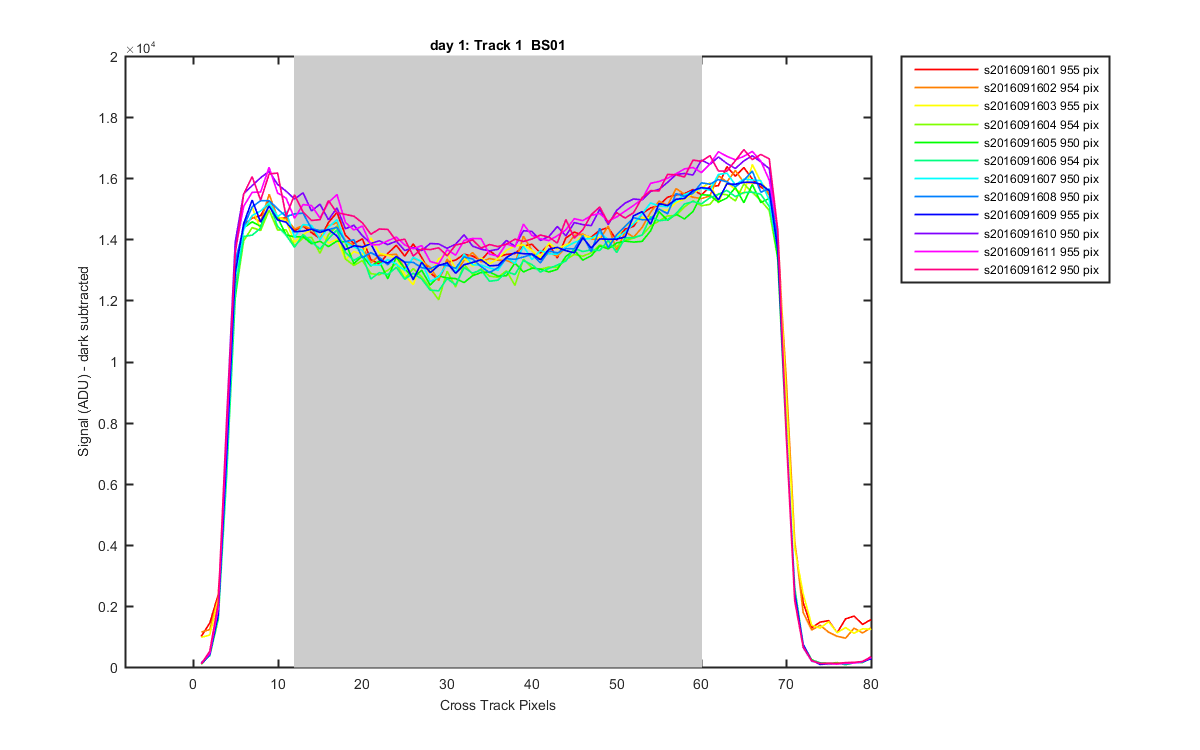
Figure 3
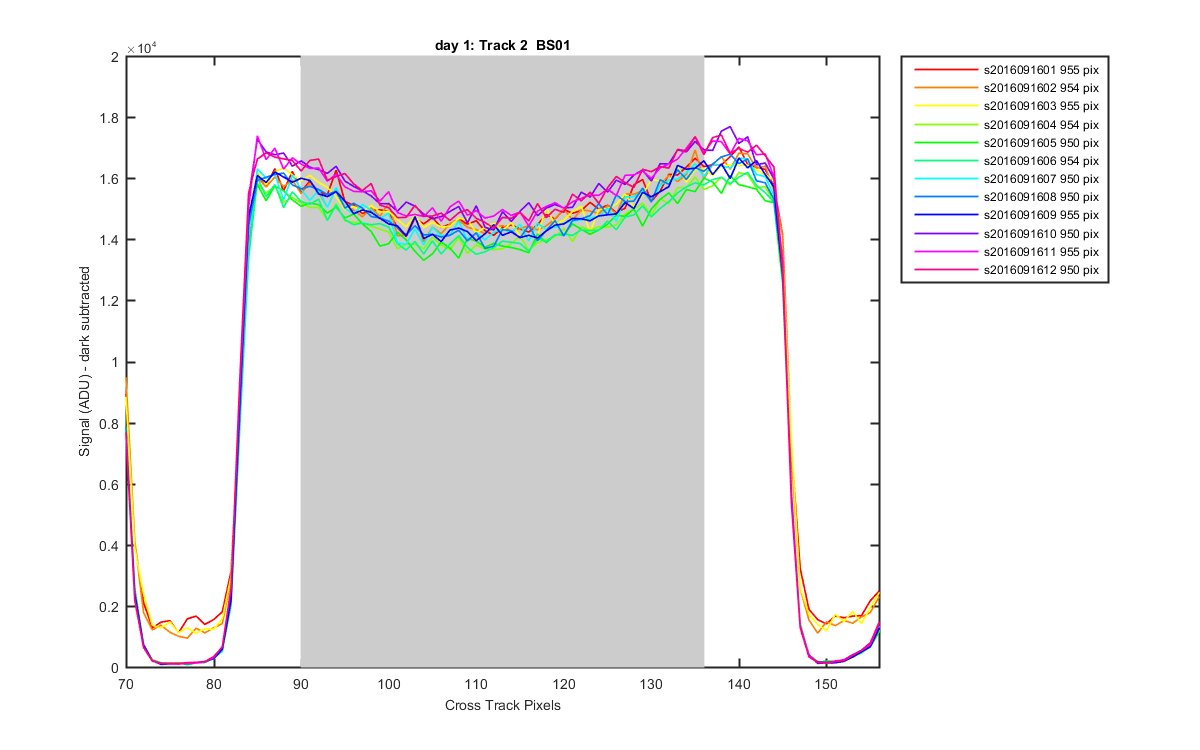
Figure 4
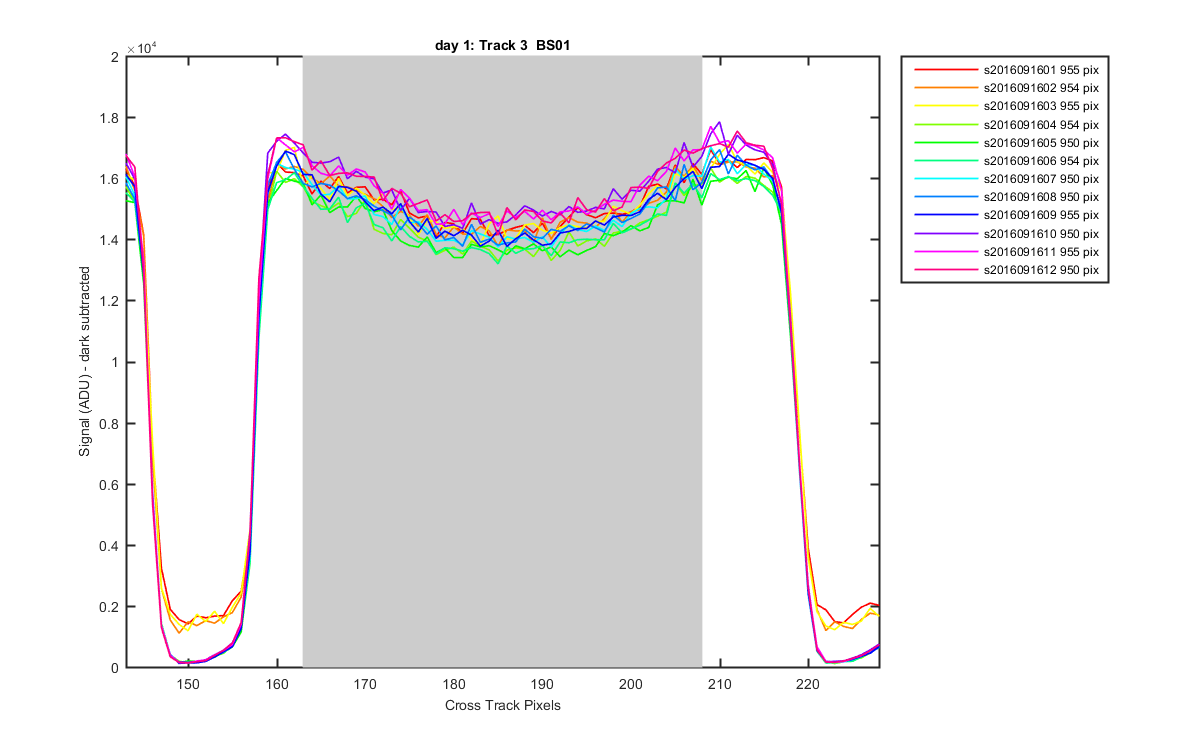
Figure 5
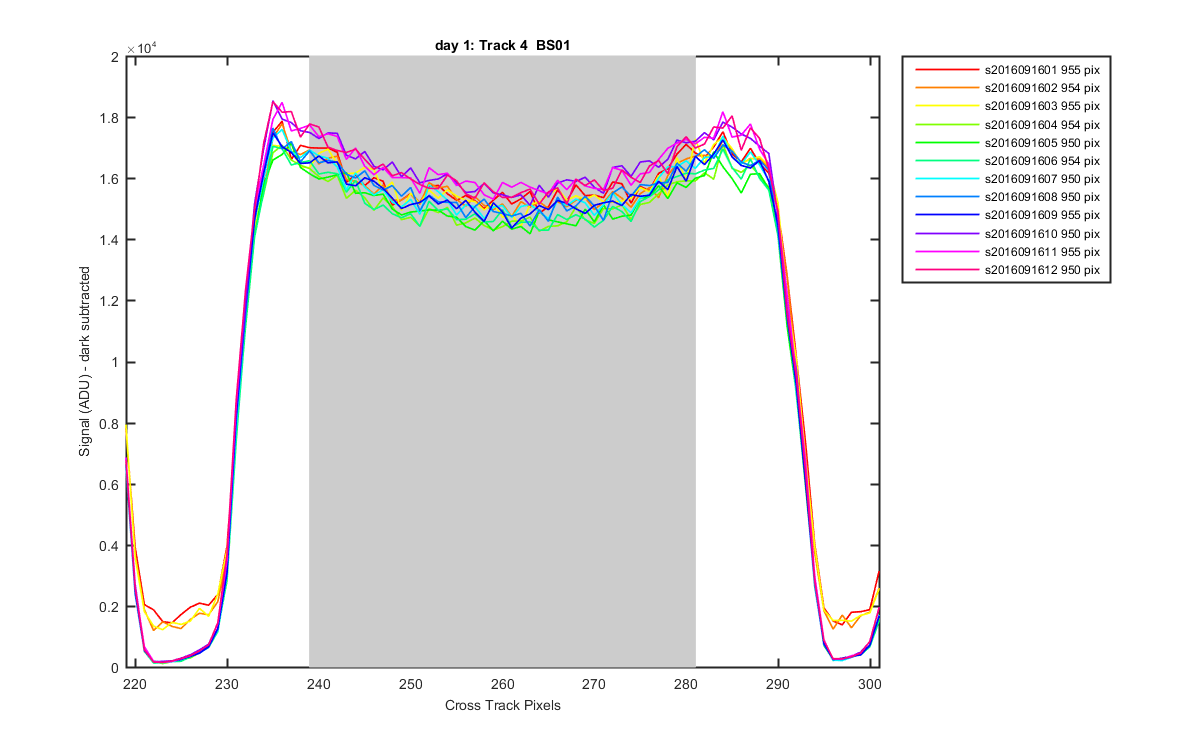
Figure 6
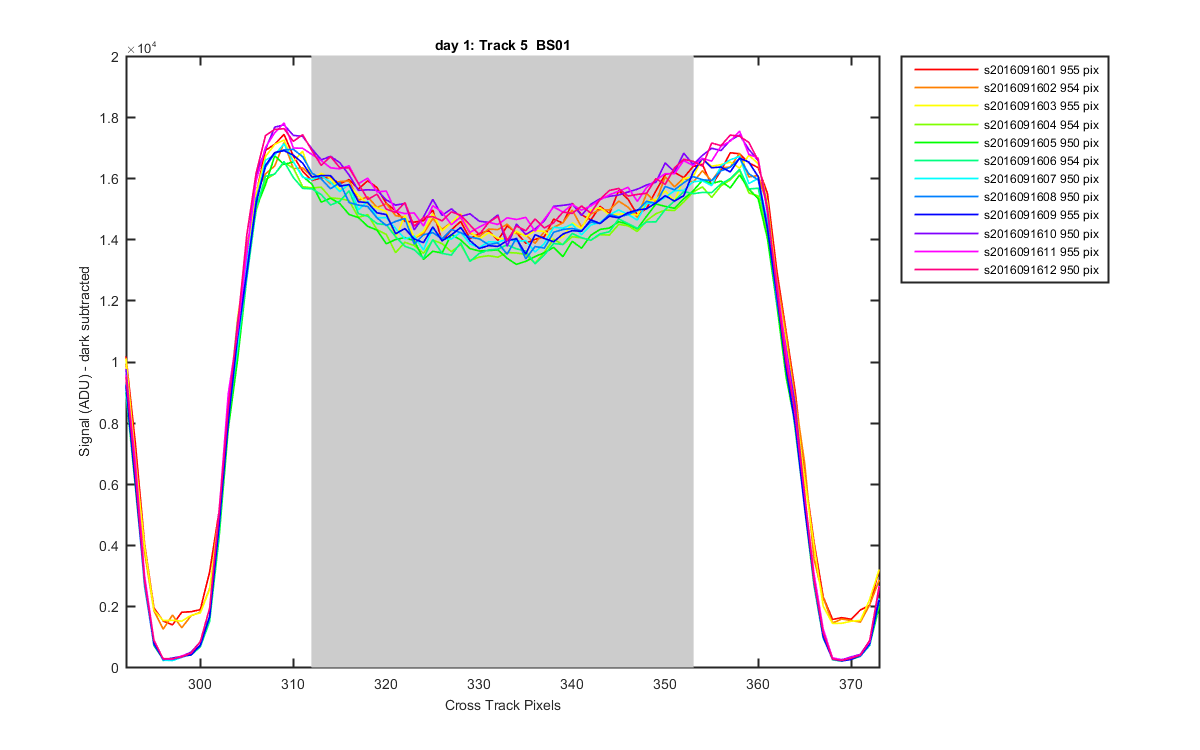
Figure 7
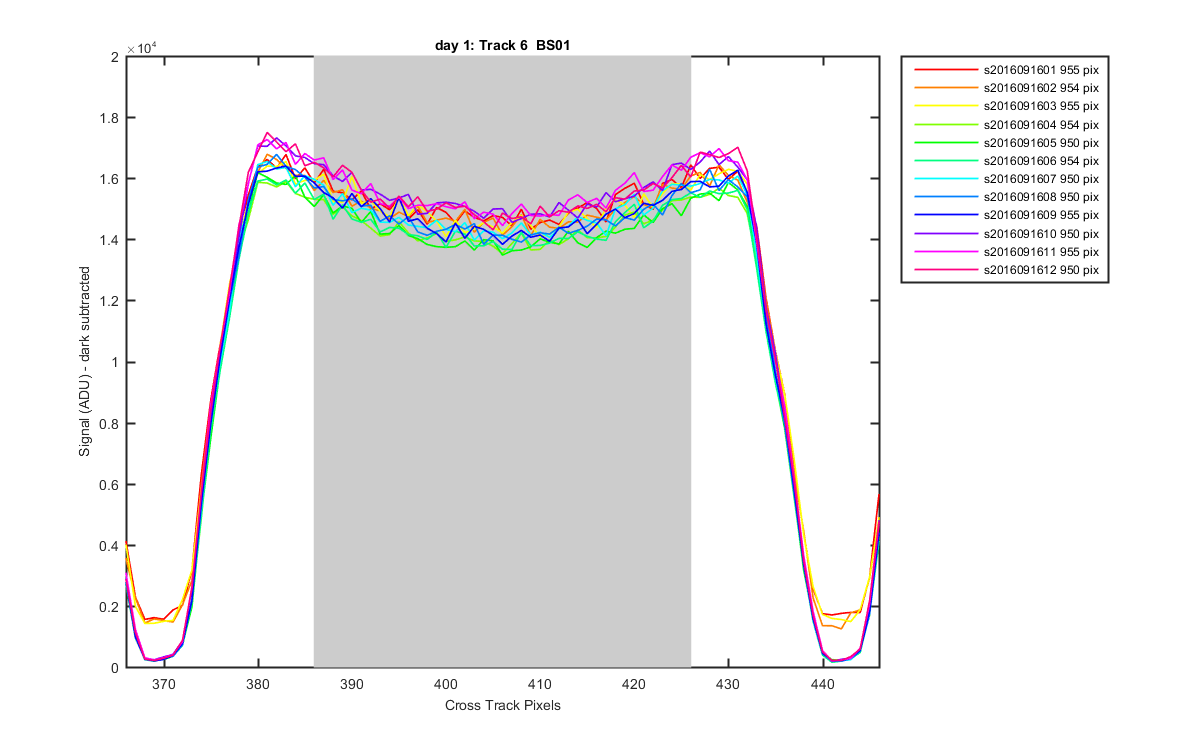
Figure 8
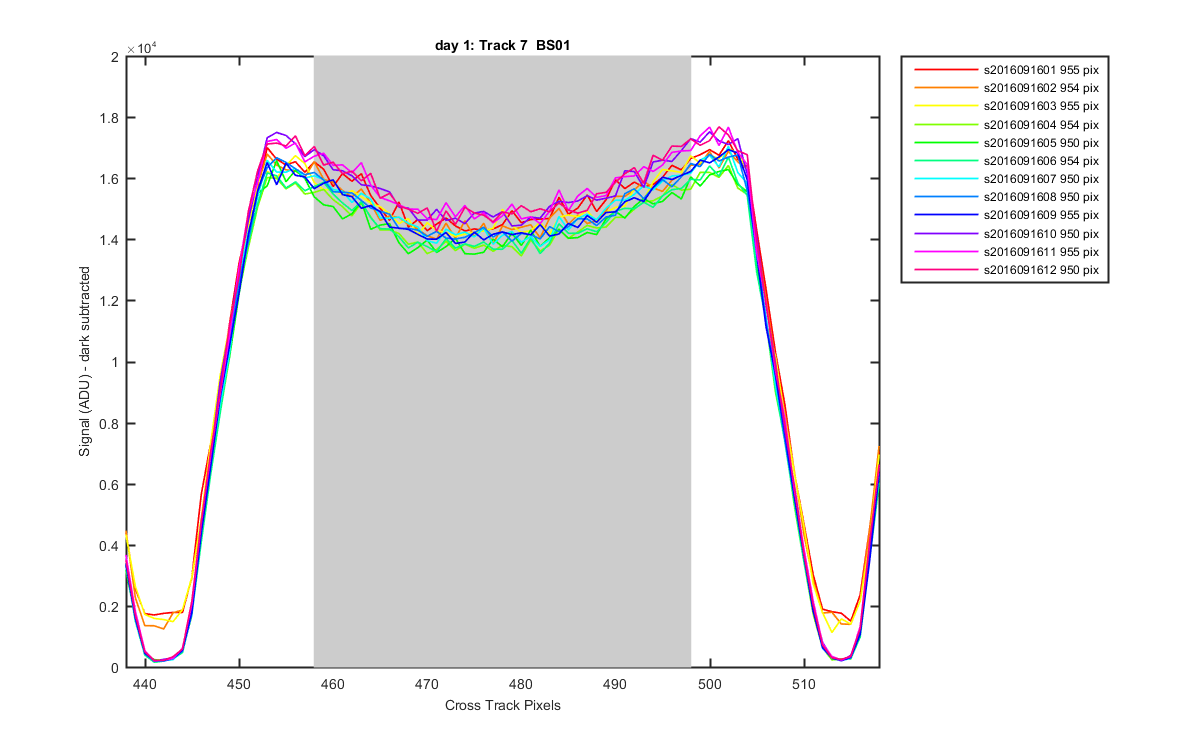
Figure 9
Figure 10
Figure 11
Figure 12
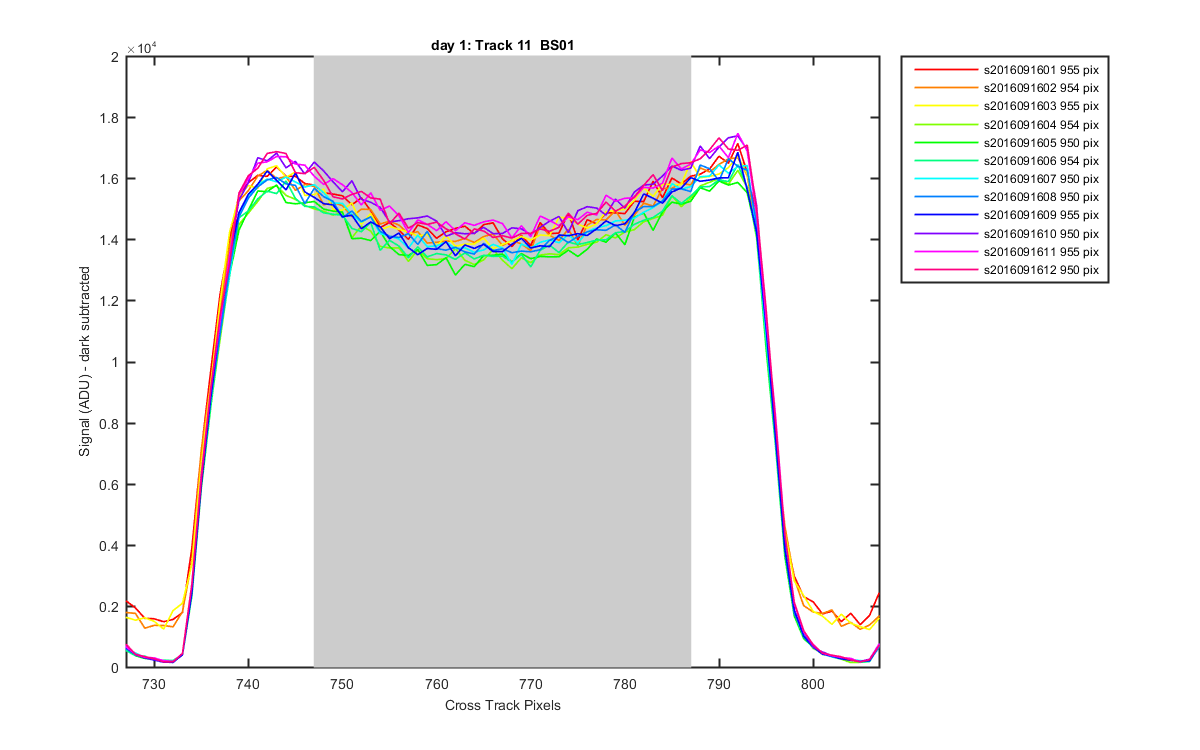
Figure 13
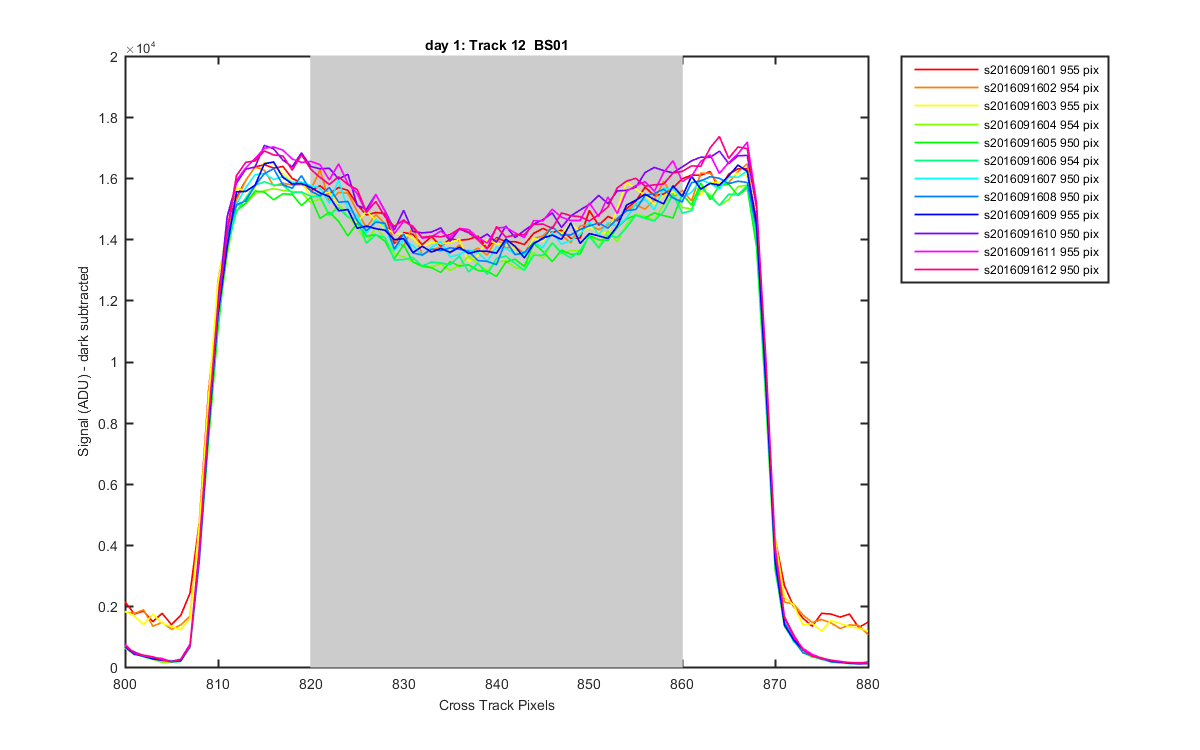
Figure 14
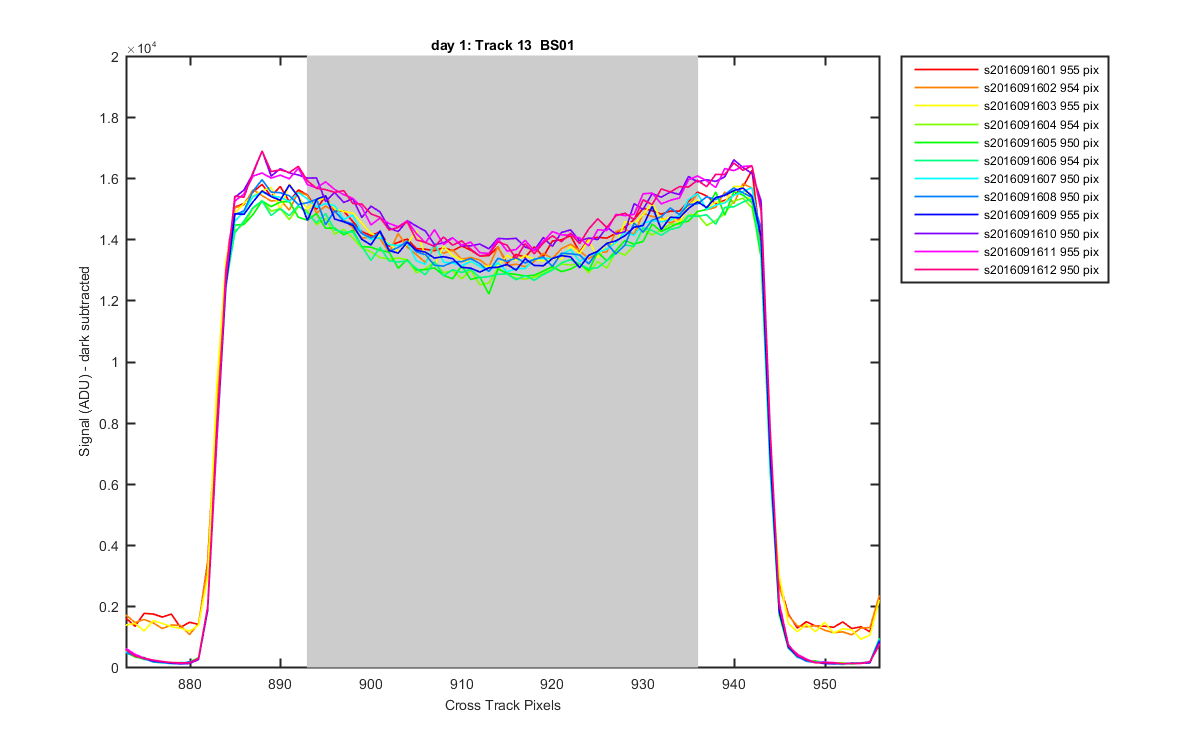
Figure 15