REVISION DATE: 31-Oct-2017 11:48:04
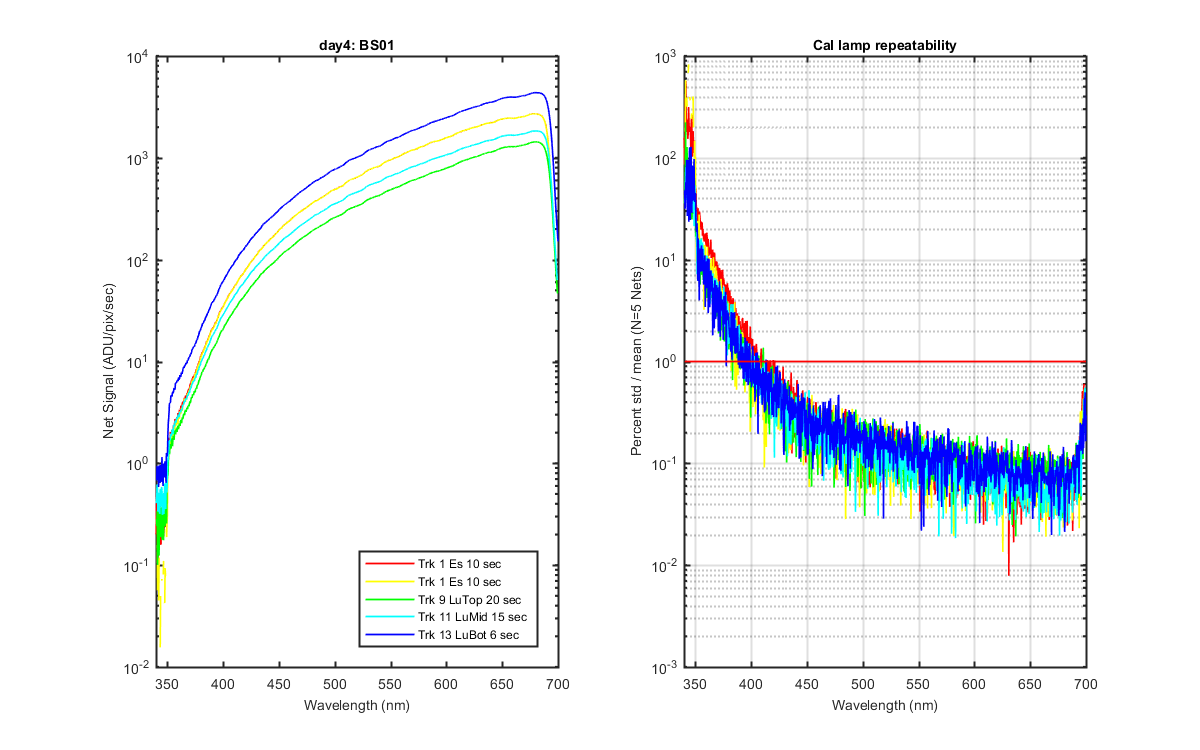
Heres one suggestion for graphs: could you please plot the repeatability over the 5x net-sig scans for the Es & Lu cals? Maybe a percent std / mean would be a nice way to look at that...
Below are the percent standard deviation over the Net Es and Lu data. Also a graph showing the percent standard deviation of the 5 nets from each track.
Figure 1
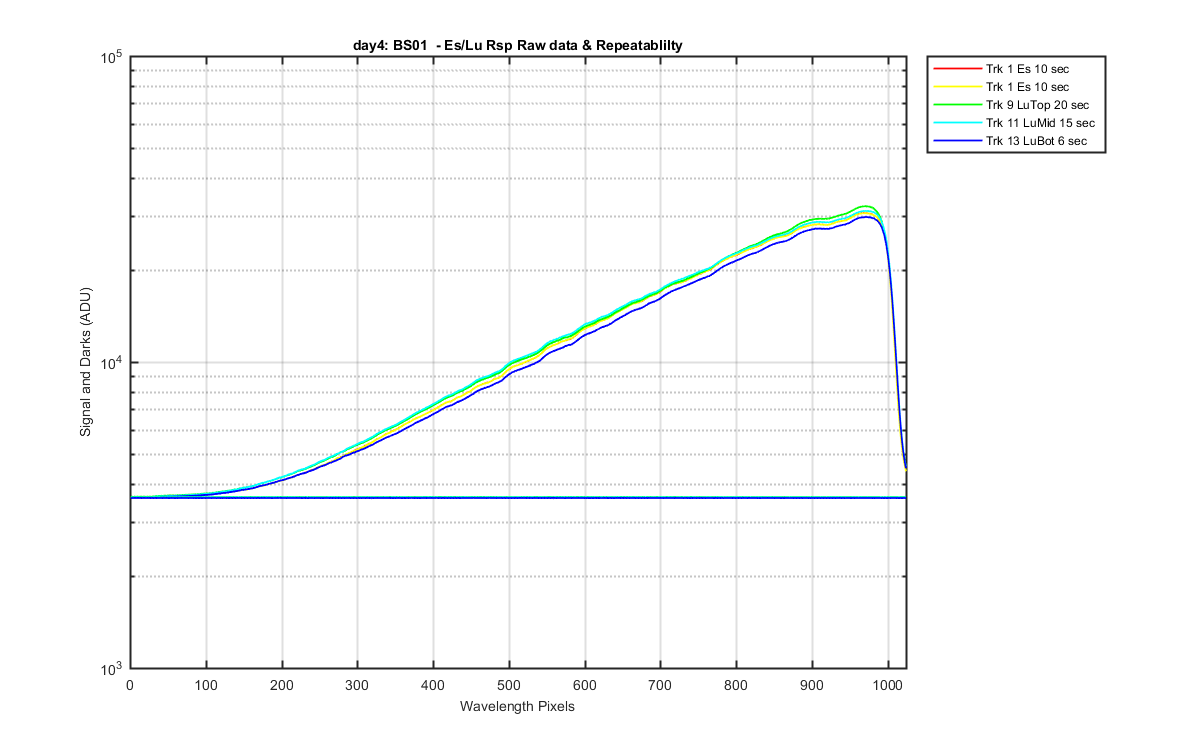
Figure 2
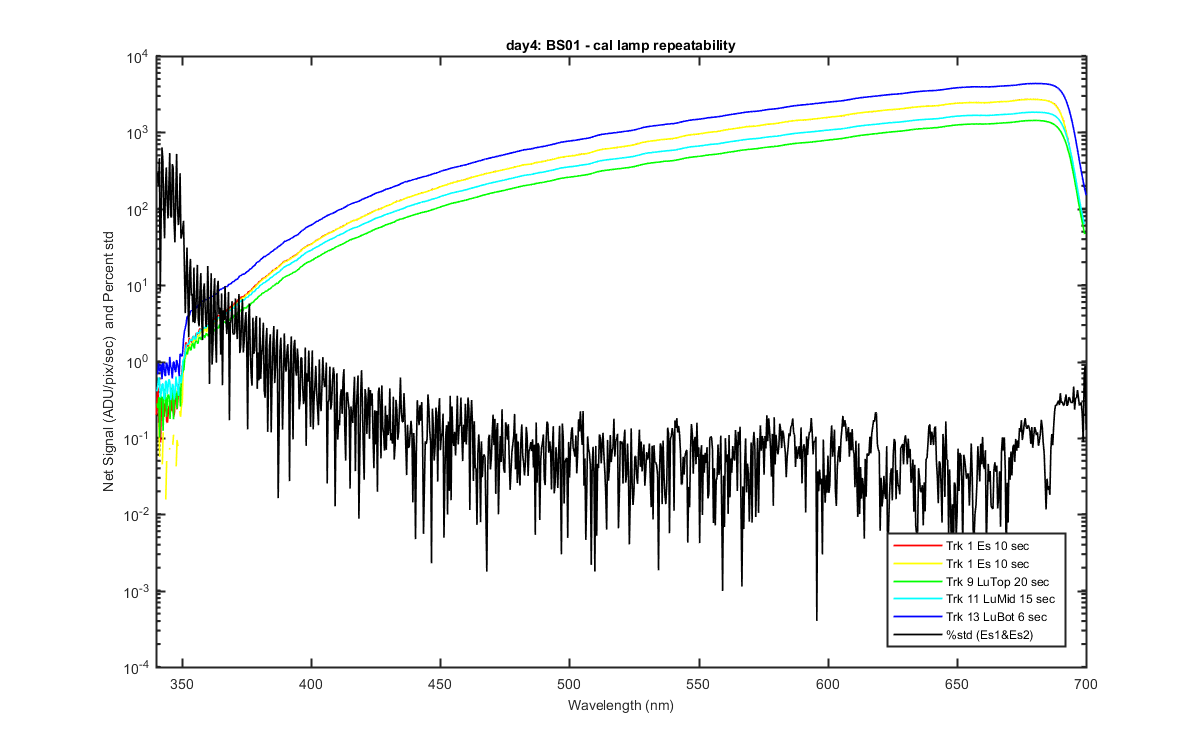
Figure 3