REVISION DATE: 14-Feb-2017 17:12:38
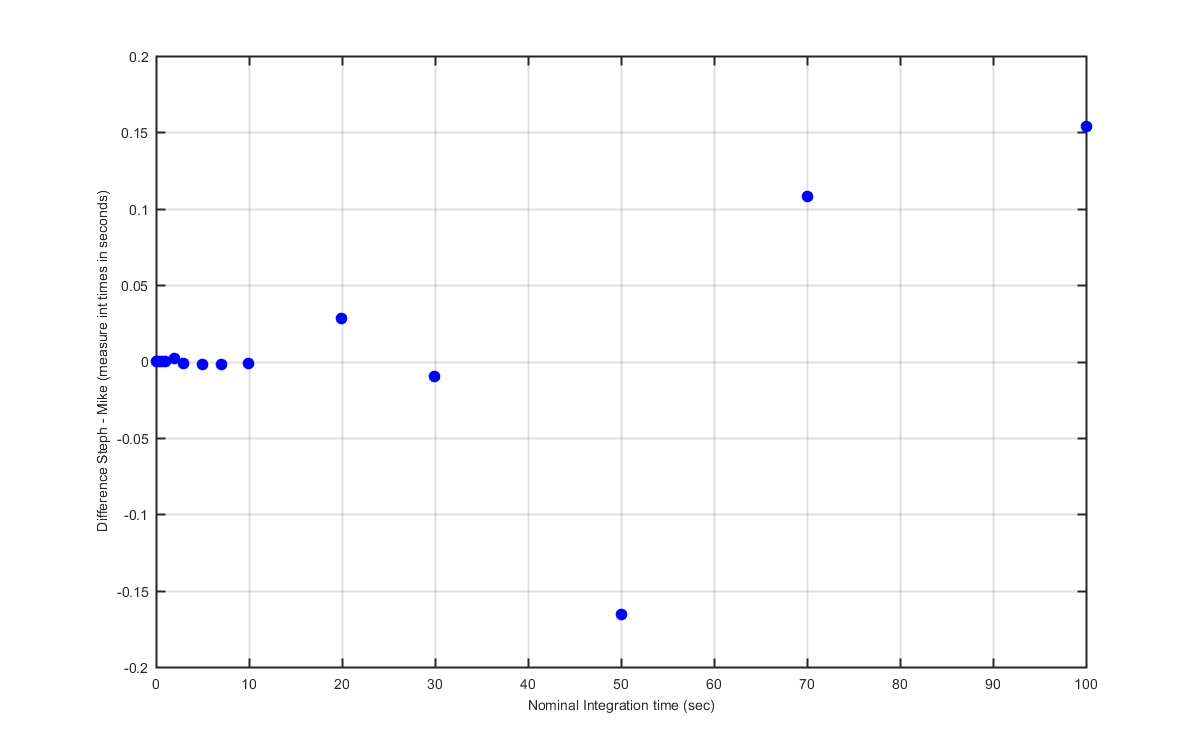
Mike did a quick exposure time cal. Using Mike detailed email and the int cal from Hawaii-2016-01 day 7 I calculated a calibrated integration times. My method differed from Mikes in that I meaned all the 1 sec and 10 sec data so I normalized by the mean a 1 sec etc. See explainations below for more details about each step. Note: Data are in ADU/pix (the per pixel is because this is a track mean). They are all NET signals (lite - backgrounds)
| Nominal (sec) | Measred (sec) |
|---|---|
| 0.0500 | 0.0942 |
| 0.0700 | 0.1134 |
| 0.1000 | 0.1417 |
| 0.2000 | 0.2368 |
| 0.3000 | 0.3319 |
| 0.5000 | 0.5220 |
| 0.7000 | 0.7124 |
| 1.0000 | 1.0000 |
| 2.0000 | 1.9547 |
| 3.0000 | 2.9124 |
| 5.0000 | 4.8316 |
| 7.0000 | 6.7544 |
| 10.0000 | 9.6523 |
| 20.0000 | 19.2687 |
| 30.0000 | 28.8991 |
| 50.0000 | 48.2376 |
| 70.0000 | 67.6405 |
| 100.0000 | 96.8542 |
% File: \data\2017\HI-2017-01\BS01data\ascii_out\BS01_exptimecal(rev13Feb2017).txt
% Date: 13-Feb-2017;  by: MF/MLML
% What: 12-Feb-2017 pre-MOBY262 BS01cfg007 LuBot Exposure Time Calibration via OL455-18U
%
% Contents:
% Column 1 = Nominal Exposure Time (sec)
% Column 2 = Calibrated Exposure Time (sec)
% Column 3 = Approximate Uncertainty in Calibrated Exposure Time (sec)
%
 0.05    0.09427829  0.0009690218
 0.07    0.1134268  0.0009694974
 0.1     0.1417515   0.001114091
 0.2     0.2368882    0.00125844
 0.3     0.3319896   0.001251888
 0.5      0.522174   0.001540753
 0.7     0.7121558   0.001661241
   1             1             0
   2      1.952422    0.01245284
   3      2.913429    0.01624143
   5      4.833348    0.02705334
   7      6.756649    0.04205685
  10      9.653902    0.06396895
  20      19.24042     0.2279321
  30      28.90868     0.2824454
  50      48.40306     0.4149921
  70      67.53256     0.7713569
 100      96.70038      1.200514
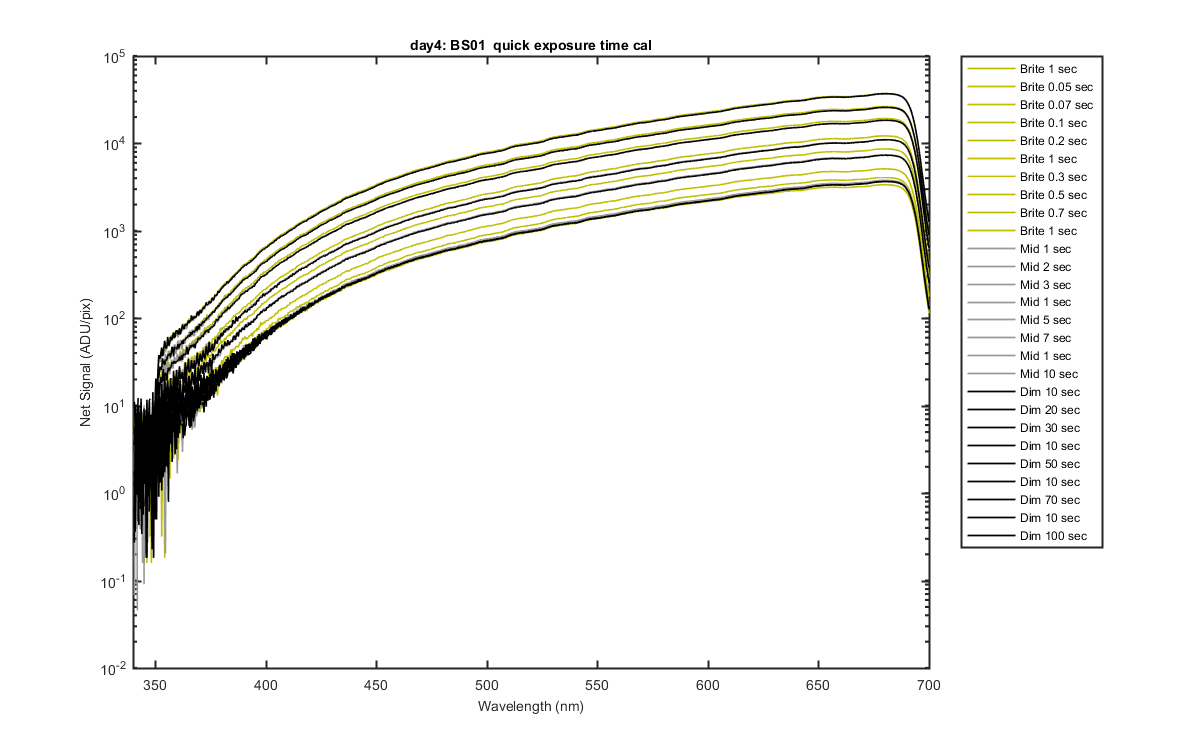
The data where collected a three different lamp levels ("Brite", "Mid", and "Dim") to be able to get a full range of integration times. You can see all the levels here.
Figure 1
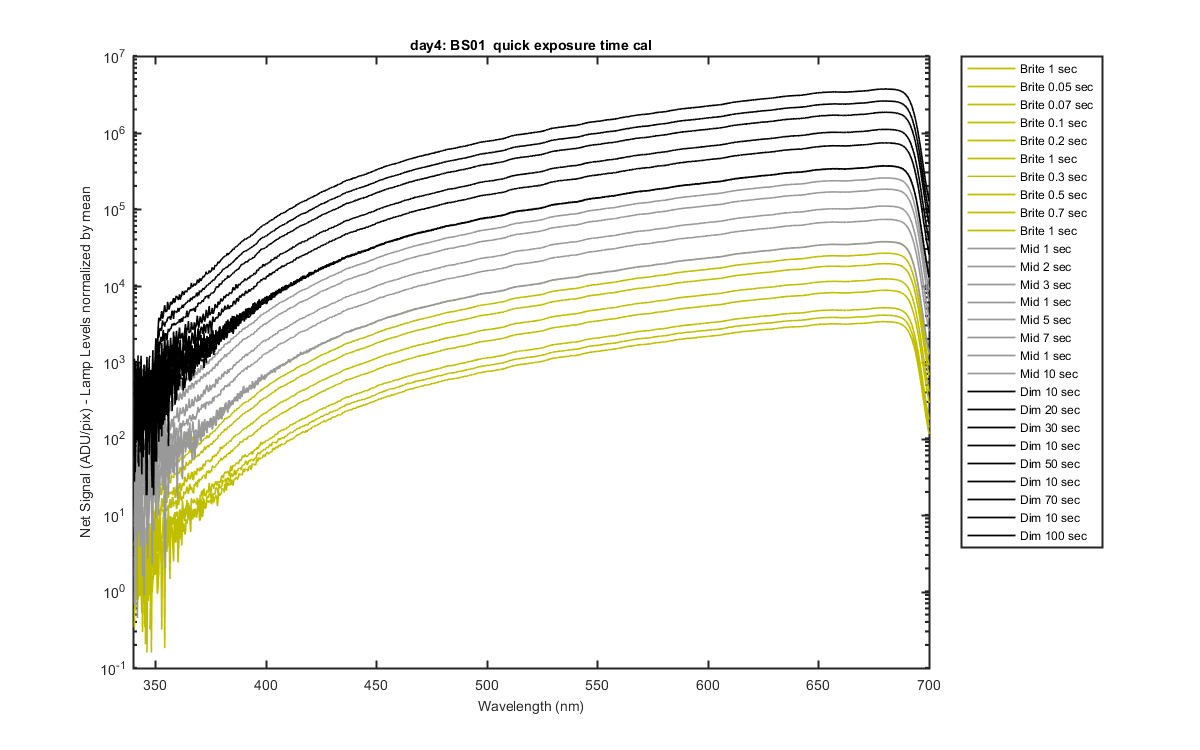
Track 13 data normalized using the step down ratios. So the 1 sec repeats from Bright to Mid and the 10 sec repeats from Mid to Dim plot on top of each other.
Figure 2
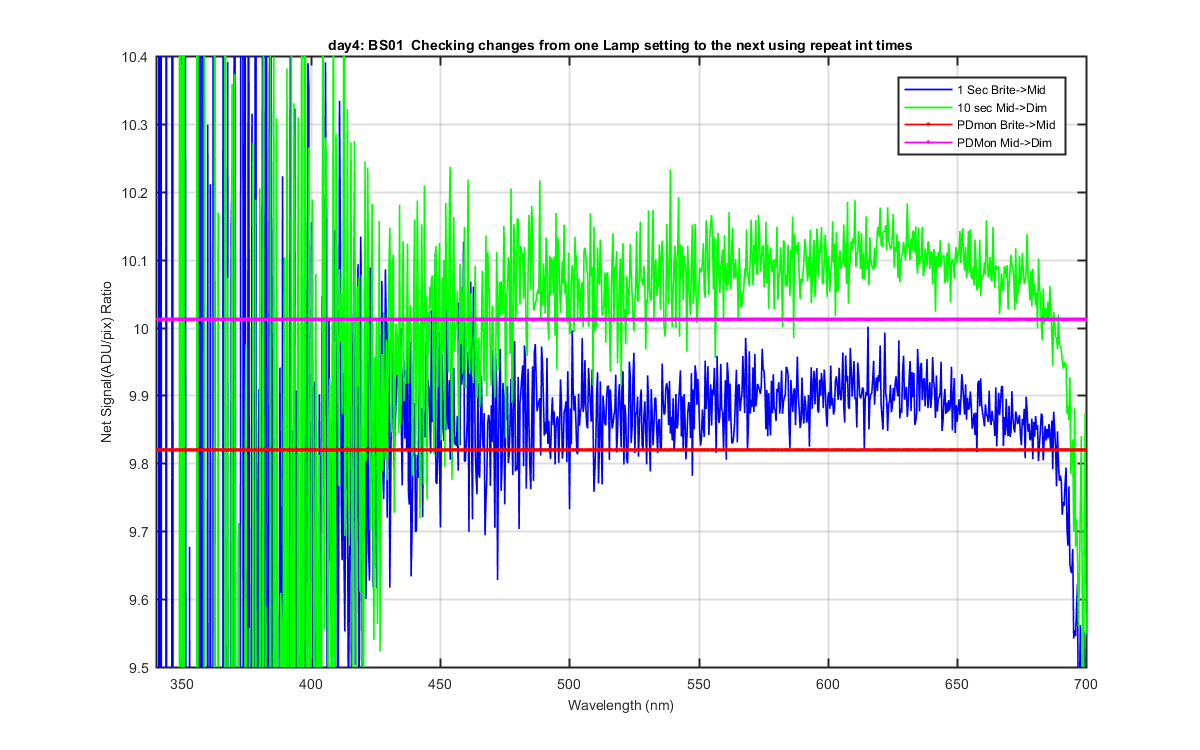
I am not totally sure what this graph is showing but I copied it from Mikes email. Email section below: I checked the Net Sig repeats at 1 sec for the Brite lamp (+/- 0.5%), and at 1 sec for the Mid lamp (+/- 1%), and at 10 sec for the Dim lamp (+/- 1.5%).Since they seemed OK, and the PD mon repeats were essentially 1, I did my Net Sig "normalizing" to the nearest-in-time 1 sec exposure Net Sig at Brite & Mid lamp settings, and to the nearest-in-time 10 sec net at Dim lamp setting(hopefully this will make sense below!). Yea, it looks the same as Mikes, now I need to understand what we are checking for here.
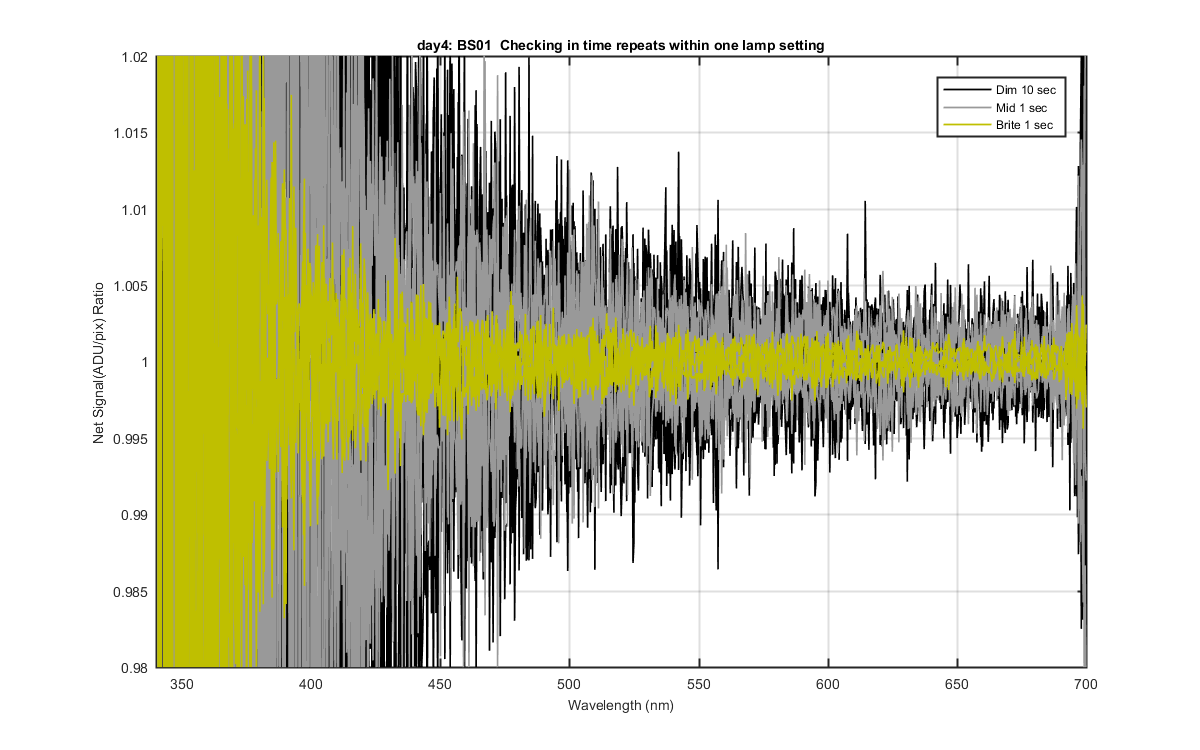
Figure 3
Checking the integration time repeatability within each lamp level. So I found all the Brite 1 sec and divided by the mean to get the variation about the mean. I did the same for the 1 sec Mid and 10 sec Dim data. This looked really good.
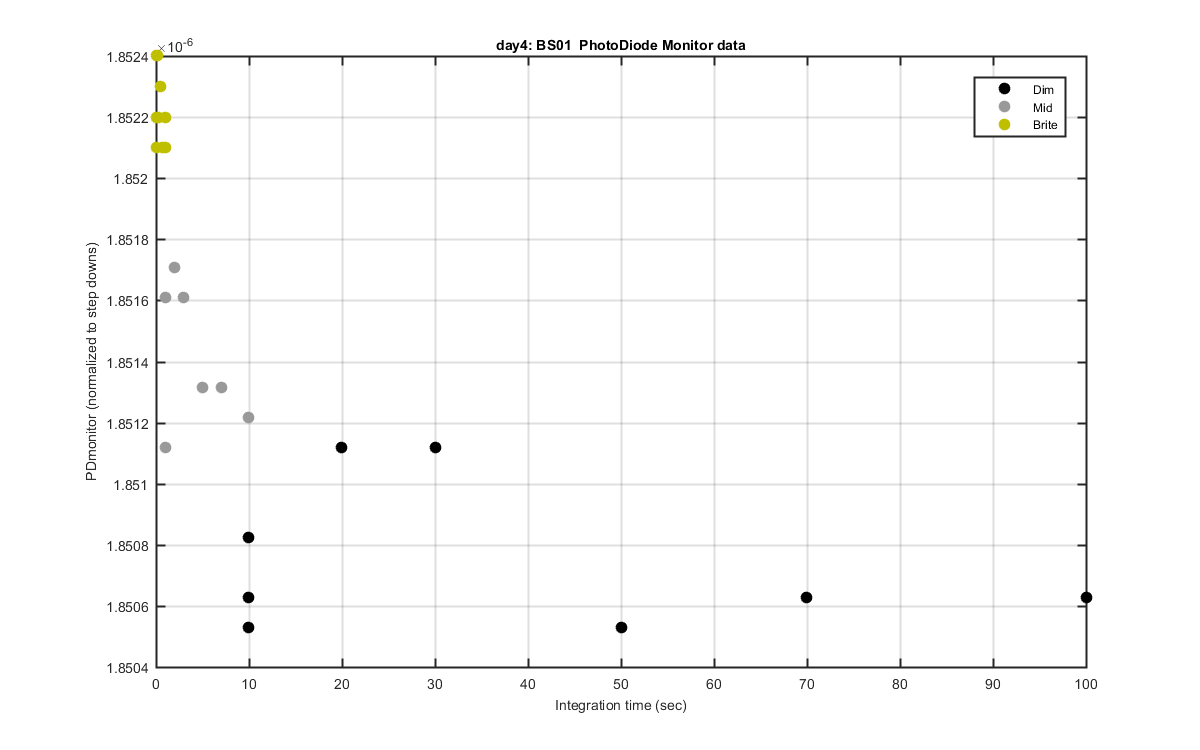
Figure 4
The Photodiode data normalized to the level changes using PDmonitor data.
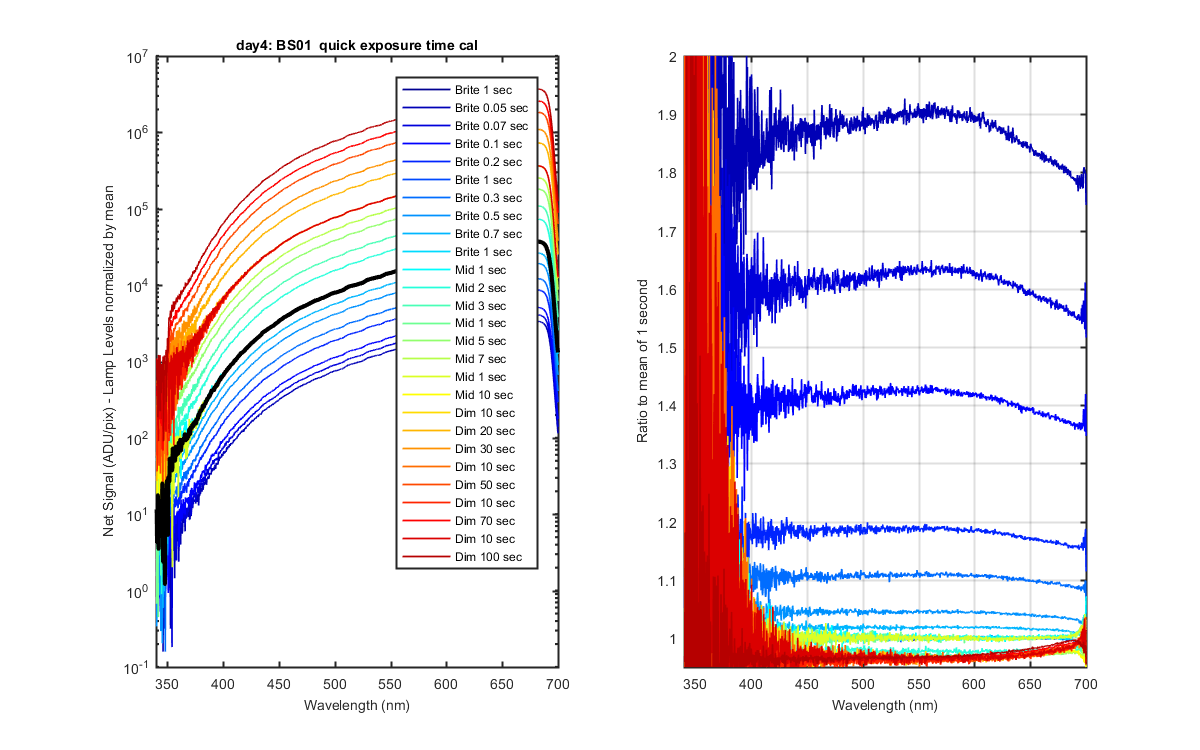
Figure 5
The left panel is the Same data from Figure 2. The right panel is each int time divided by the mean 1 sec data and integration time. I then calculated the mean for each ratio from pixels 300-900 and a std.
Figure 6
A plot of the ratio of measured over nominal Exposure time.
Figure 7
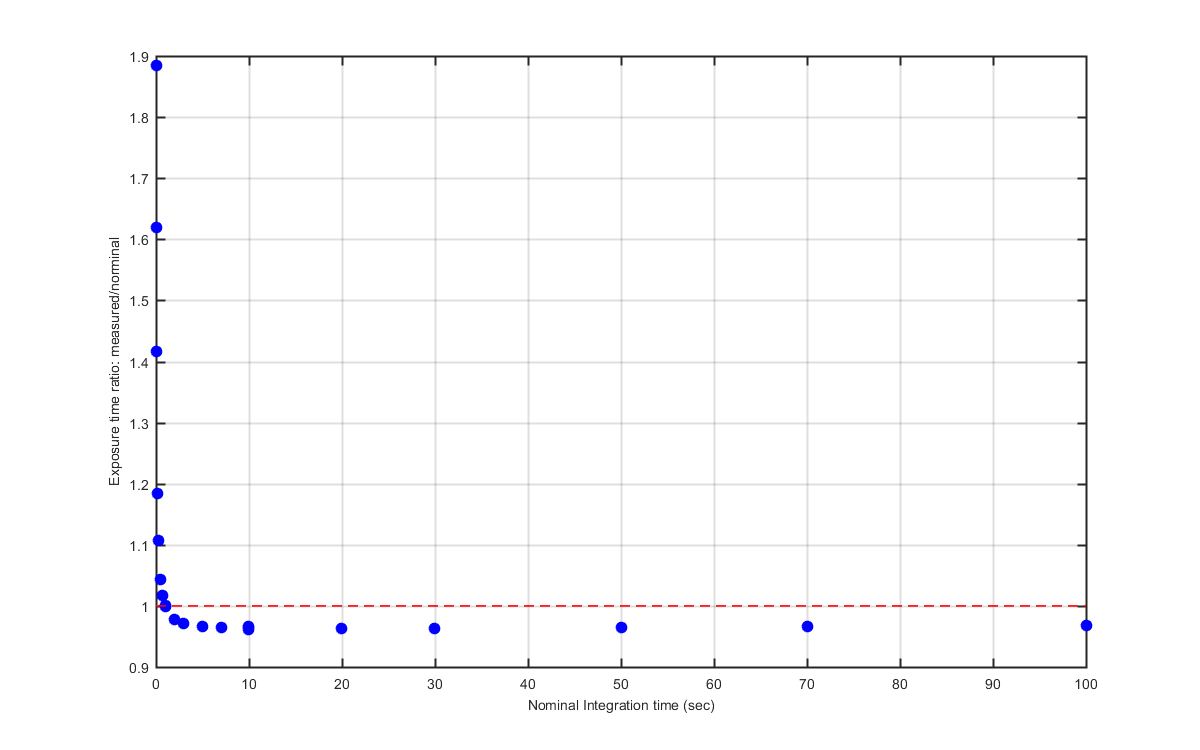
Zoomed in to the higher int time numbers with error bars.
Figure 8
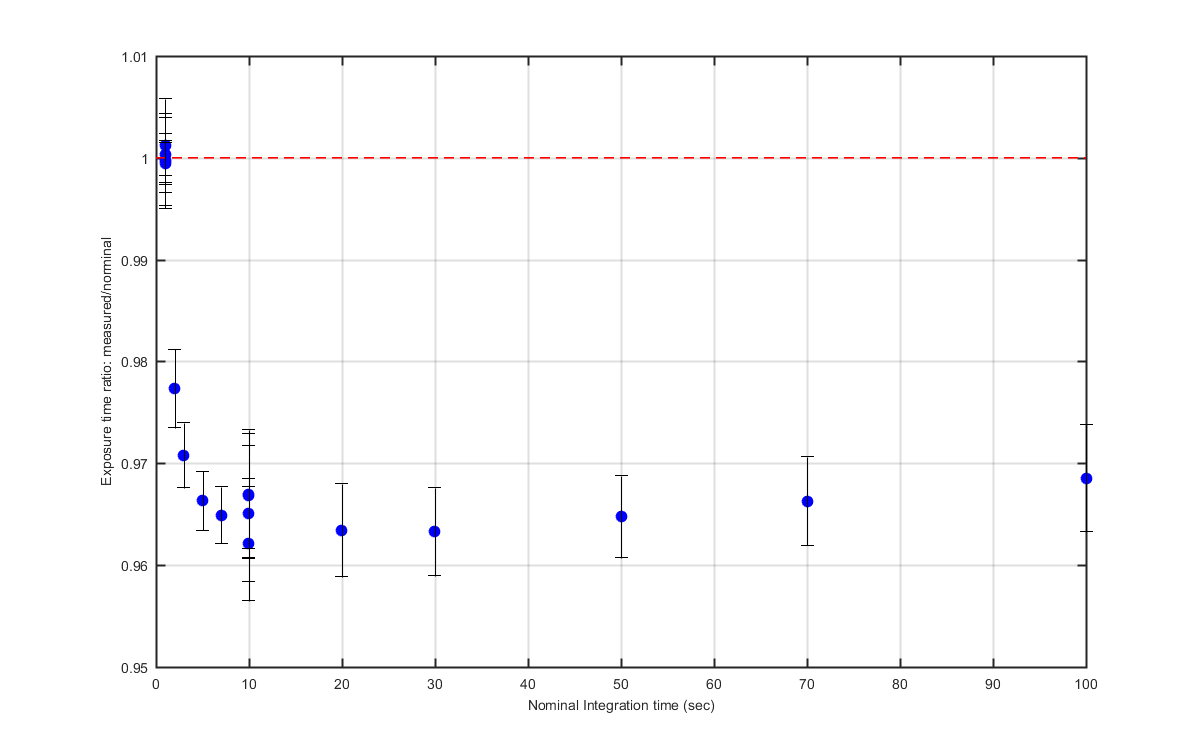
Figure 9