REVISION DATE: 31-Oct-2017 11:48:15
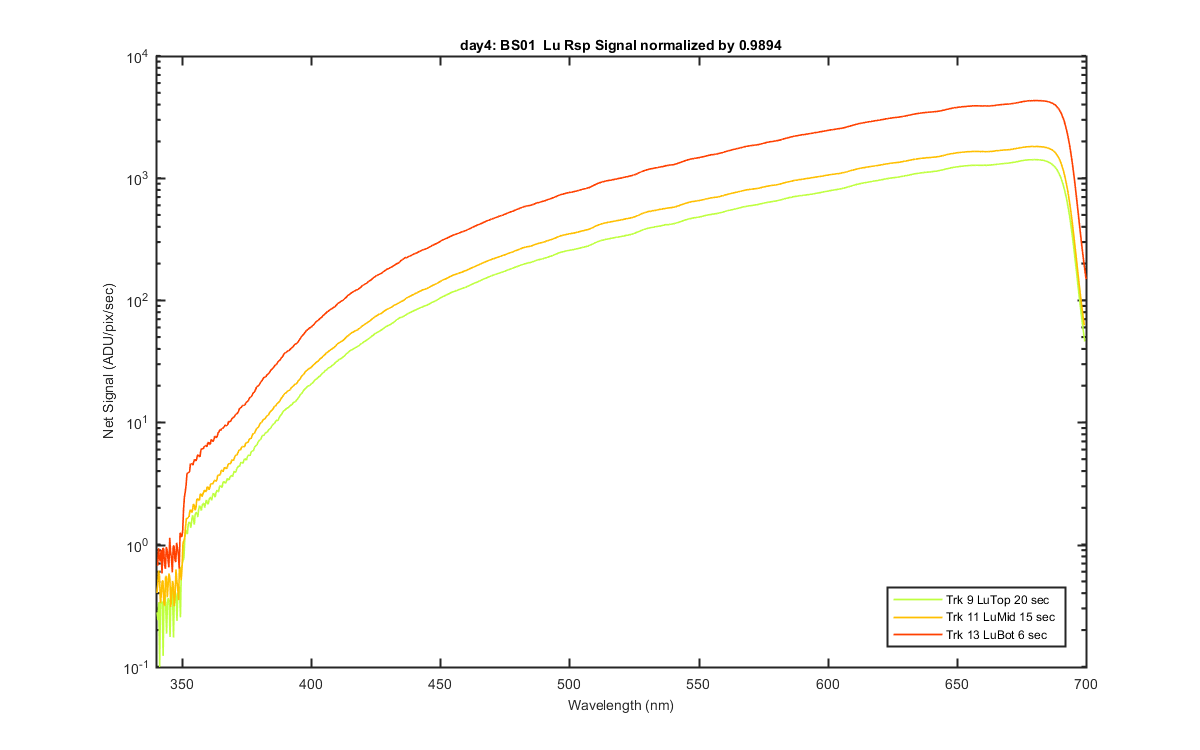
Then, I repeated the Lu cals via the OL425(L9) - like yesterday, except at the proper 6 inch distance between the sphere and Lu head. The PD monitor fL values should be used to normalize, but that is probably not extremely necessary right now. The fL value during NIST cal to normalize to was 26.33 fL. All tonights data were 26.05 to 26.12 fL, so tonights net signals should be multiplied by a factor of 26.05/26.33 = 0.9894, for example. The PD fLs are on the log sheet.
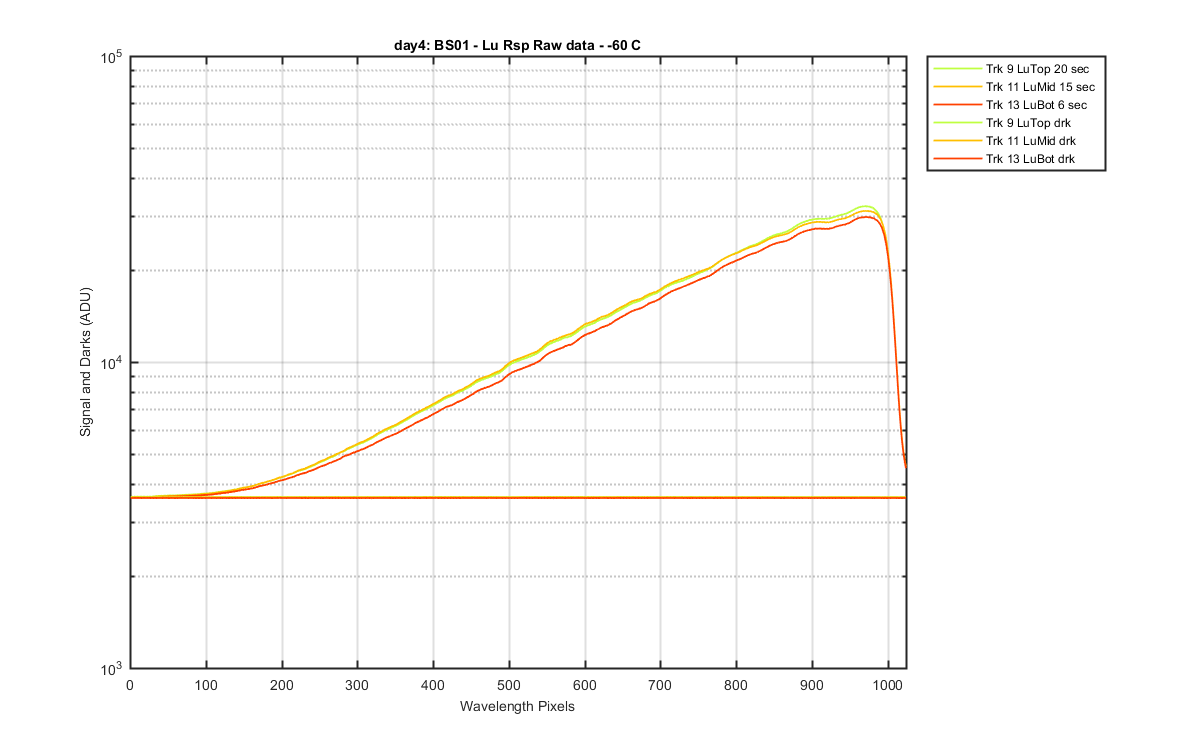
Mikes Lu system response data for LuTop, LuMid and LuBot on the BS01 after the Lu Heads are on, shutters in place and the iris adjusted.
5 lites and 5 backgrounds meaned for each Lu Track
Figure 1
Net signal (ADU/pix/sec) - dark subtracted - adjusted by 0.9894. Mikes notes: The fL value during NIST cal to normalize to was 26.33 fL. All tonights data were 26.05 to 26.12 fL, so tonights net signals should be multiplied by a factor of 26.05/26.33 = 0.9894
Figure 2
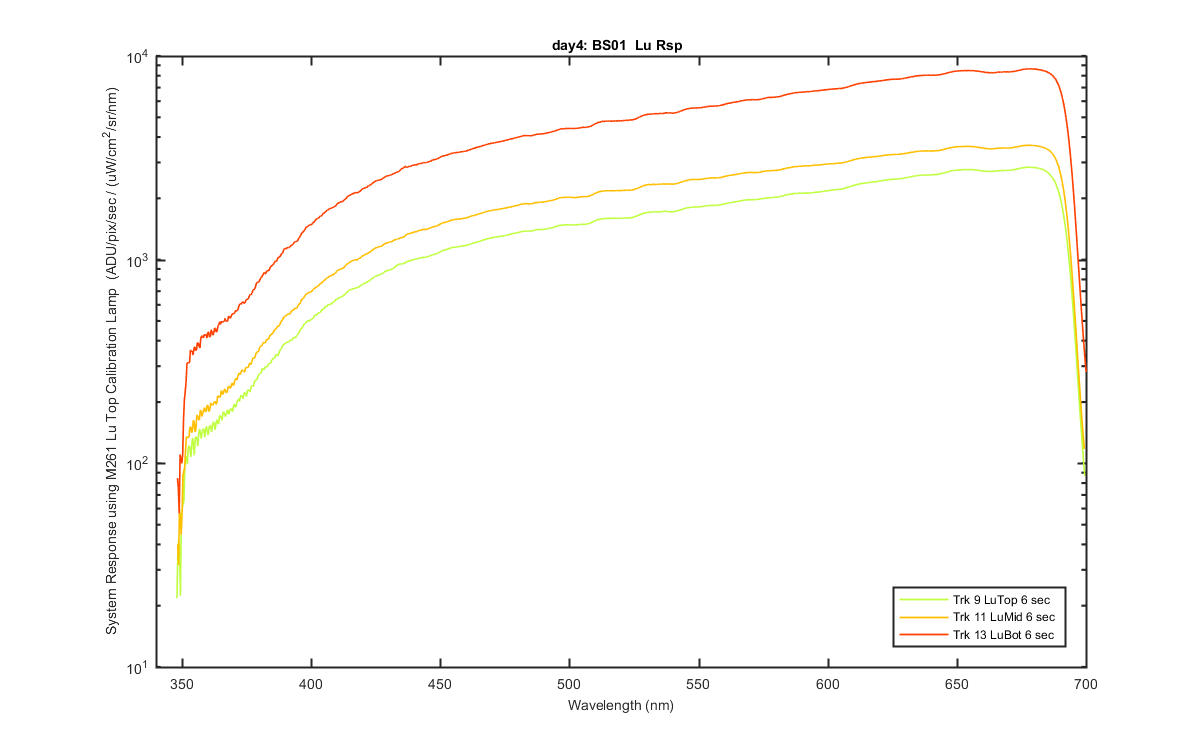
Net signals divided by the MOBY261 LuTop cal lamp data (interpolated to BS01 wavelengths)
Figure 3
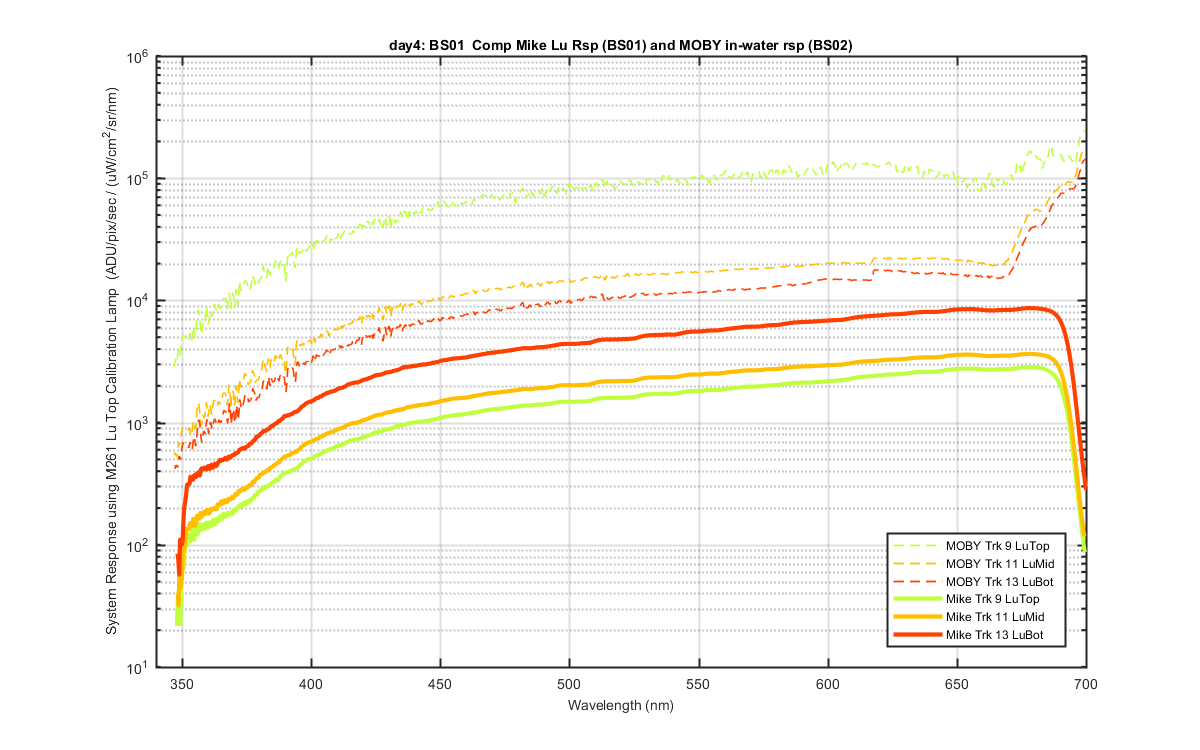
Comparing Mikes BS01 system response to the BS02 "in-water" system response from MOBY261.
Figure 4
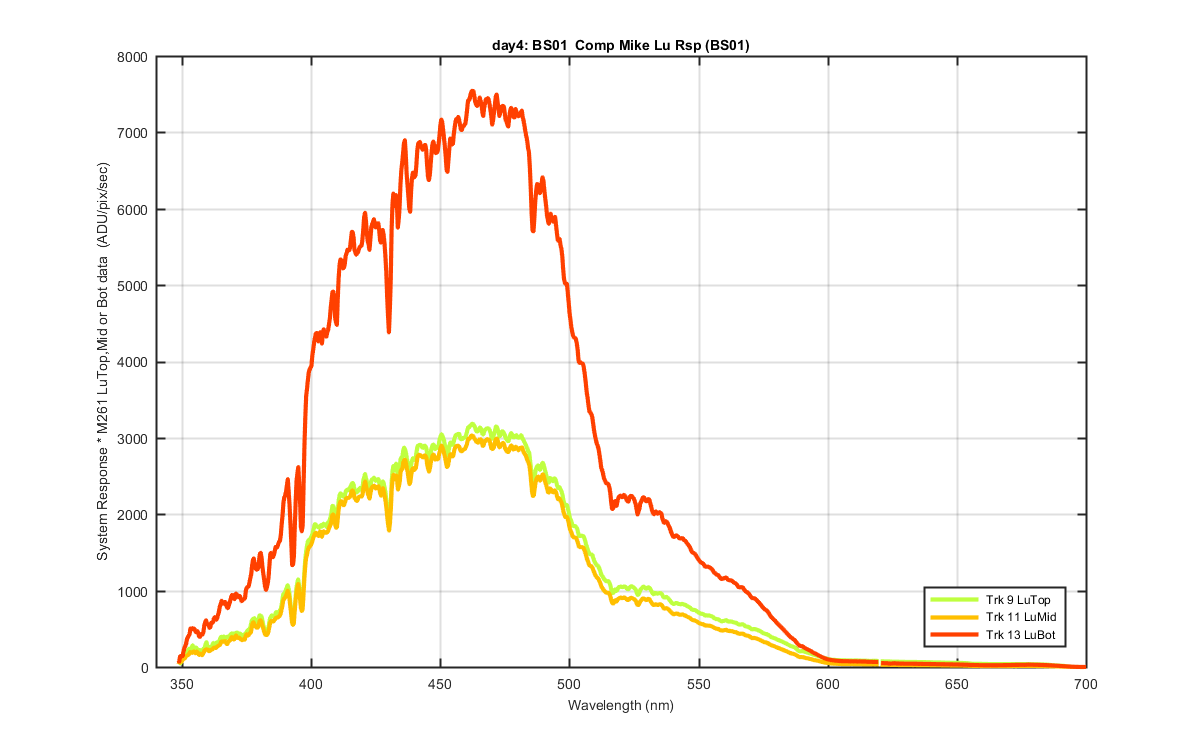
Trying to figure out exposure times. I multiplied Mikes Lu response by a in-water (good) LuTop, Mid or Bot data set and got the below graph for each Track. I think the units are now ADU/pix/sec. So what int time will get the data to 50K. The below table shows the max int time for each Lu track, if I did my math right. The are very similar to the one calculated from the rough cal on day 3.
Trk  Max ADU   Exposure to get 50K ADU
 9      4059       12.3
11      3935       12.7
13      10288       4.8
Figure 5