REVISION DATE: 31-Oct-2017 11:45:08
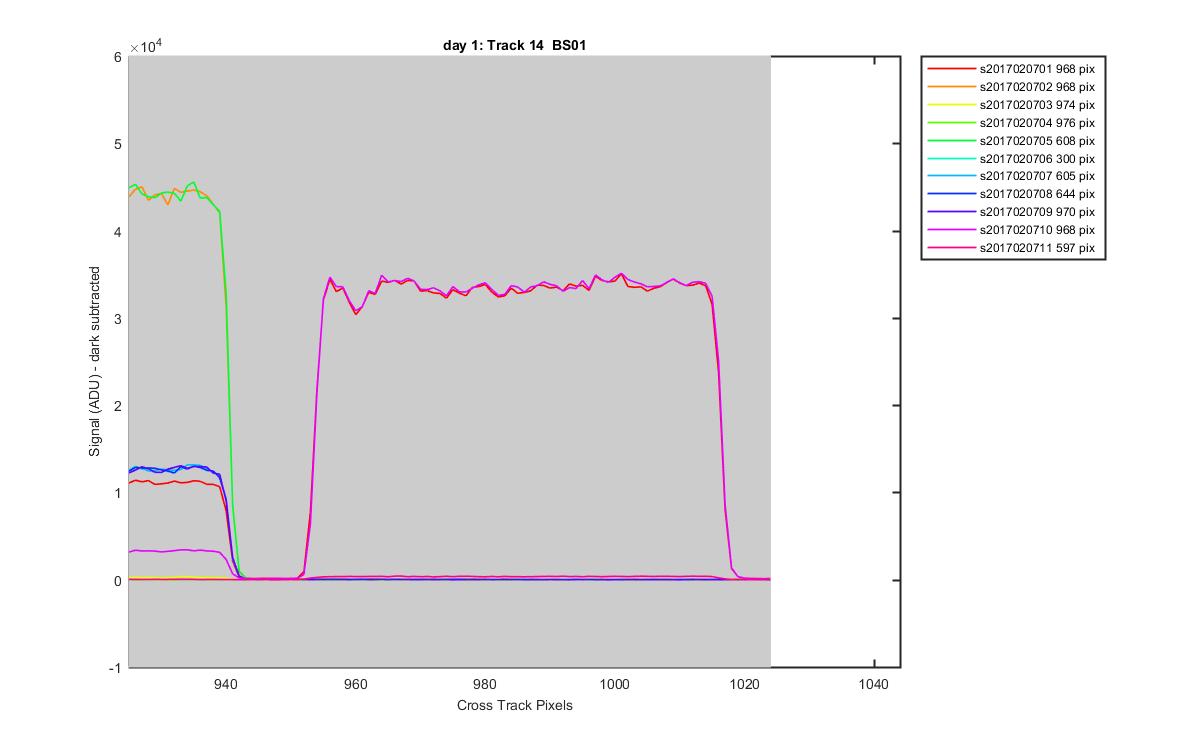
The graphs below show how I defined the tracks. Grey patches are what is averaged for each track. These are created from Oriel data, data sets 1 - 12 (temp control on and off and looking at the lamp). These are the new track definition for BS01cfg005.
Track pixels:
Track:  1       2       3       4       5       6       7       8       9      10      11      12      13      14
Left:   1      72     146     220     293     365     437     509     582     652     726     797     872     945
Right:  77     150     224     297     369     441     513     586     658     730     803     876     951    1024
Figure 1
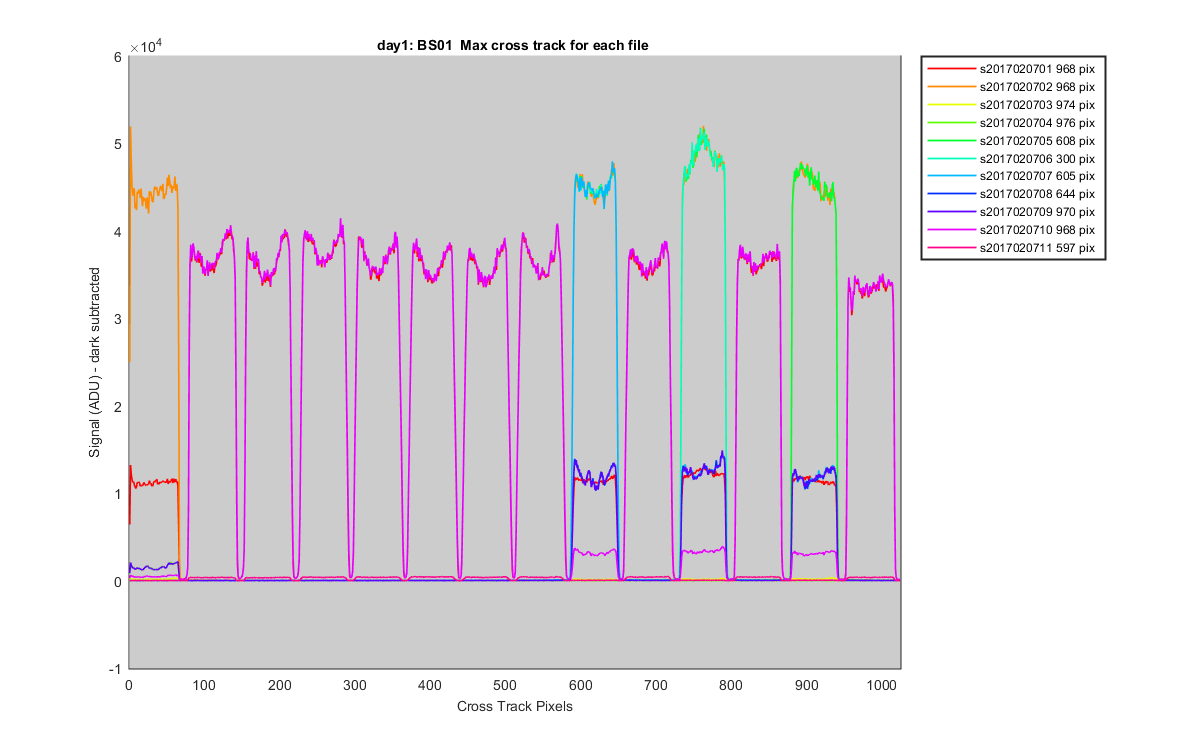
Figure 2
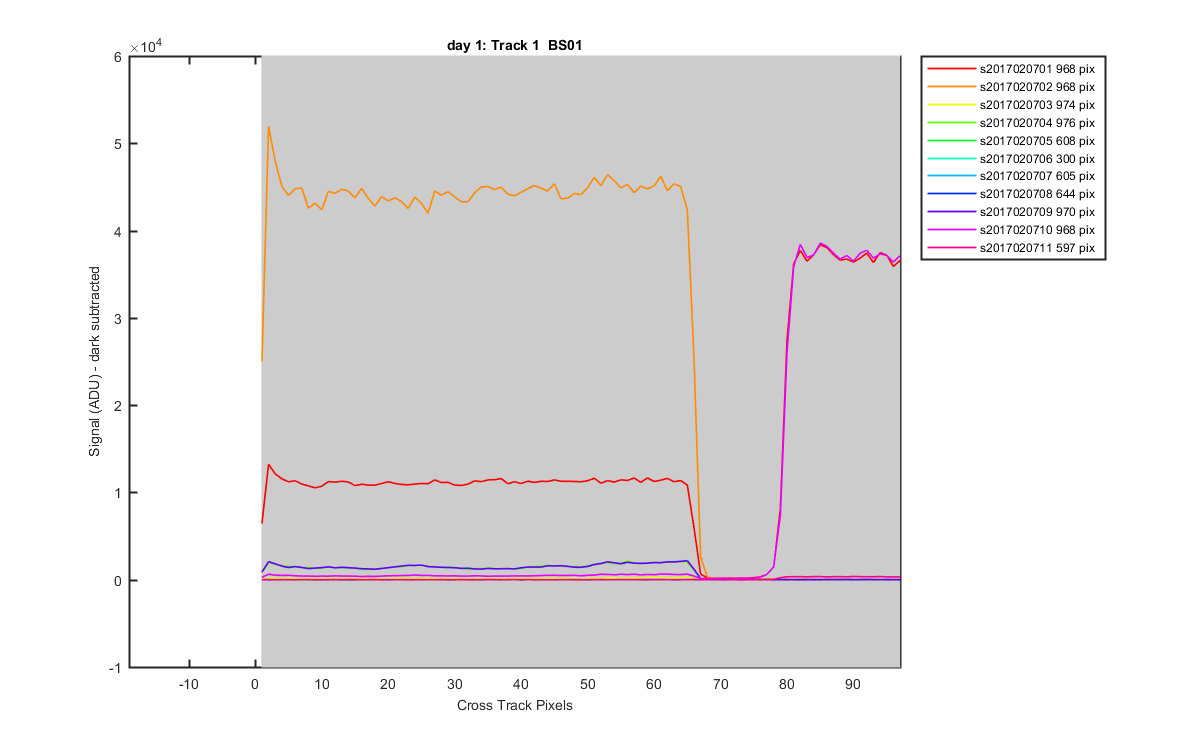
Figure 3
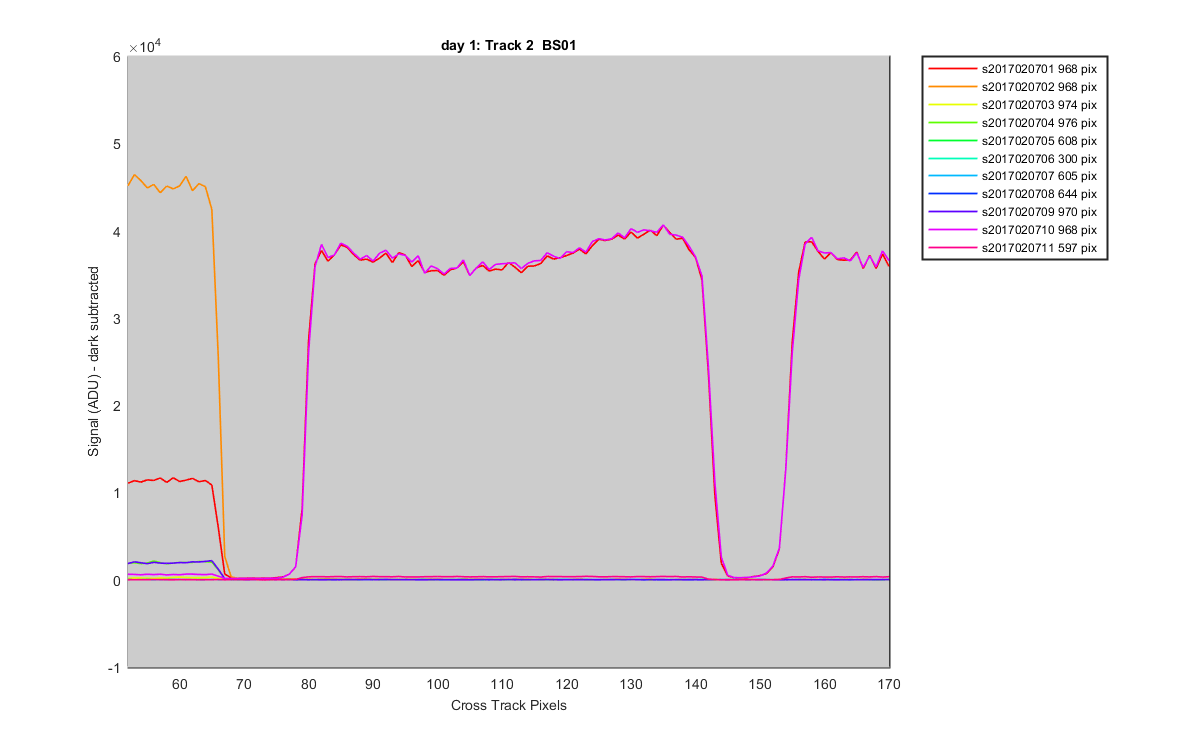
Figure 4
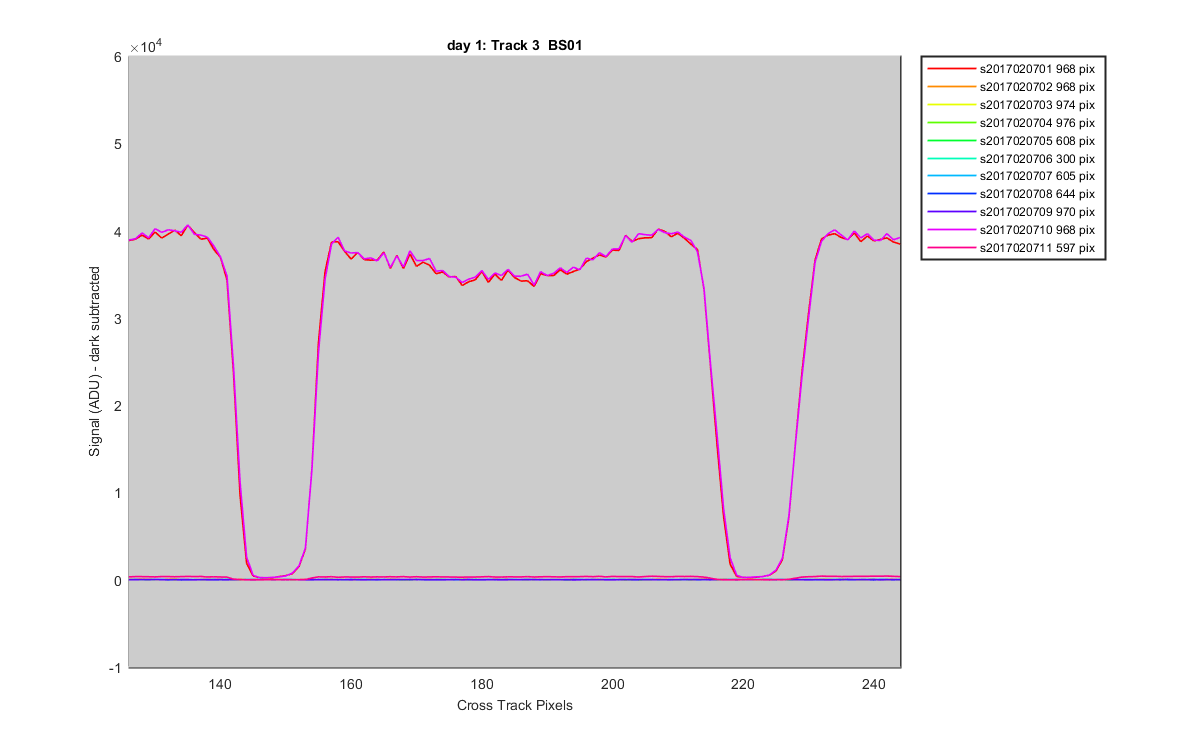
Figure 5
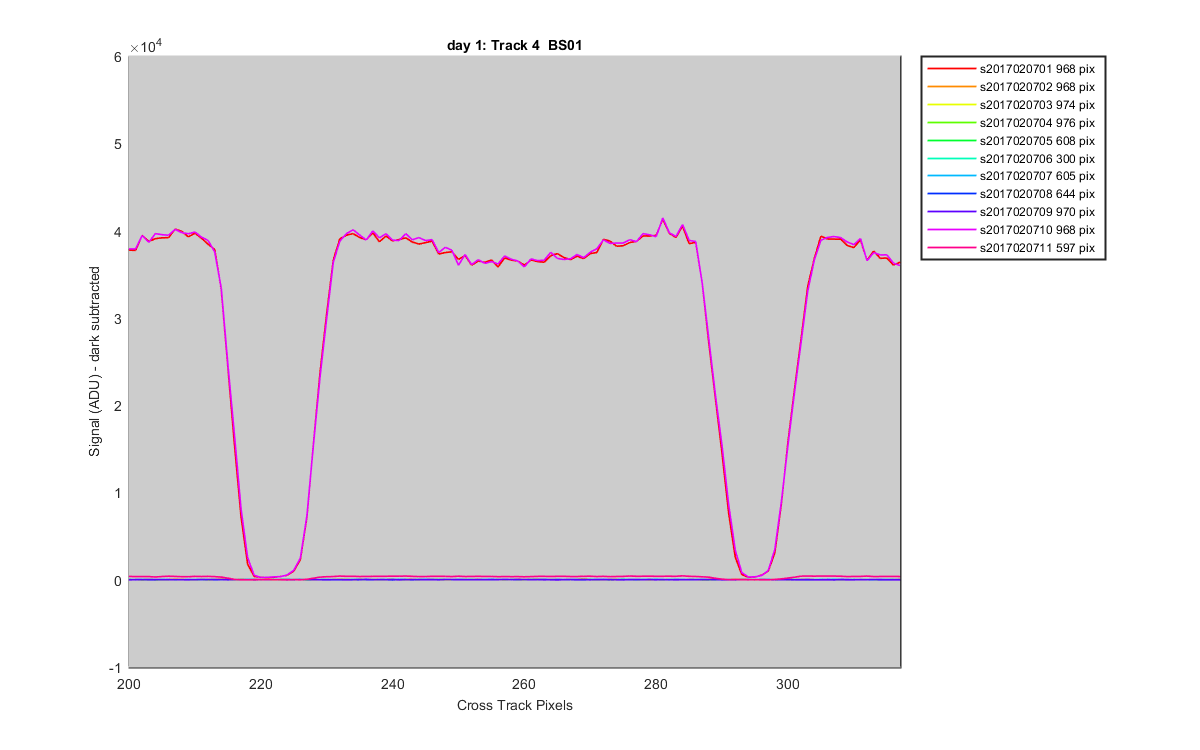
Figure 6
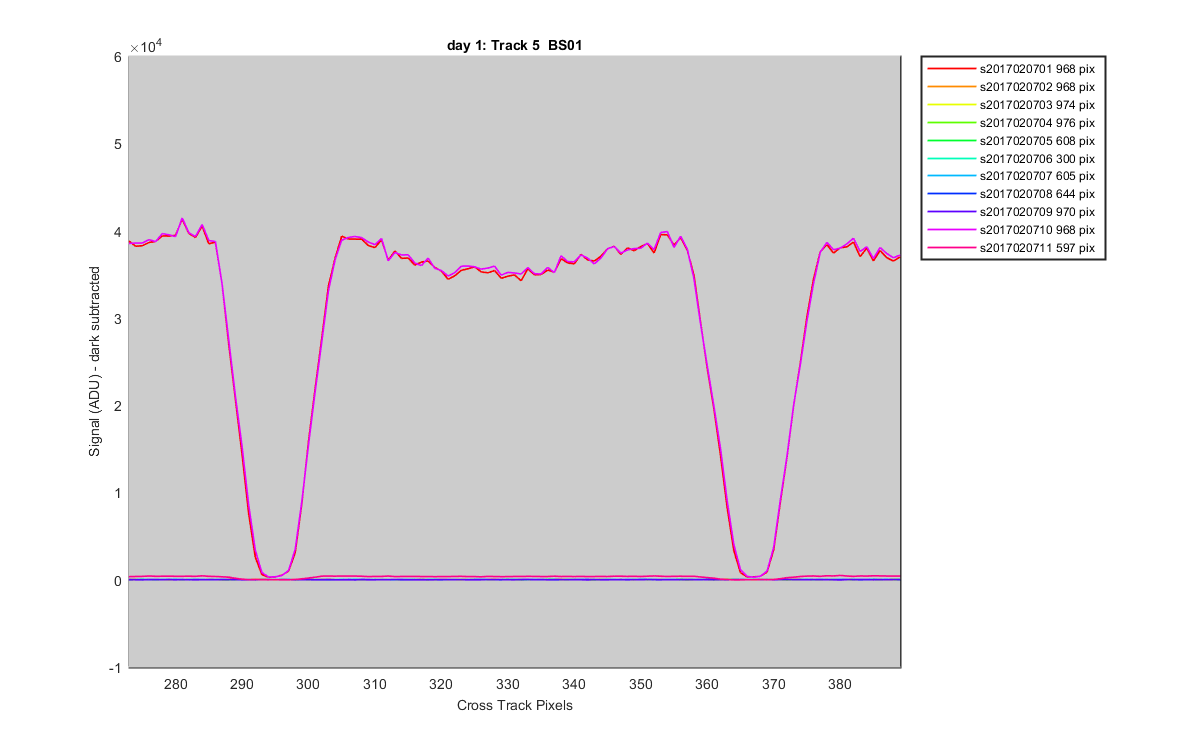
Figure 7
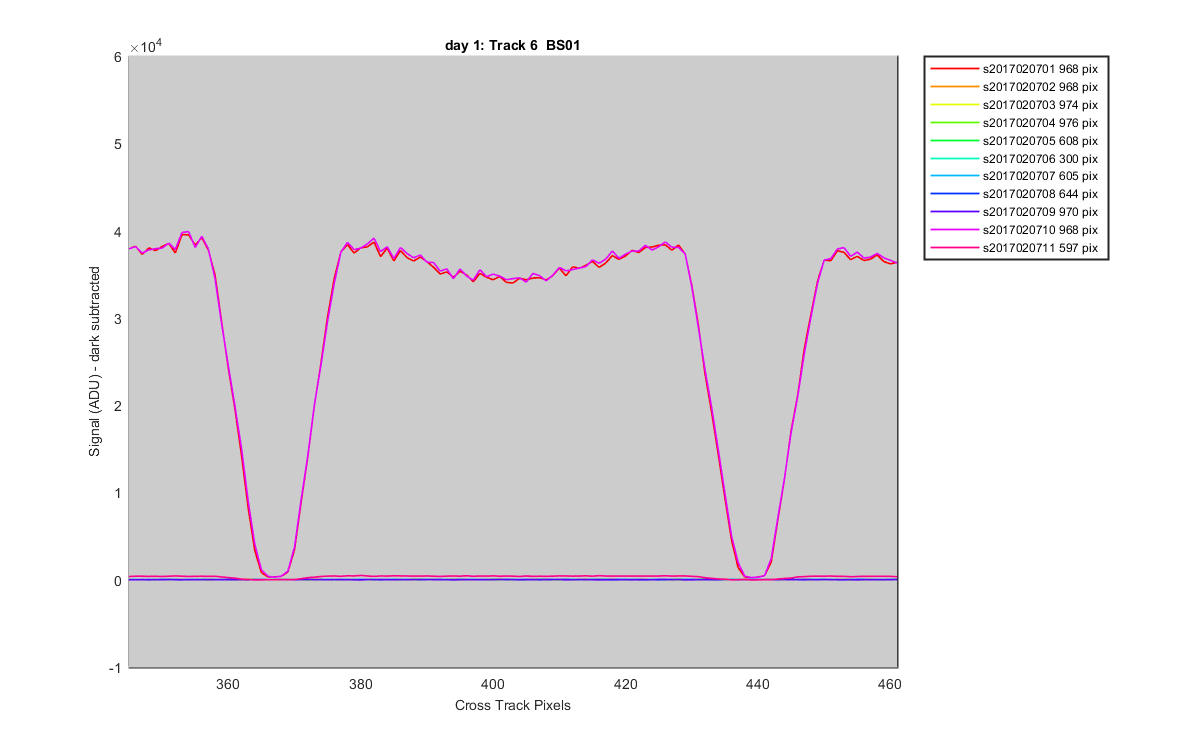
Figure 8
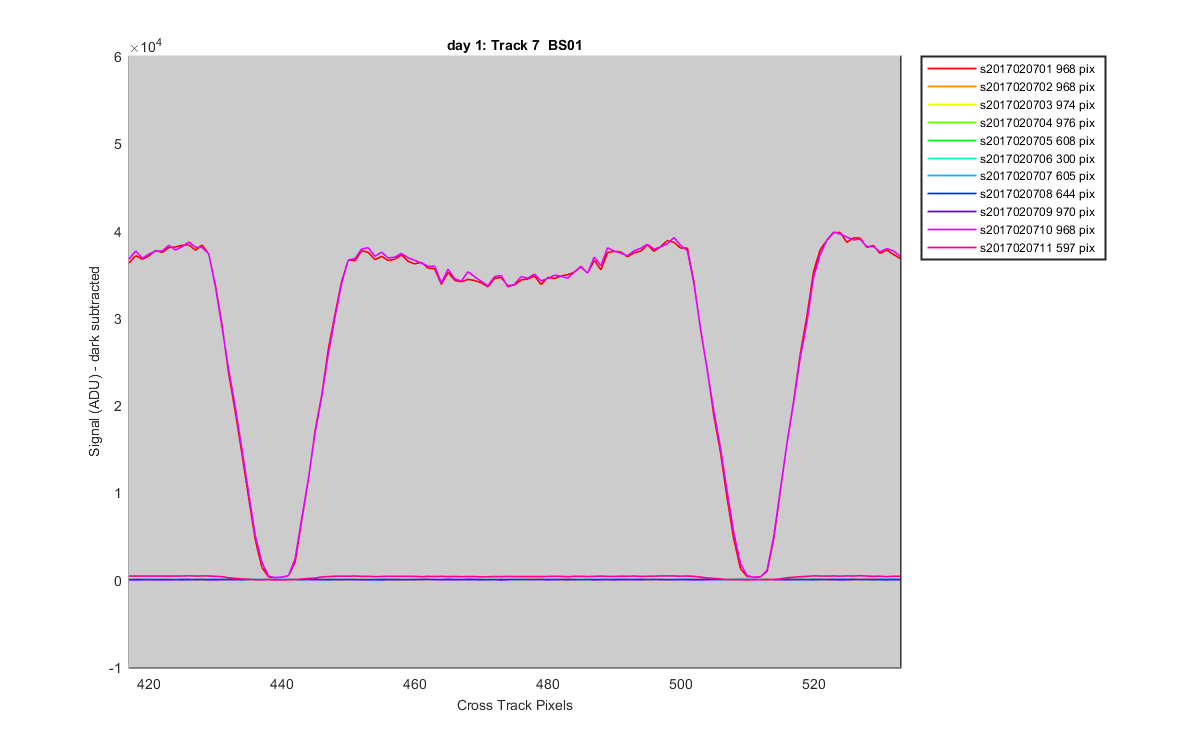
Figure 9
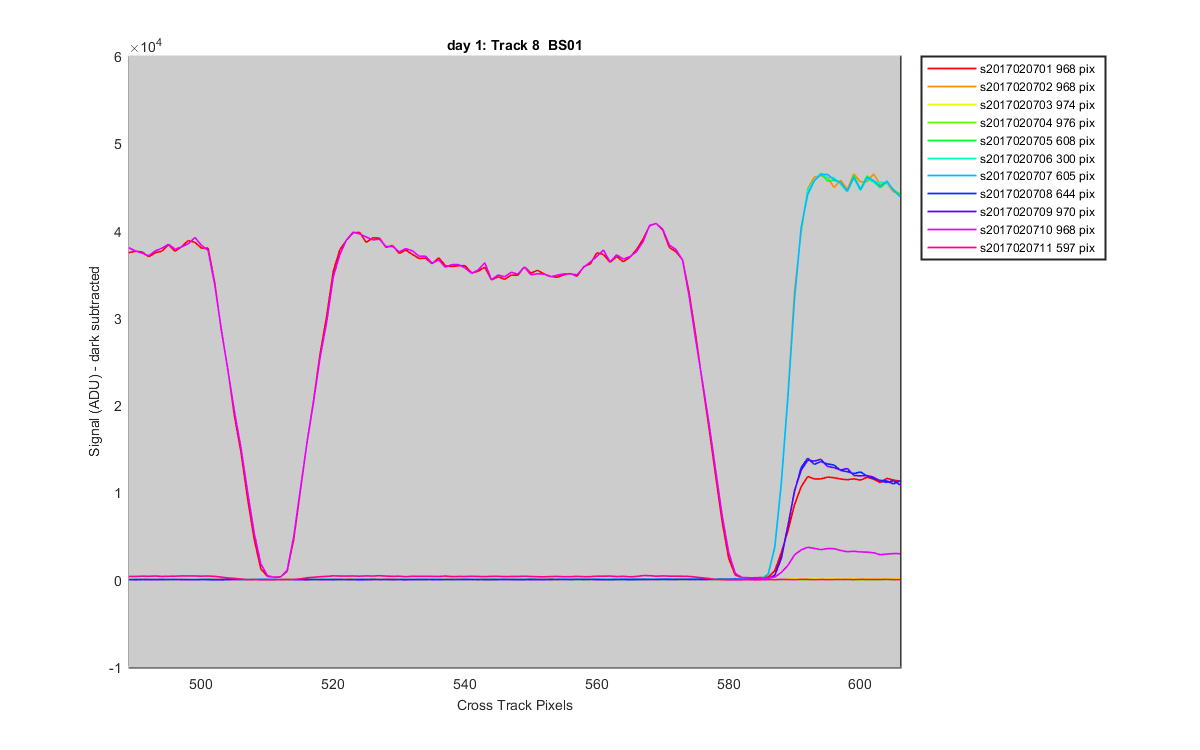
Figure 10
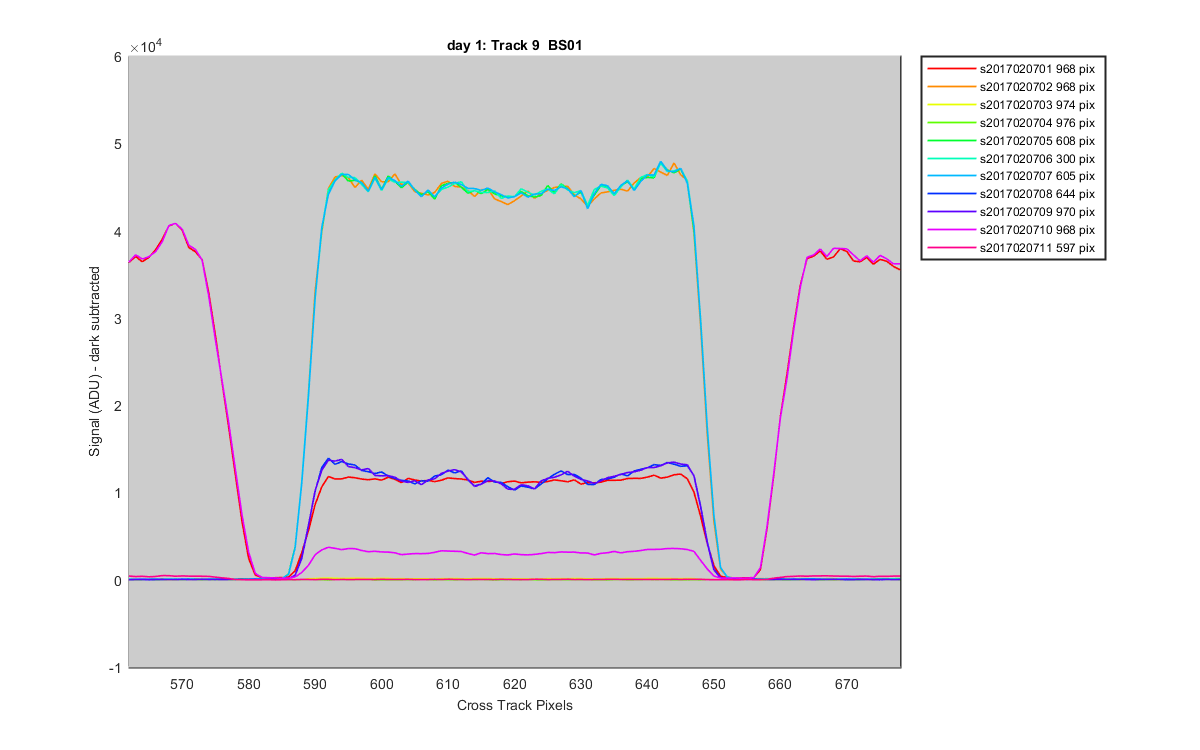
Figure 11
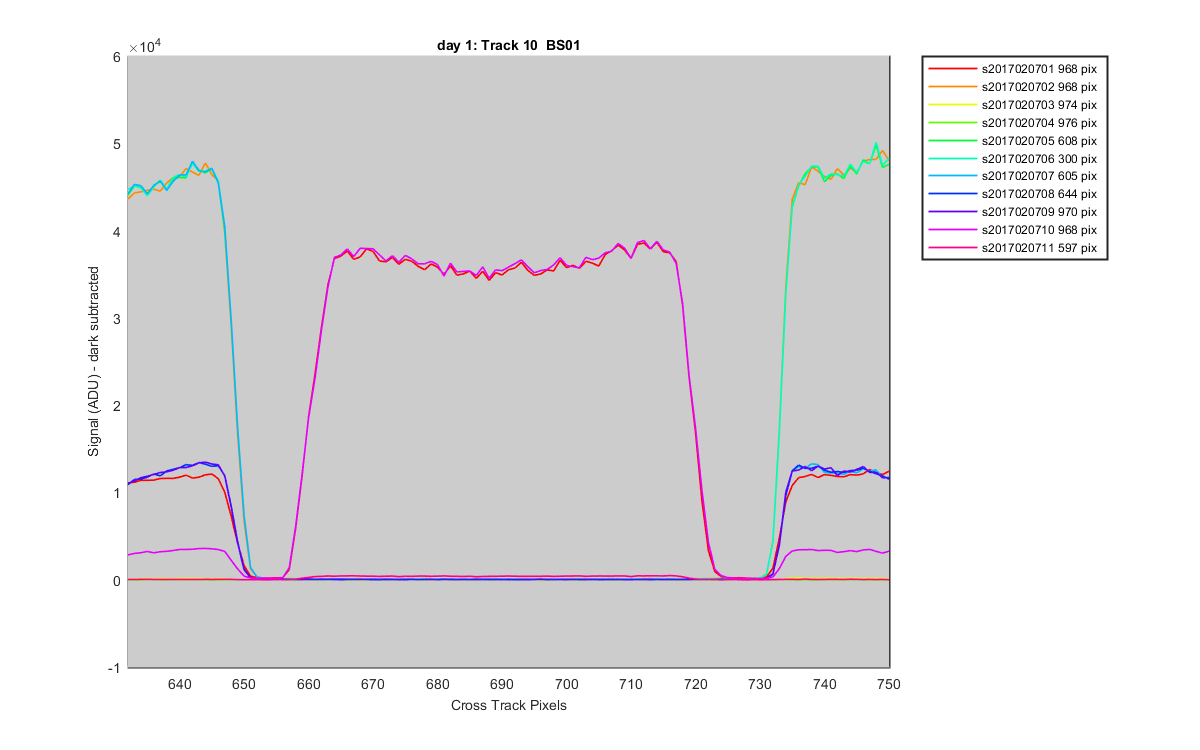
Figure 12
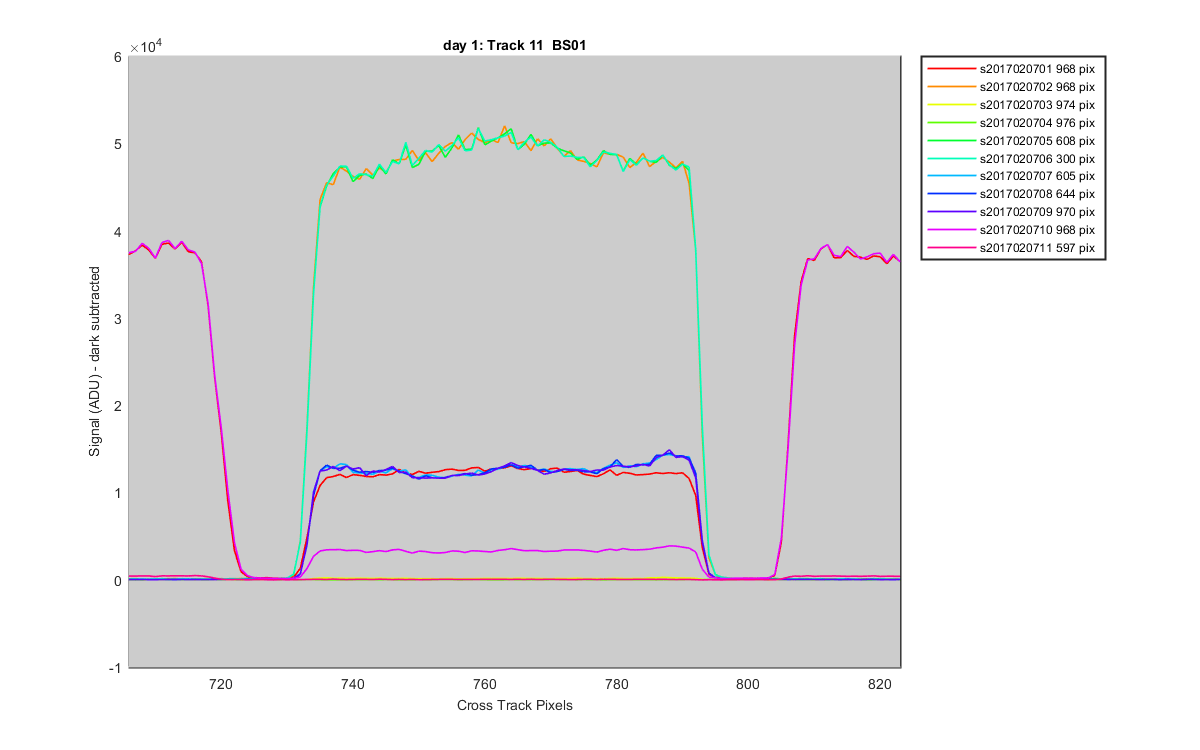
Figure 13
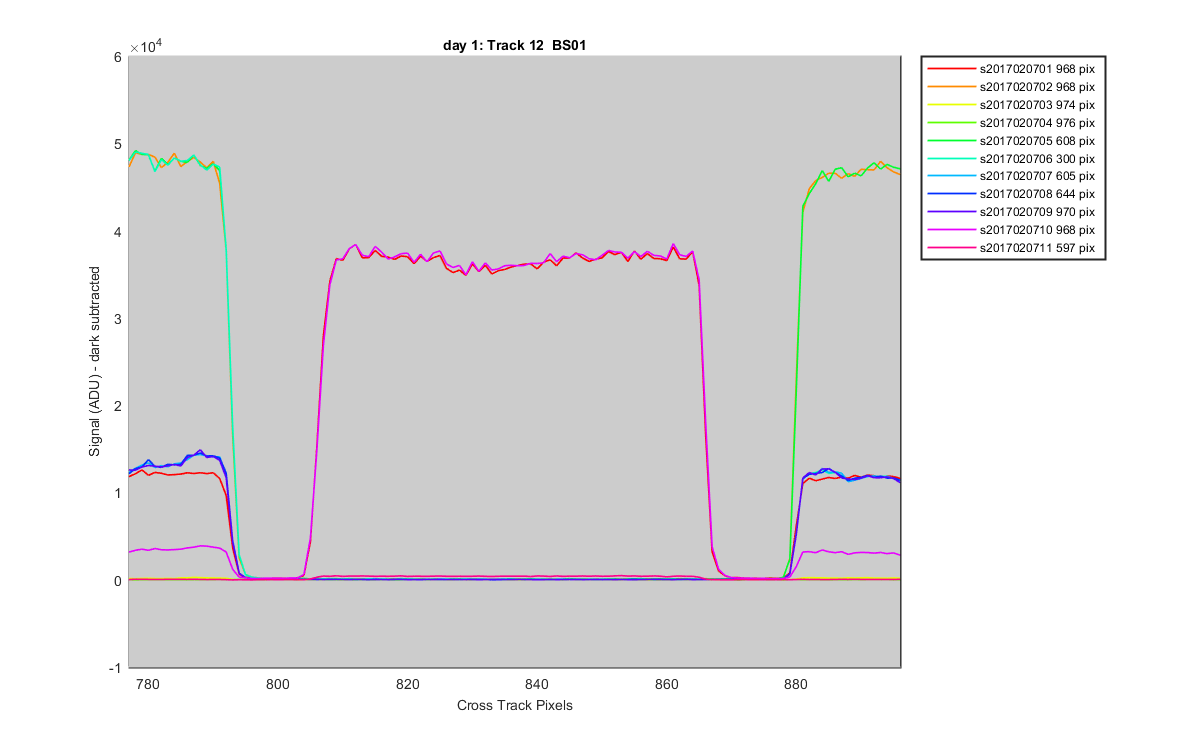
Figure 14
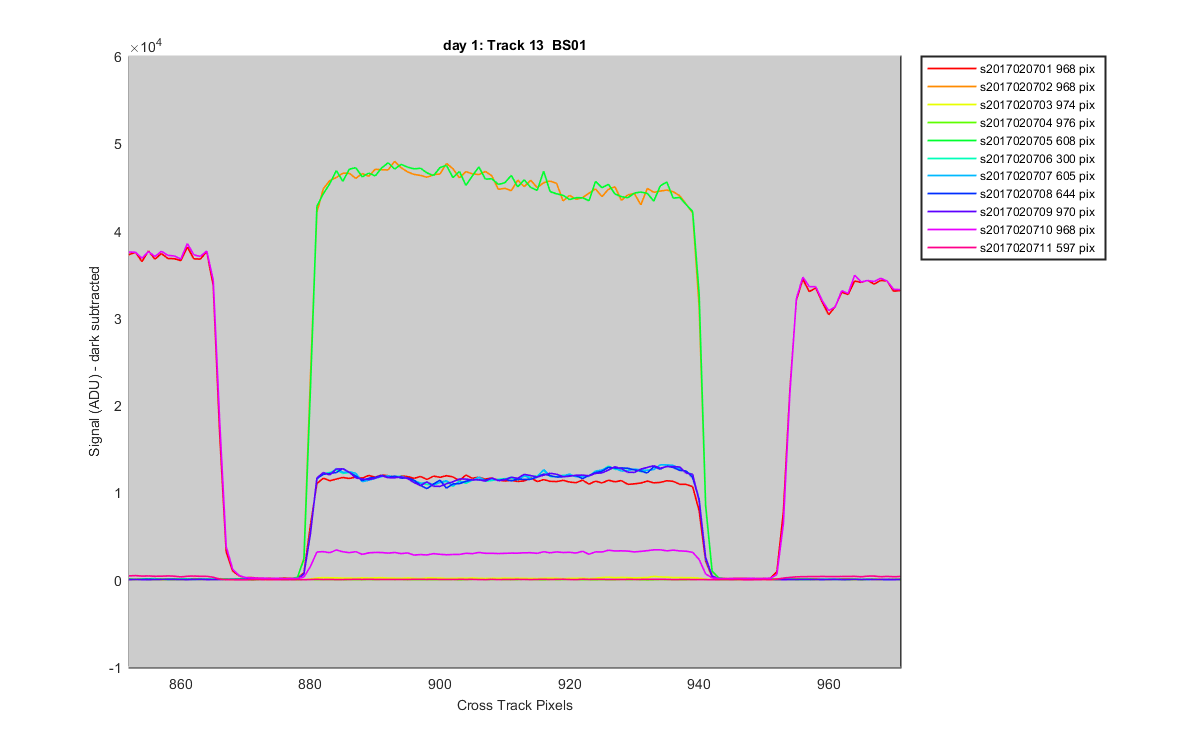
Figure 15