REVISION DATE: 23-Mar-2017 14:46:16
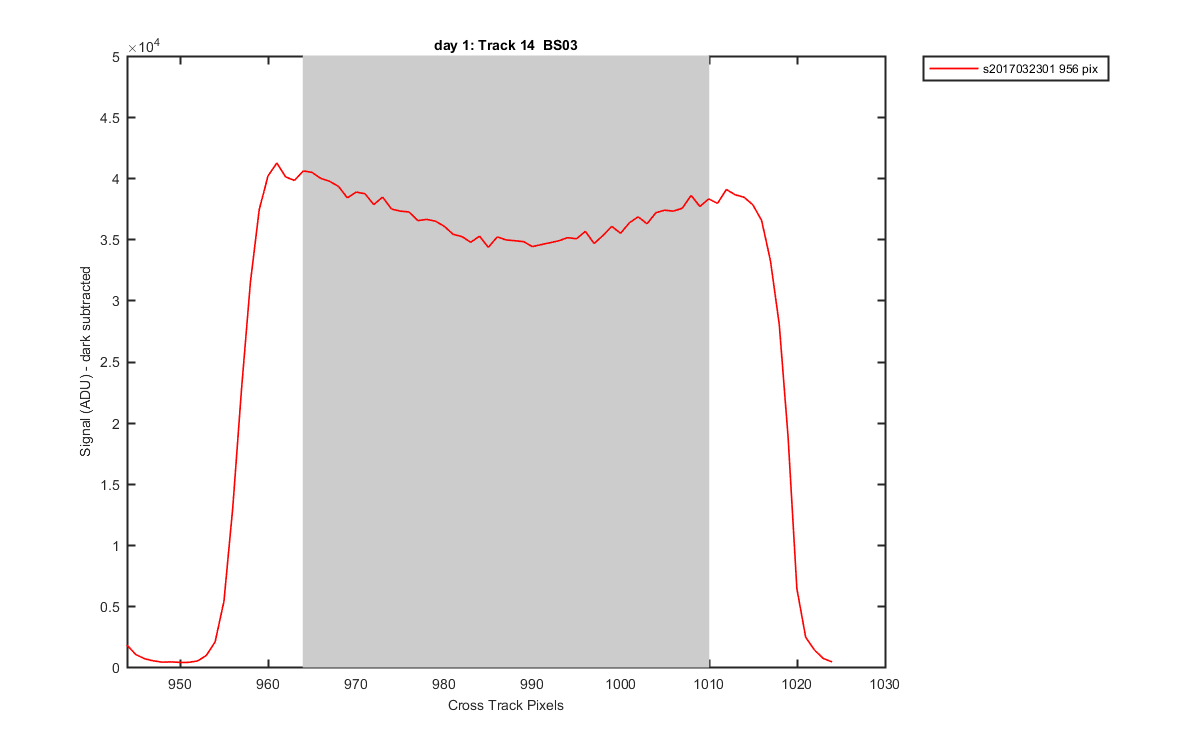
The graphs below show how I defined the tracks. Grey patches are what is averaged for each track. These are created from Oriel data, data sets 1 - 12 (temp control on and off and looking at the lamp). The track definitions from Resonon still look good.
Track pixels:
Track:  1       2       3       4       5       6       7       8       9      10      11      12      13      14
Left:   13      93     166     243     315     386     458     531     603     673     746     818     891     964
Right:  58     135     210     280     353     425     496     571     641     713     783     858     933    1010
Figure 1
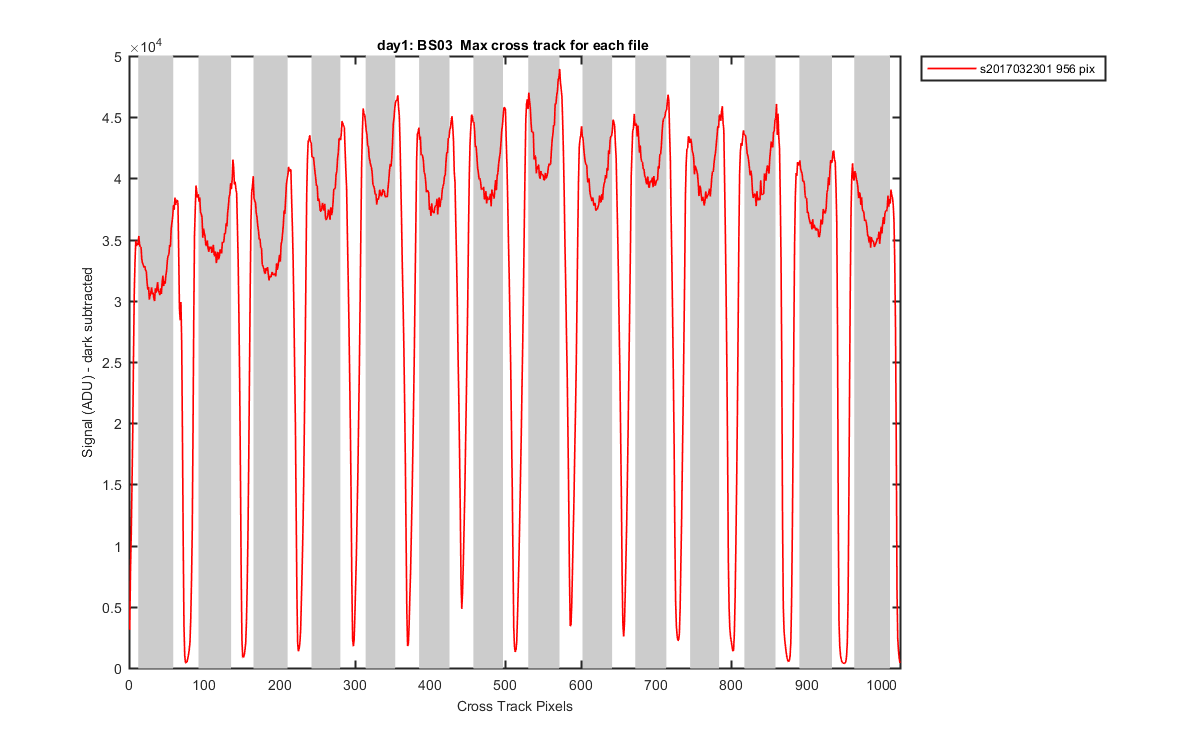
Figure 2
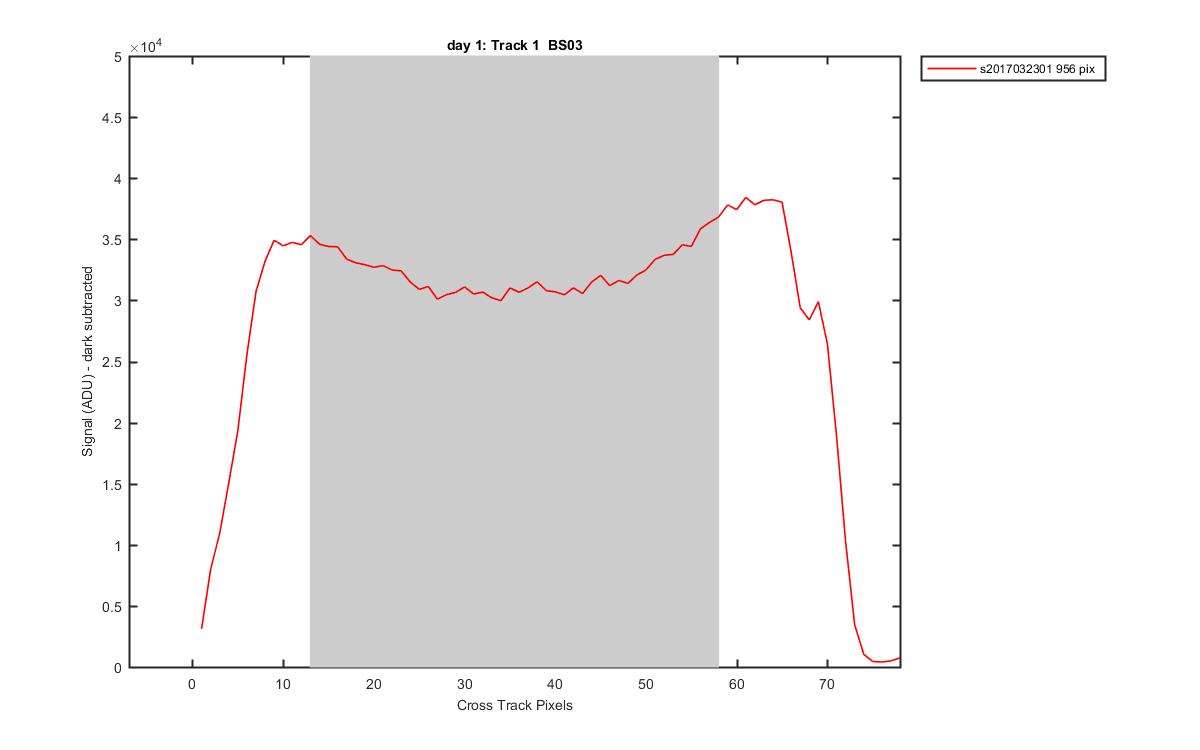
Figure 3

Figure 4
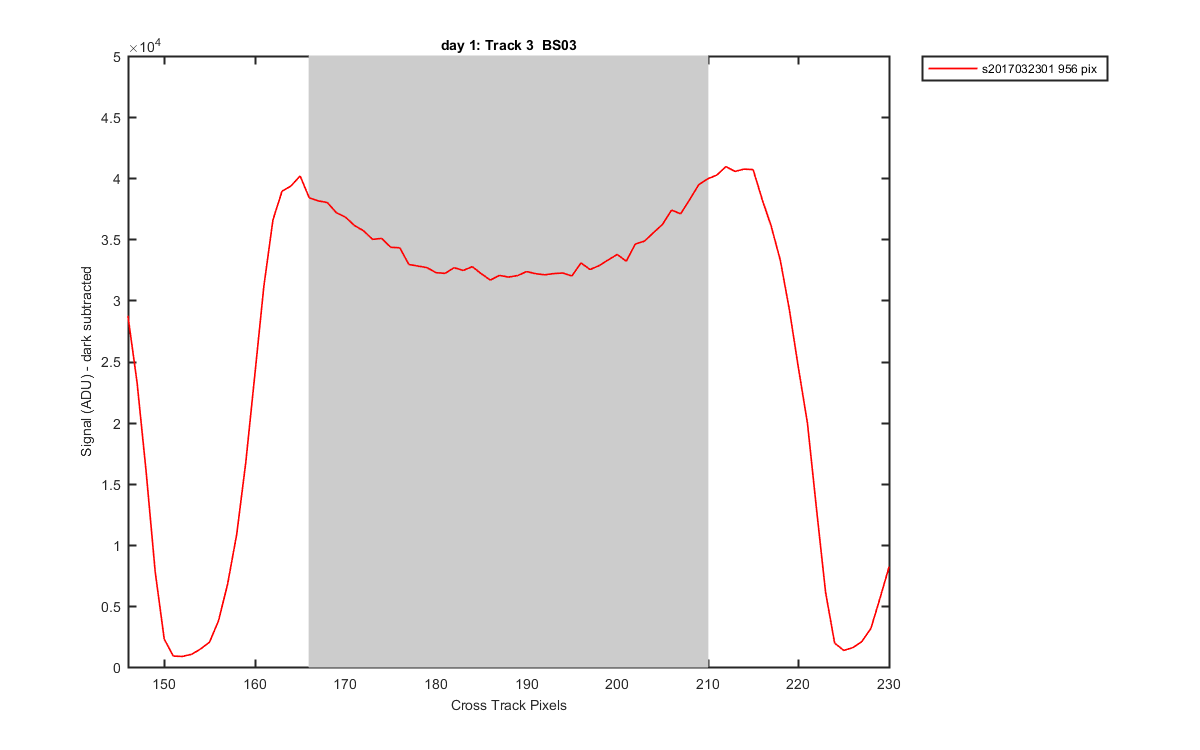
Figure 5
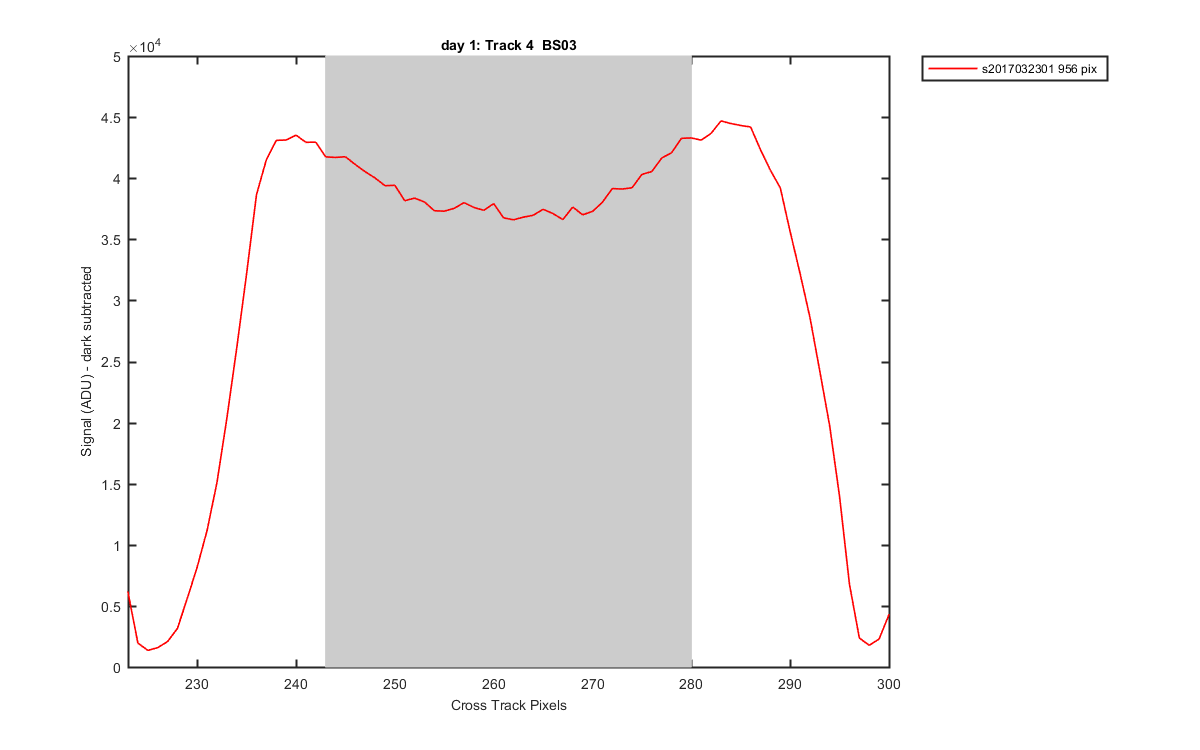
Figure 6
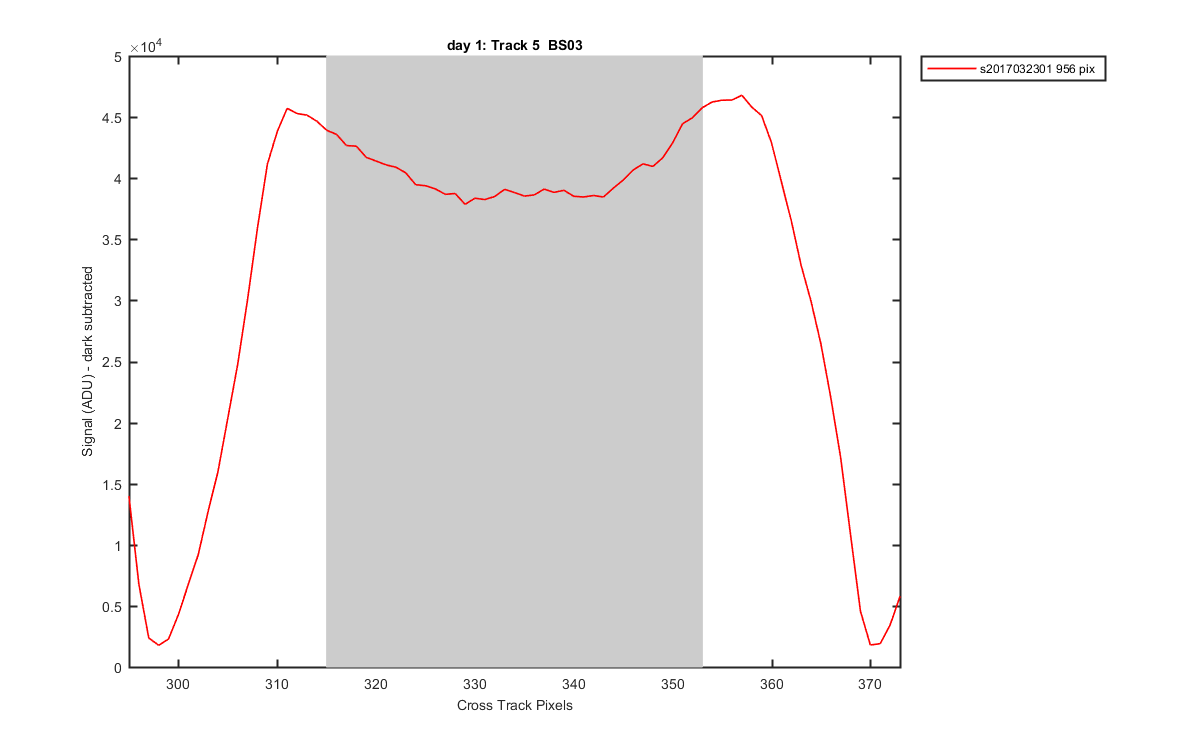
Figure 7
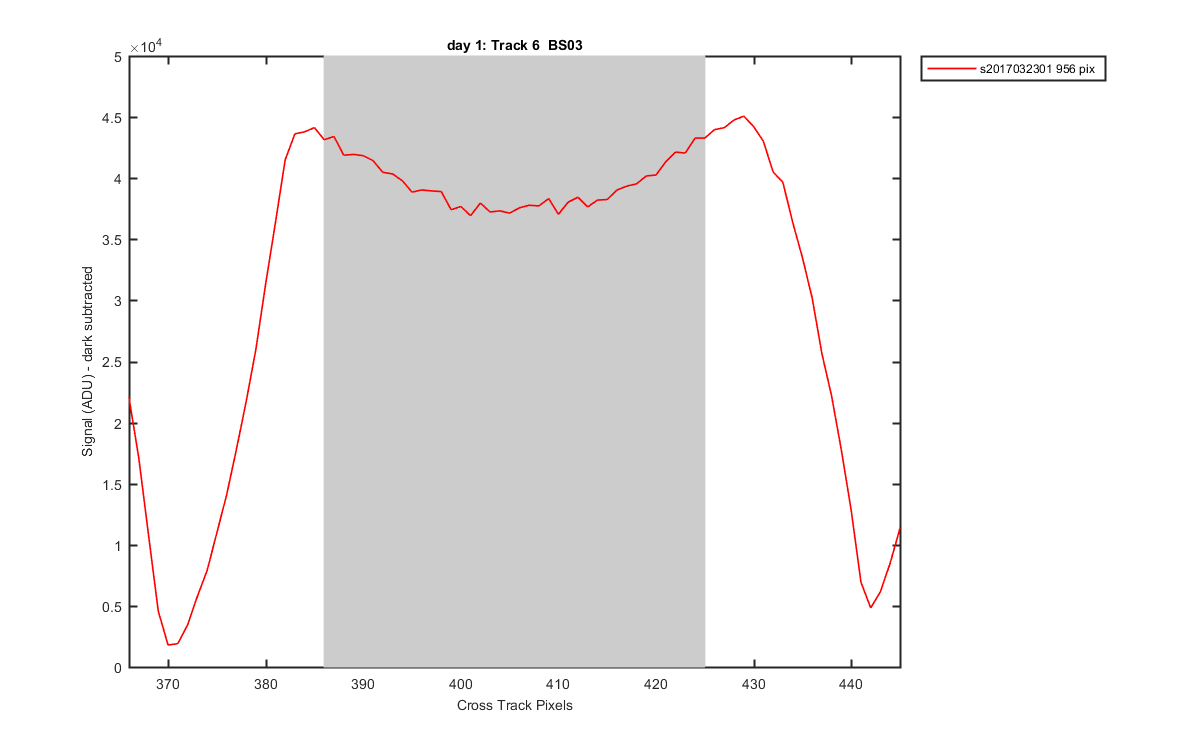
Figure 8
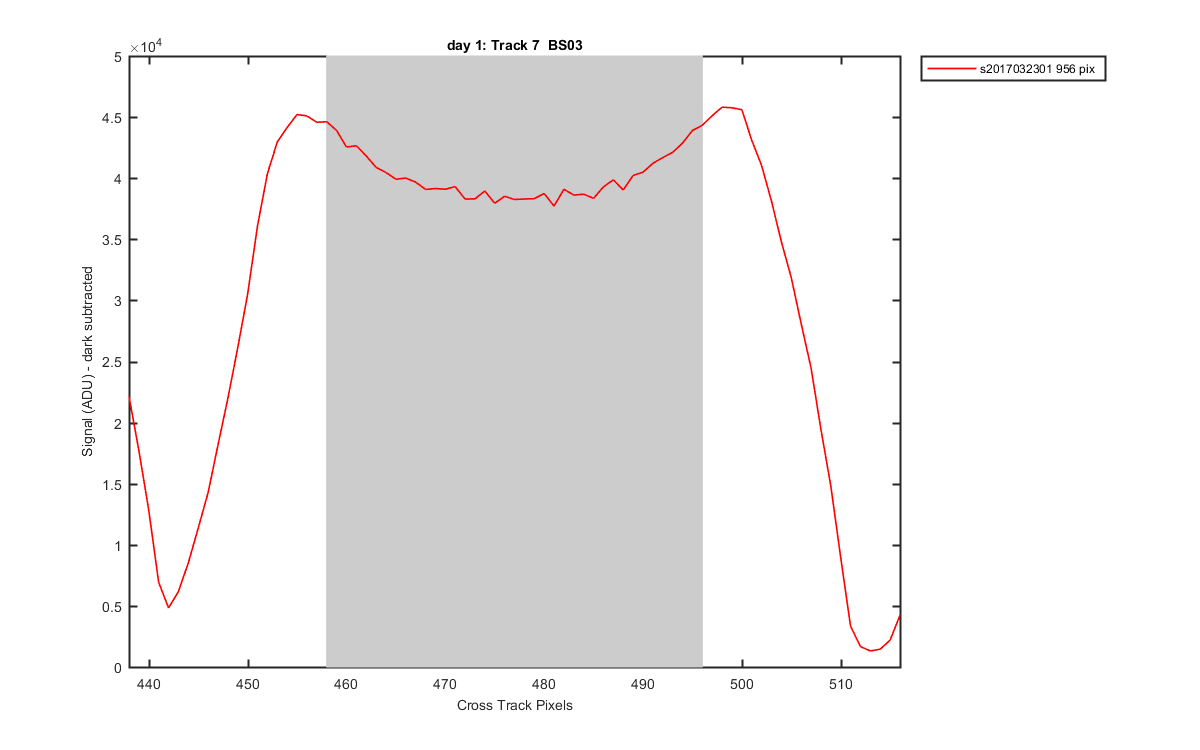
Figure 9
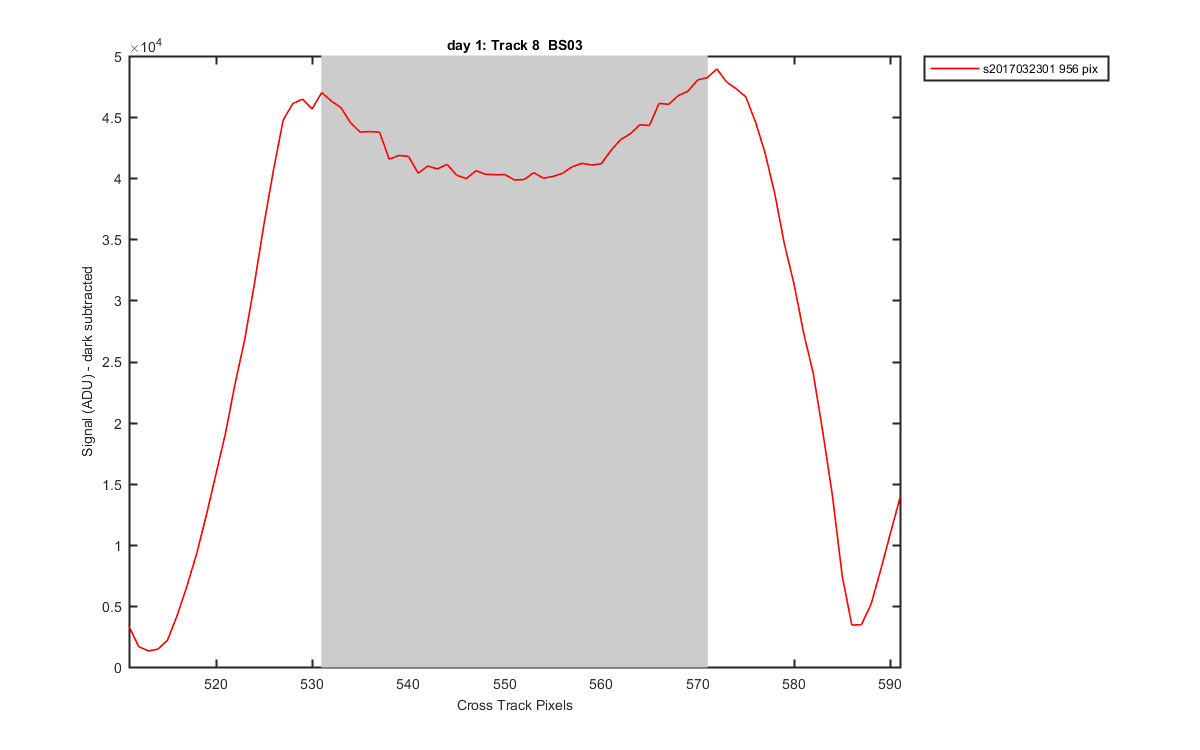
Figure 10
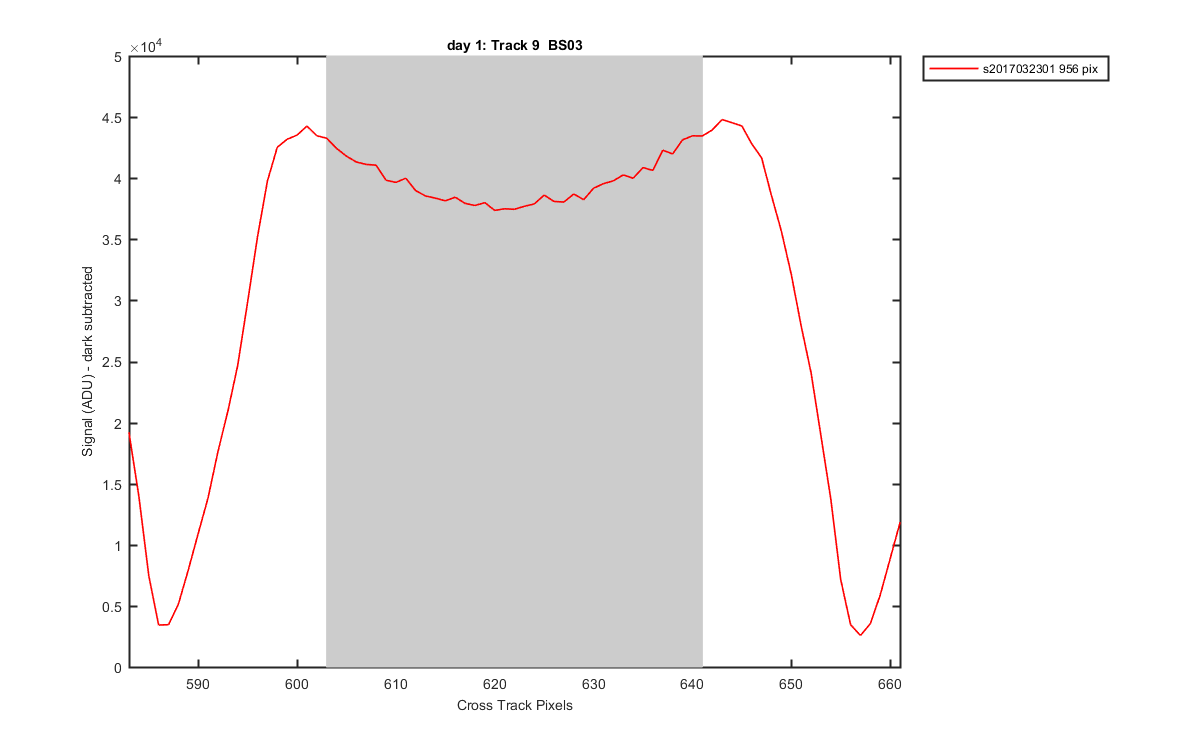
Figure 11
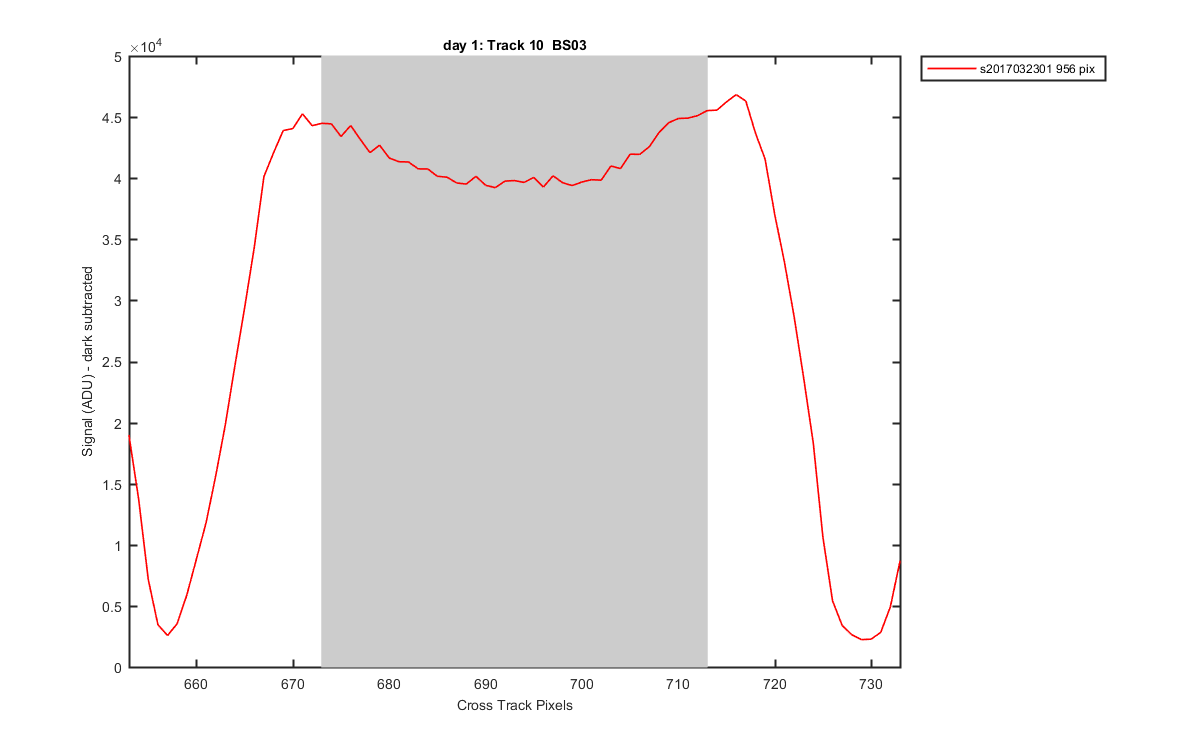
Figure 12
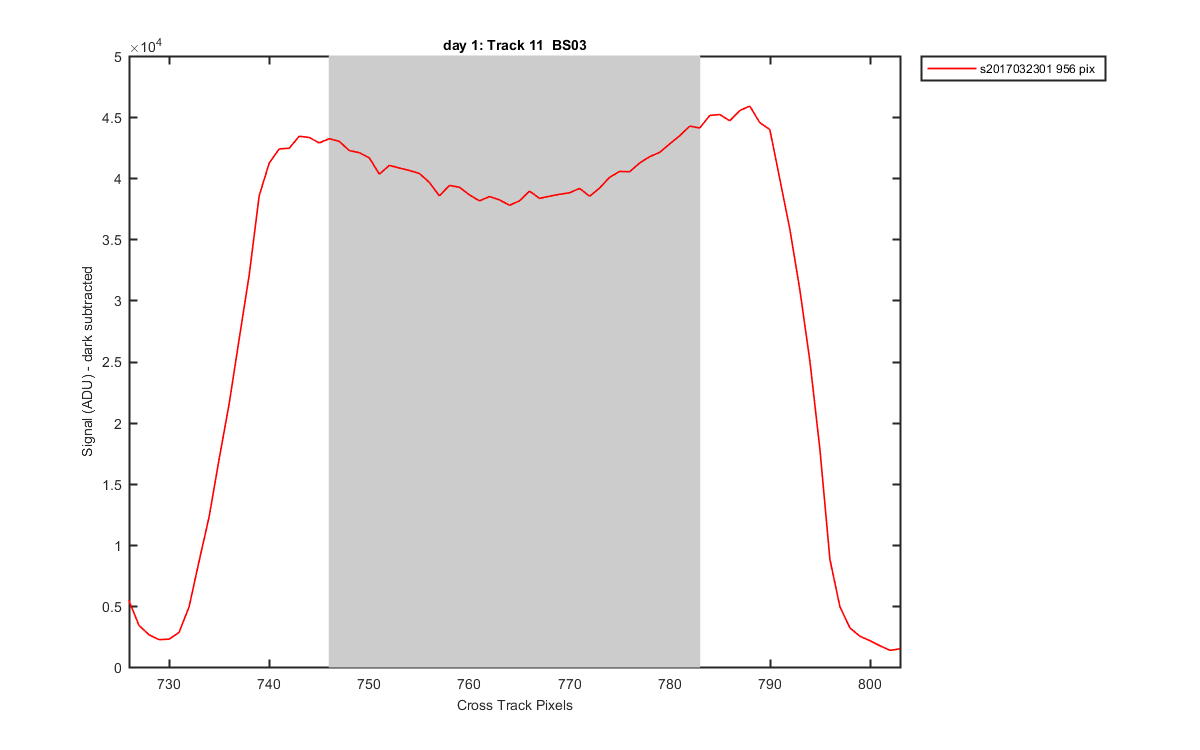
Figure 13
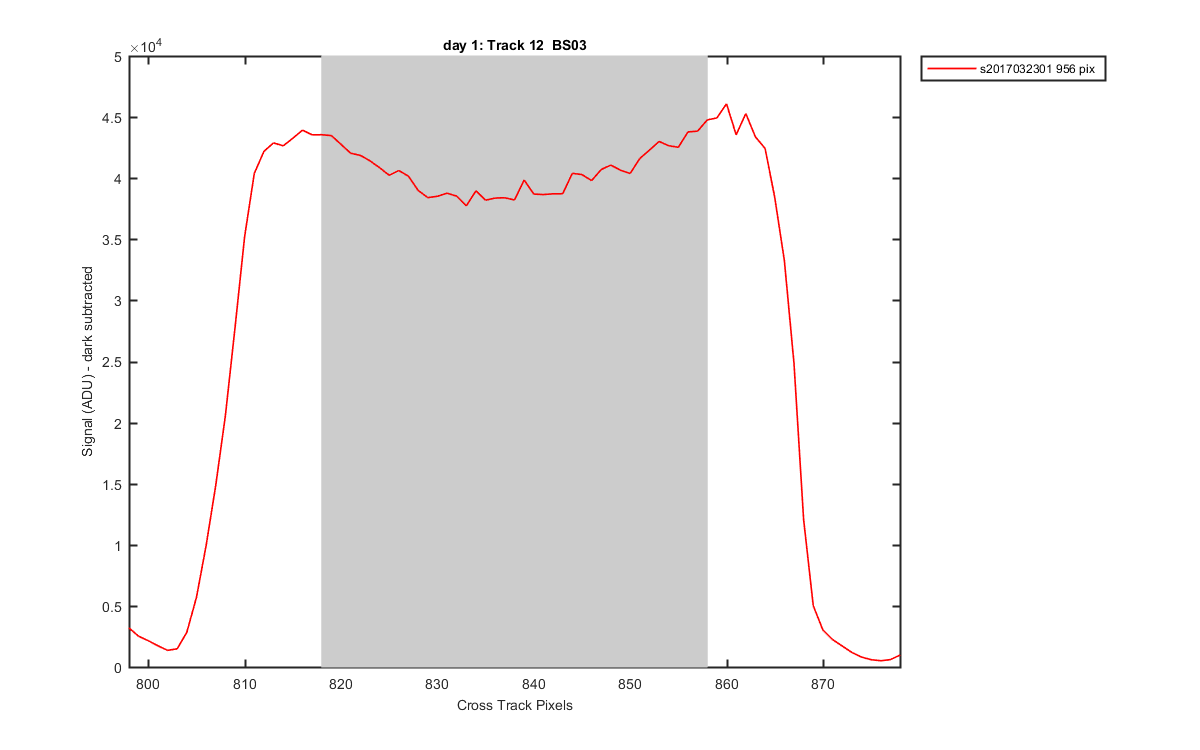
Figure 14
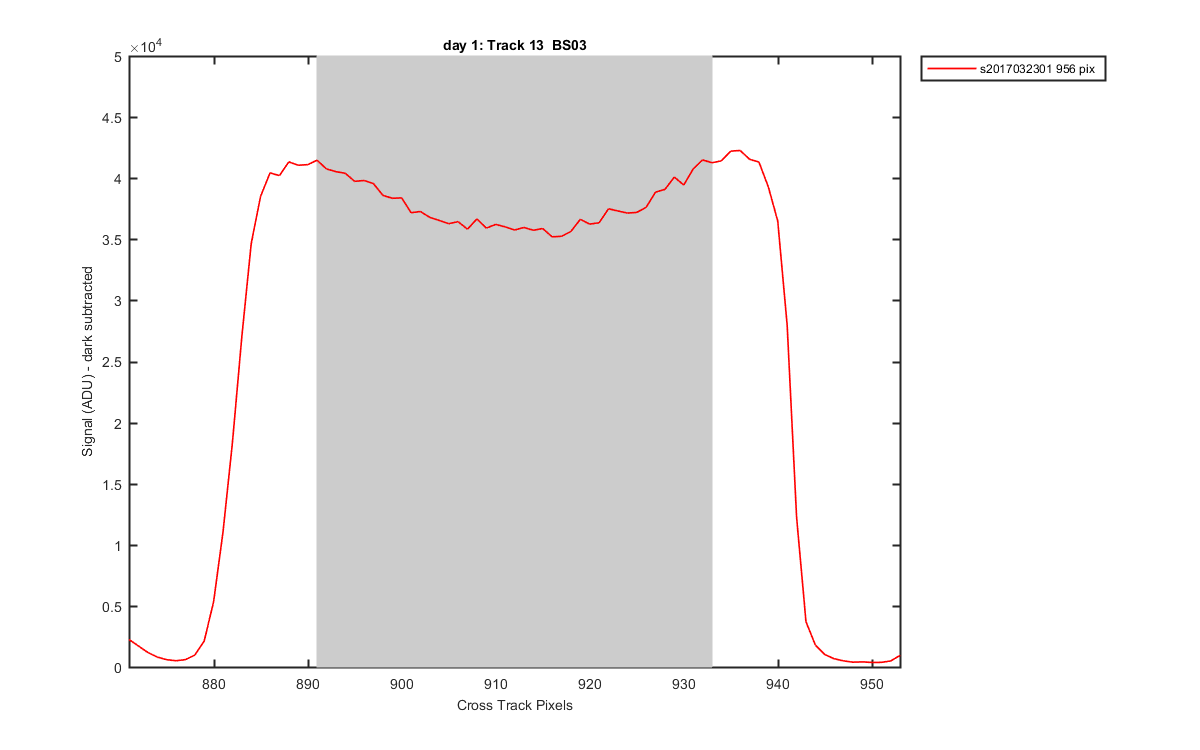
Figure 15