REVISION DATE: 04-Apr-2017 16:00:03
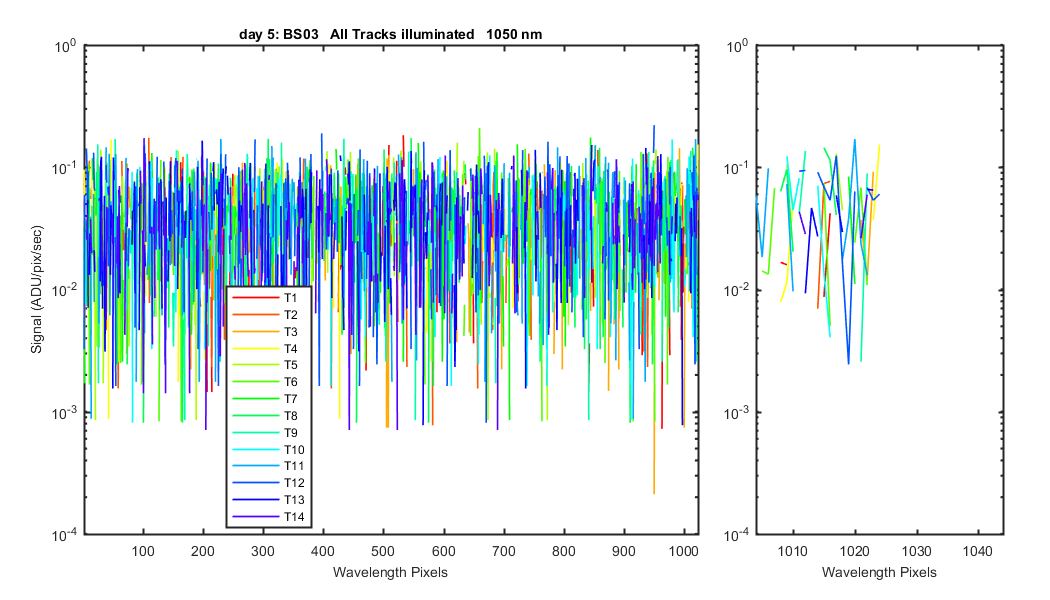
This shows the laser data collected by Mike on day 5. Data was collected with all tracks on. The first graph shows the track 7 laser data. And the second set compares the laser data for each track (when all the tracks are on)
Figure 1
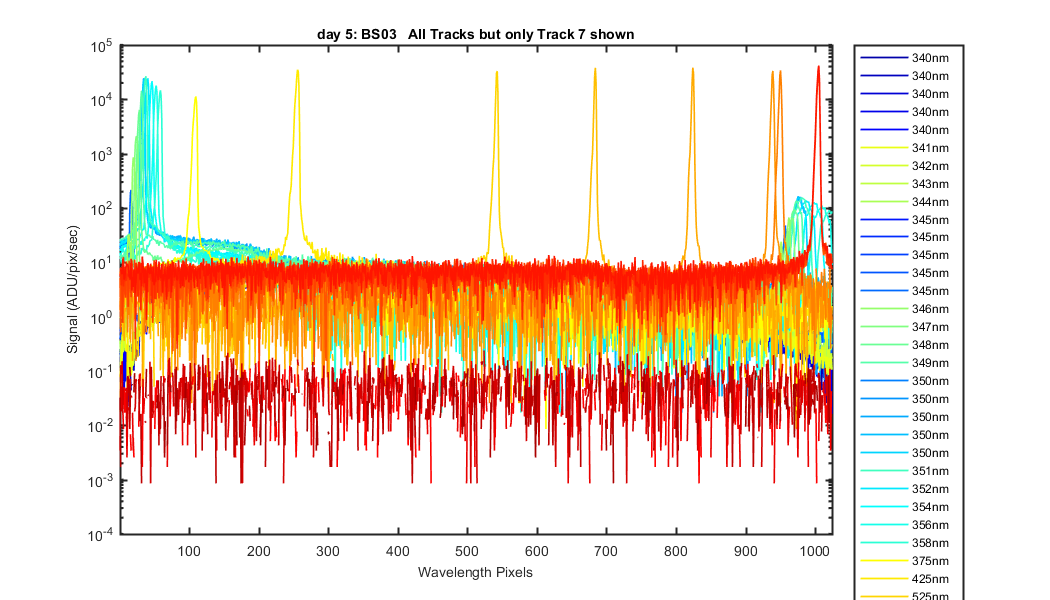
Figure 2
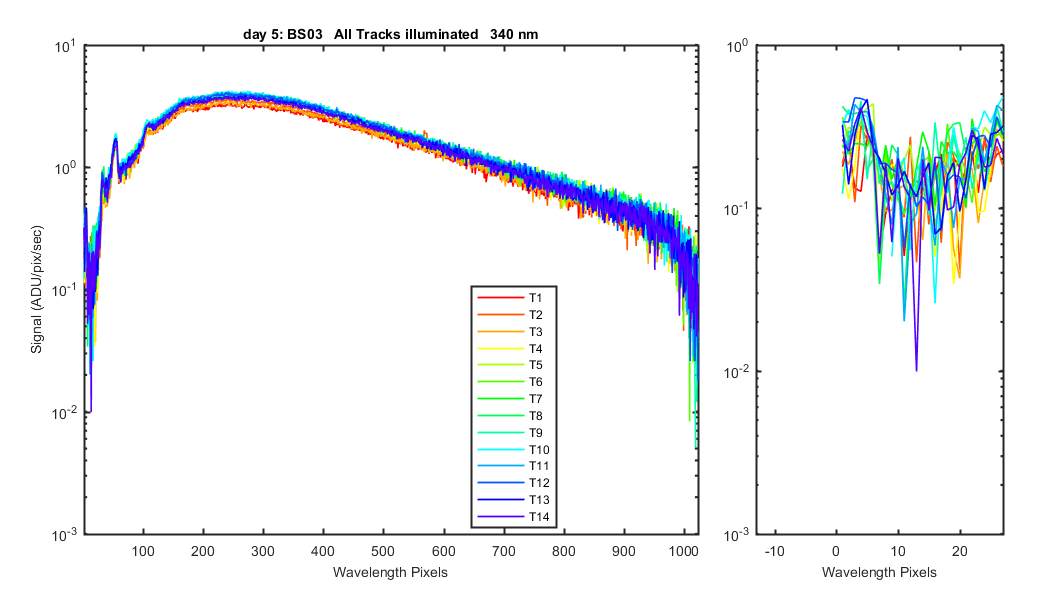
Figure 3
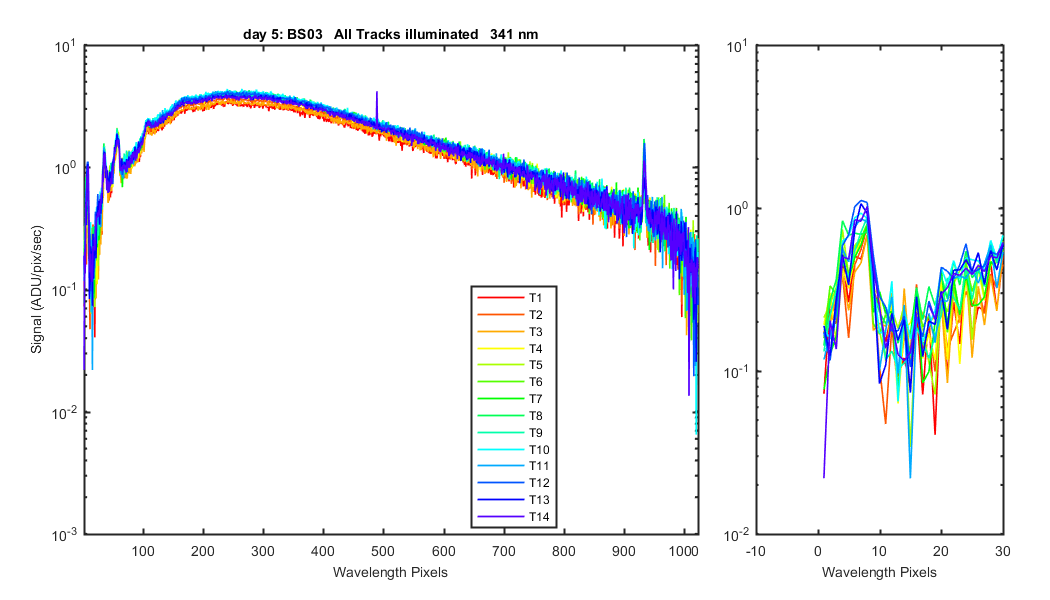
Figure 4
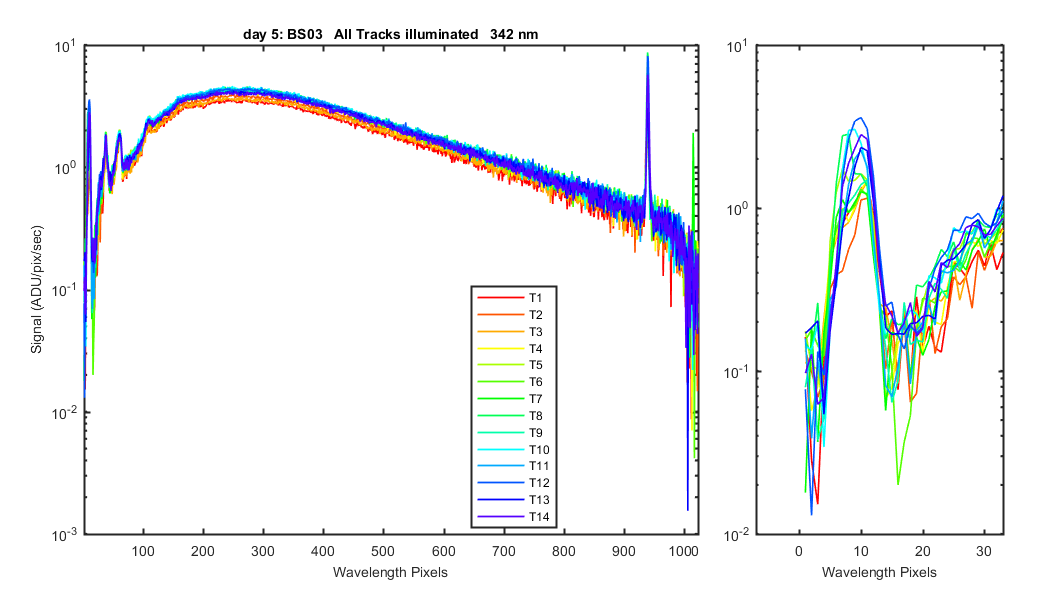
Figure 5
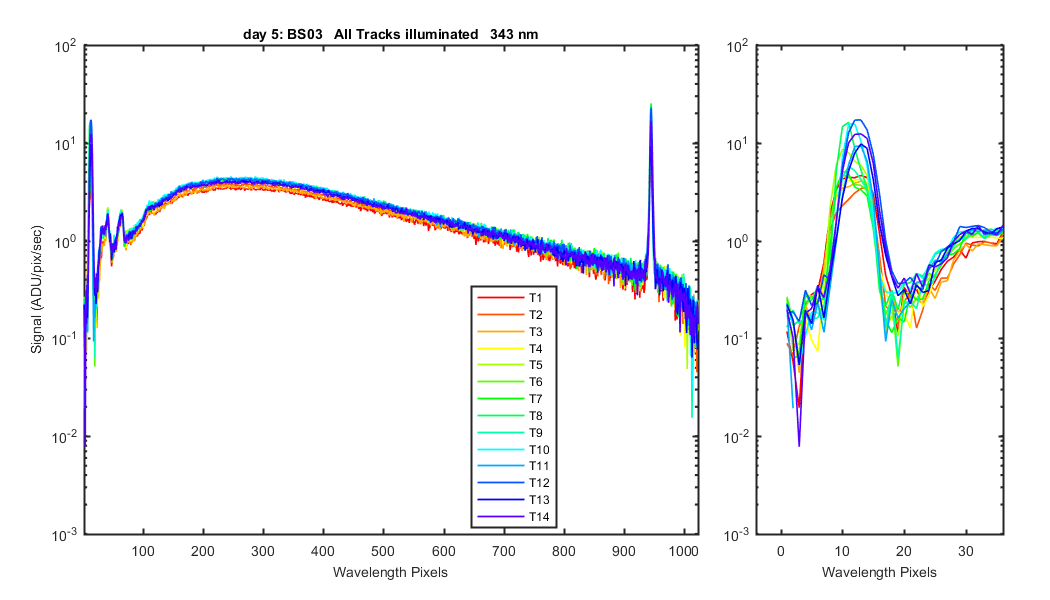
Figure 6
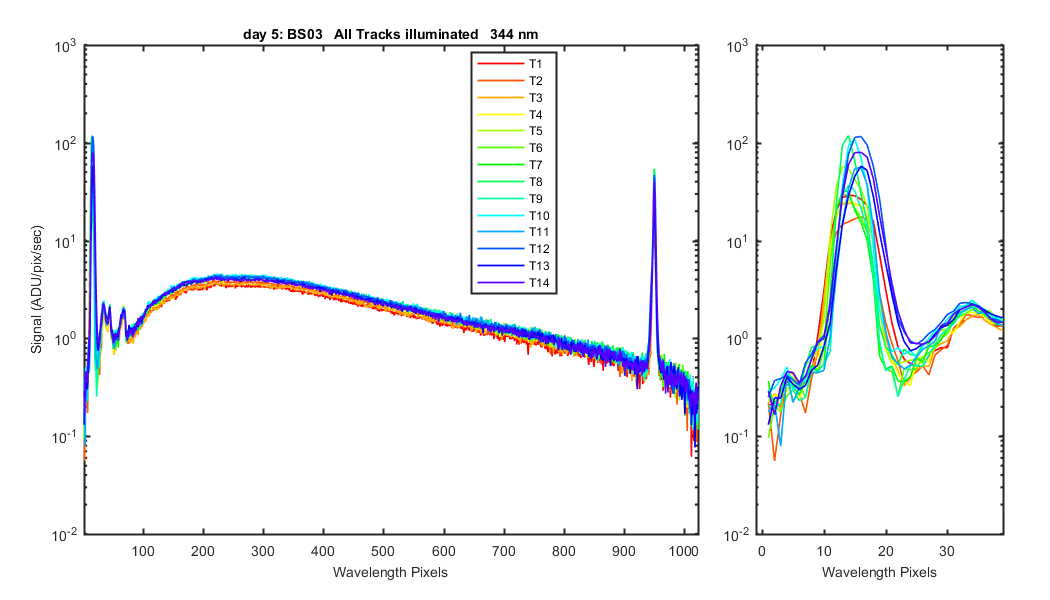
Figure 7
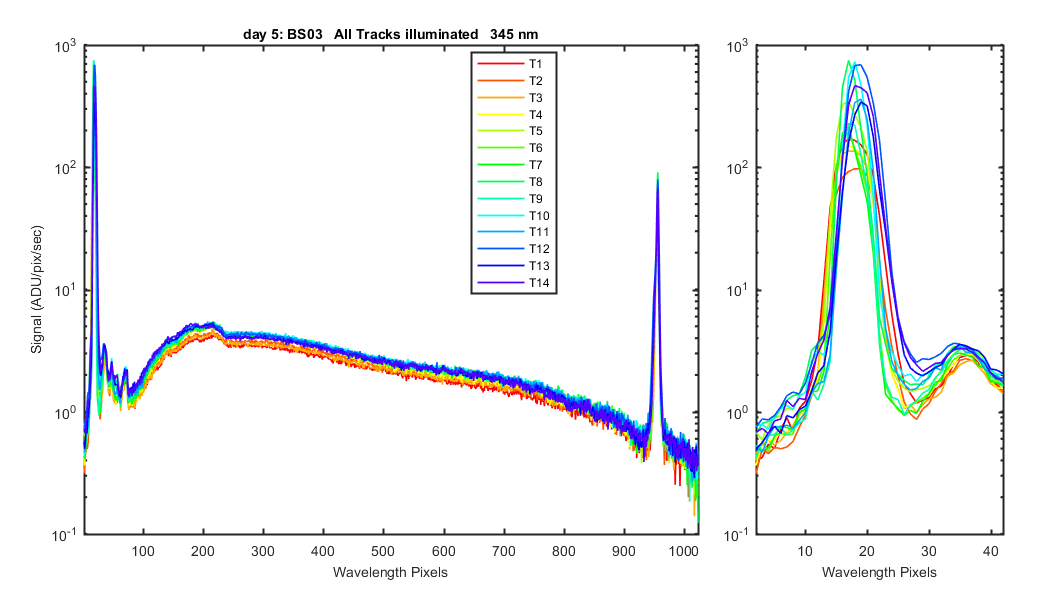
Figure 8
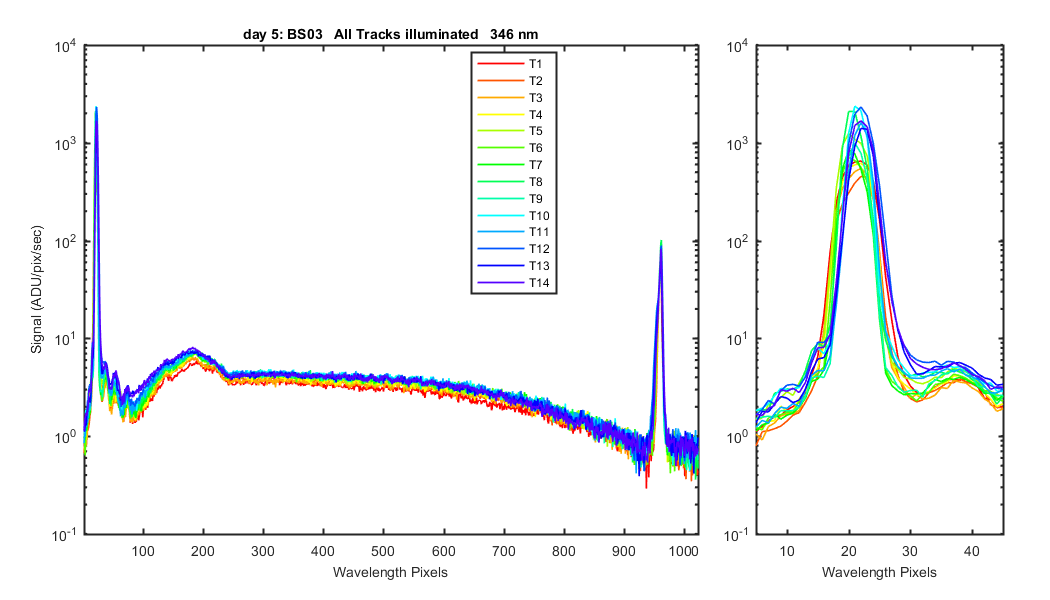
Figure 9
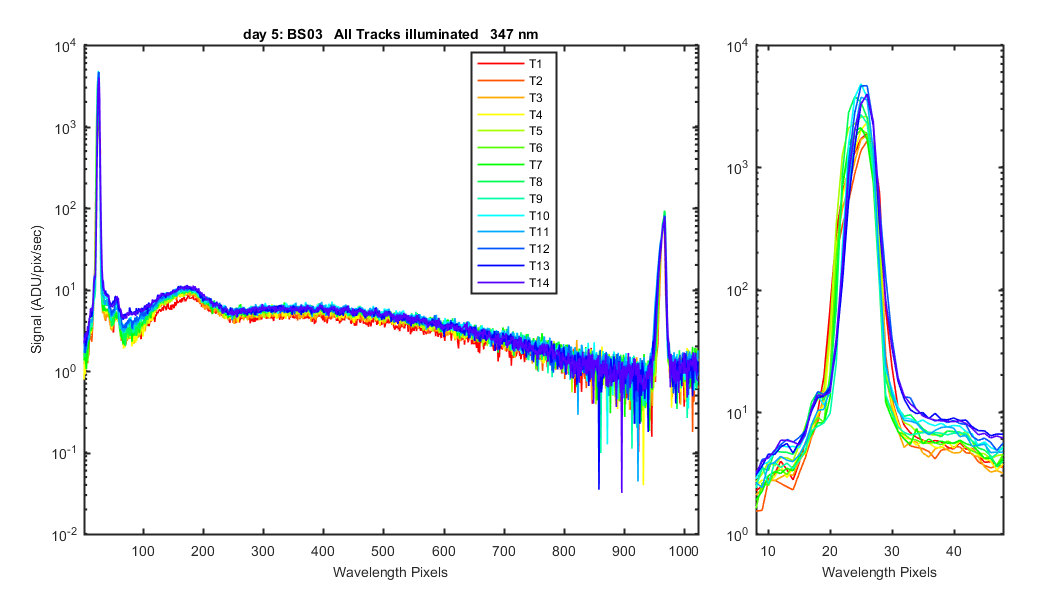
Figure 10
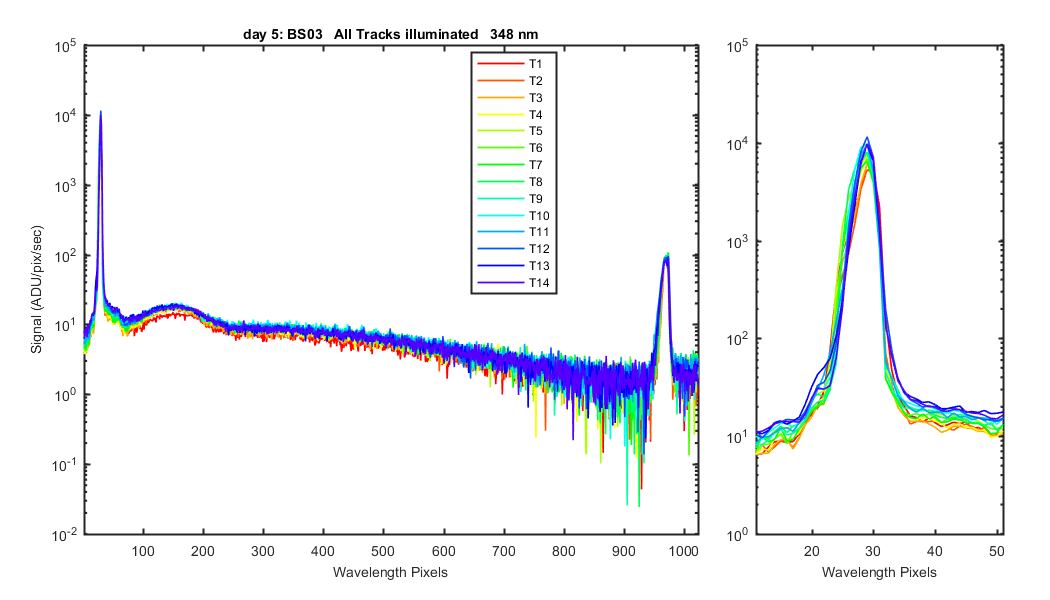
Figure 11
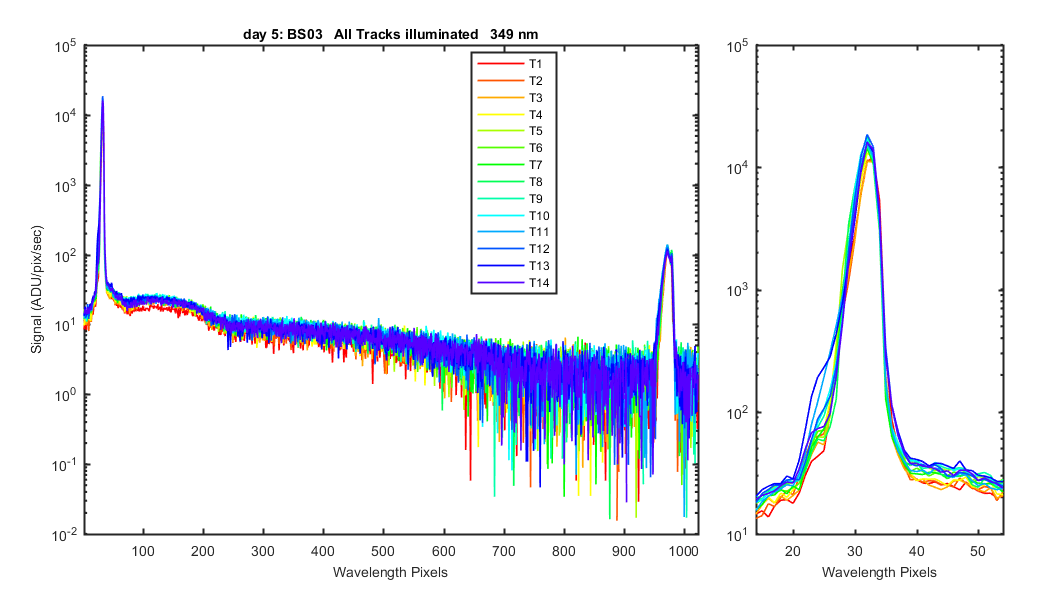
Figure 12
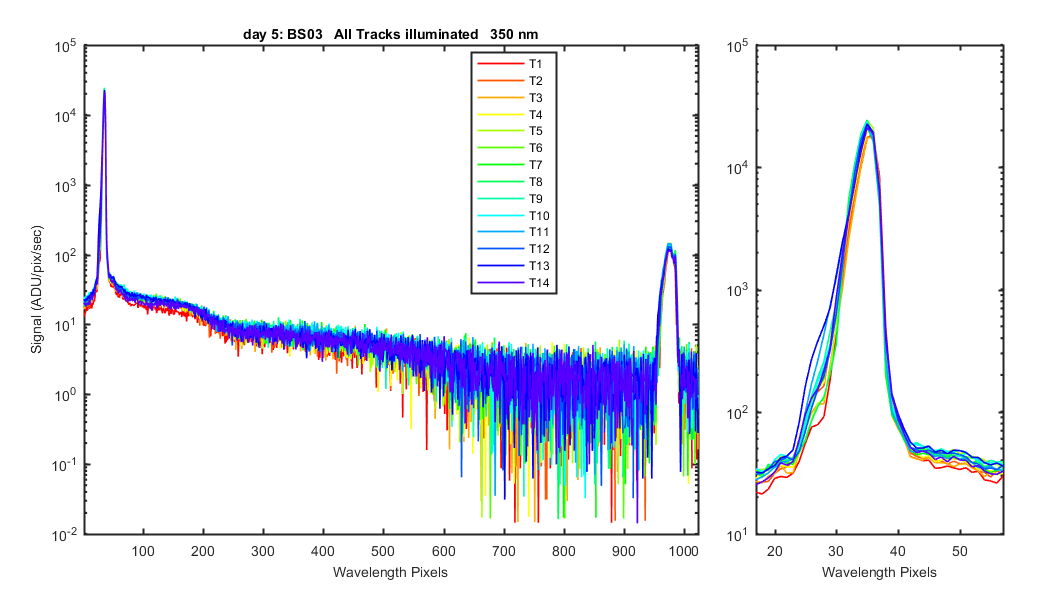
Figure 13
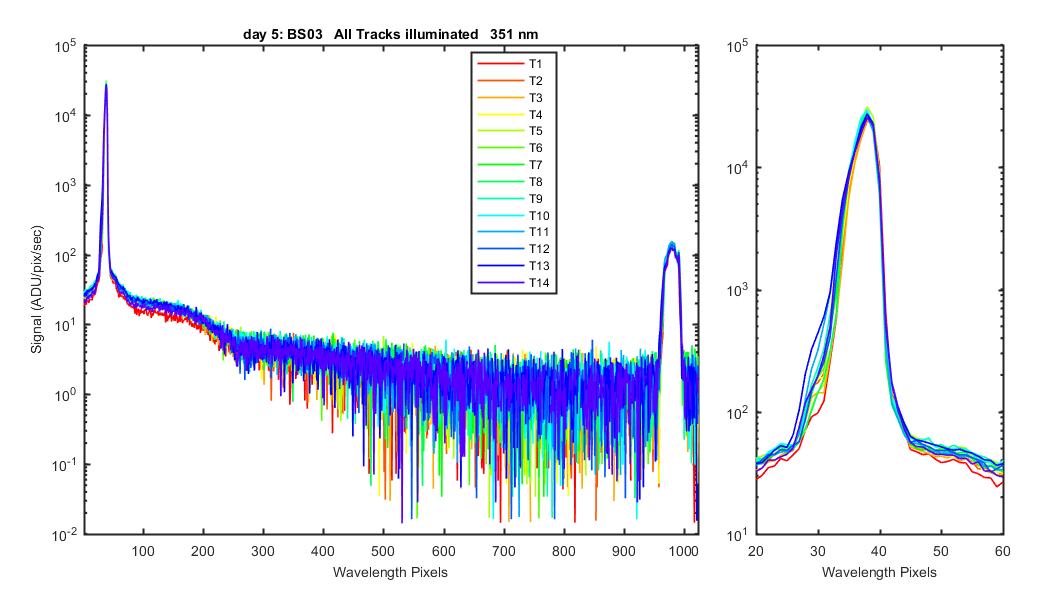
Figure 14
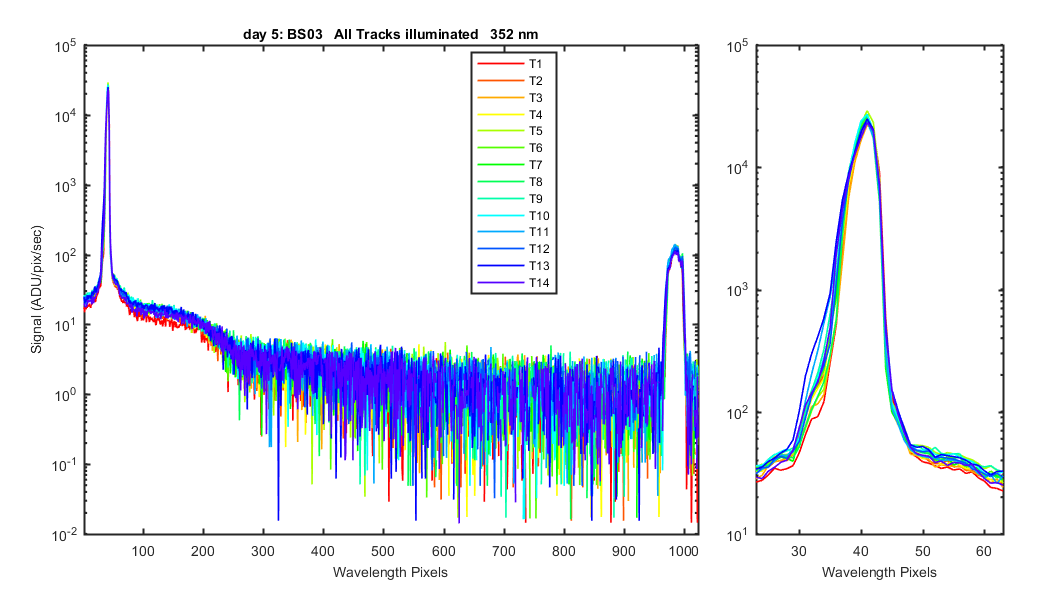
Figure 15
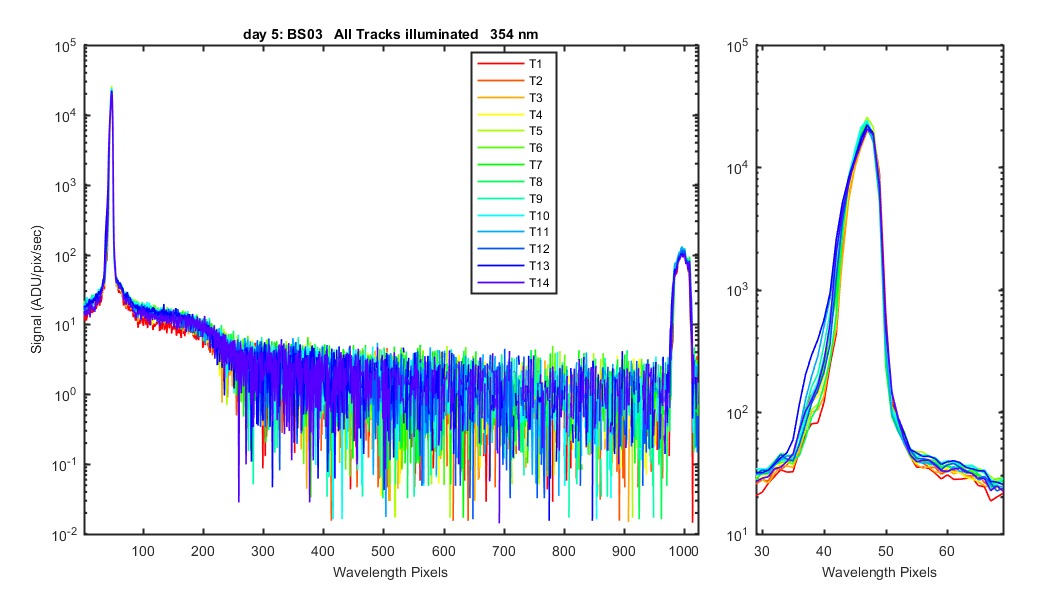
Figure 16
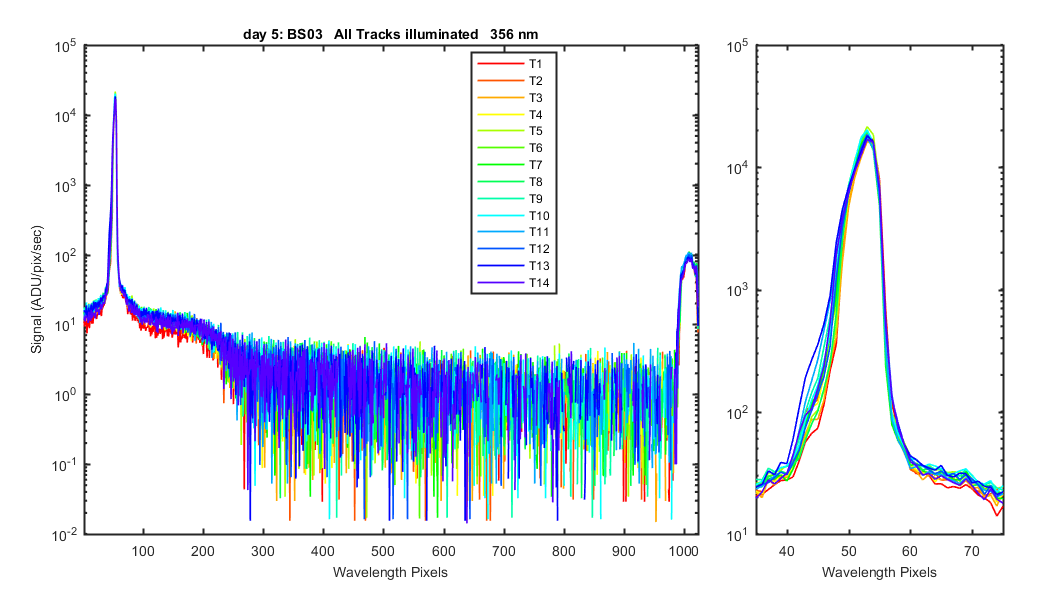
Figure 17
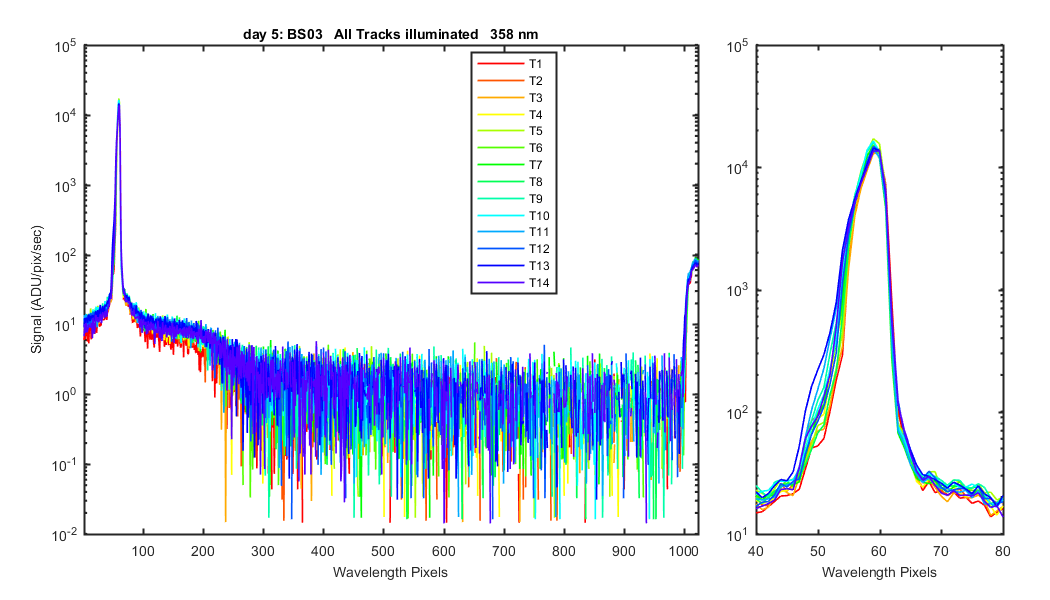
Figure 18
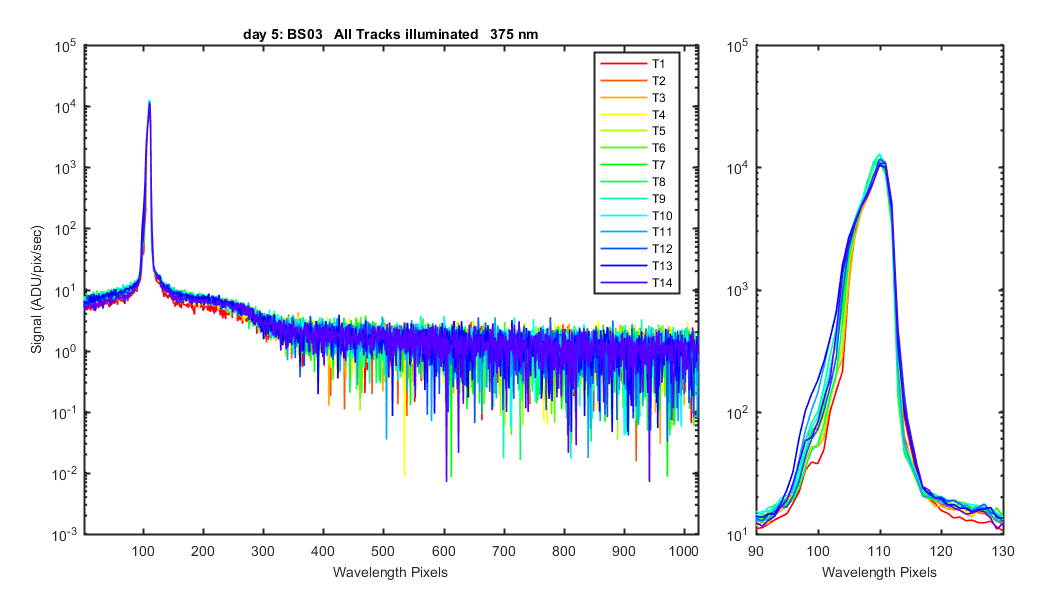
Figure 19
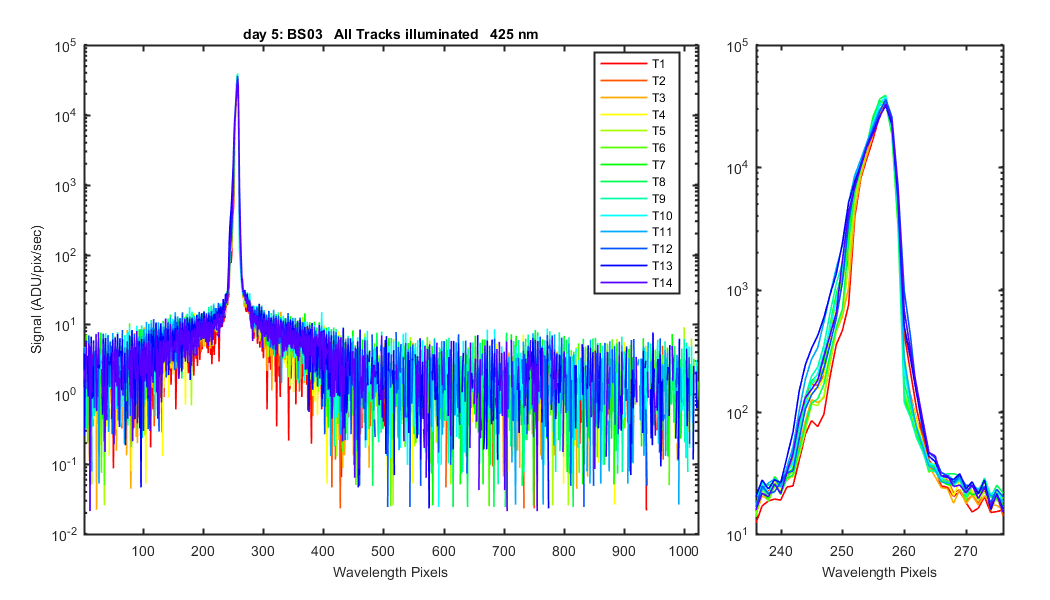
Figure 20
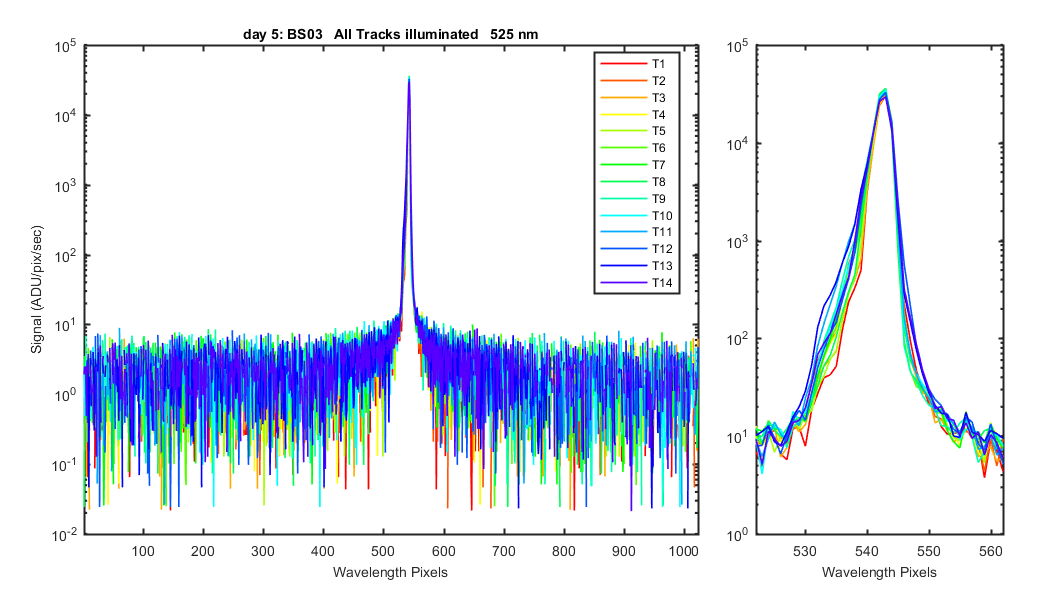
Figure 21
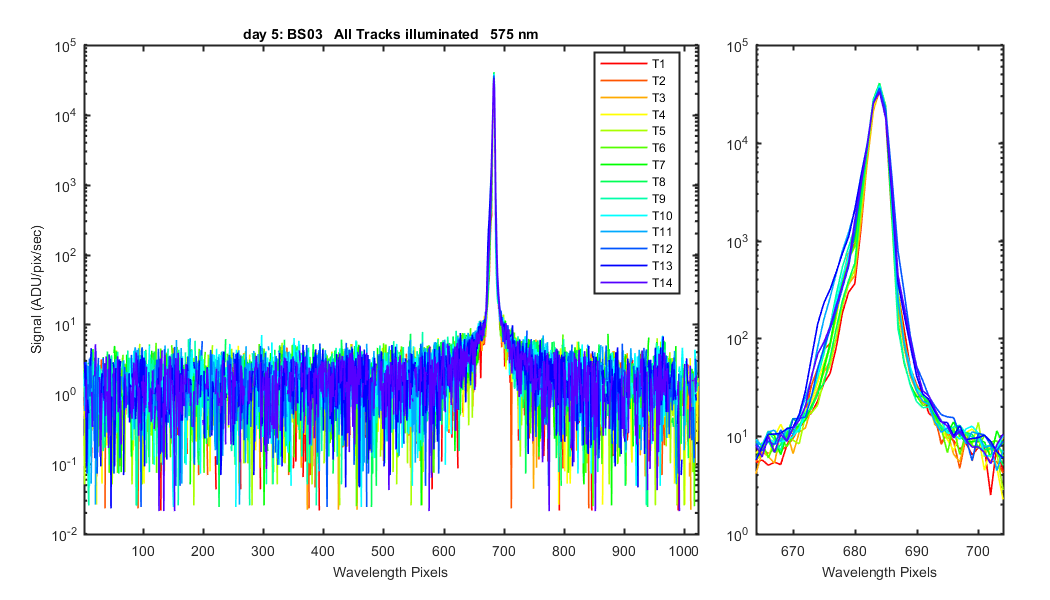
Figure 22
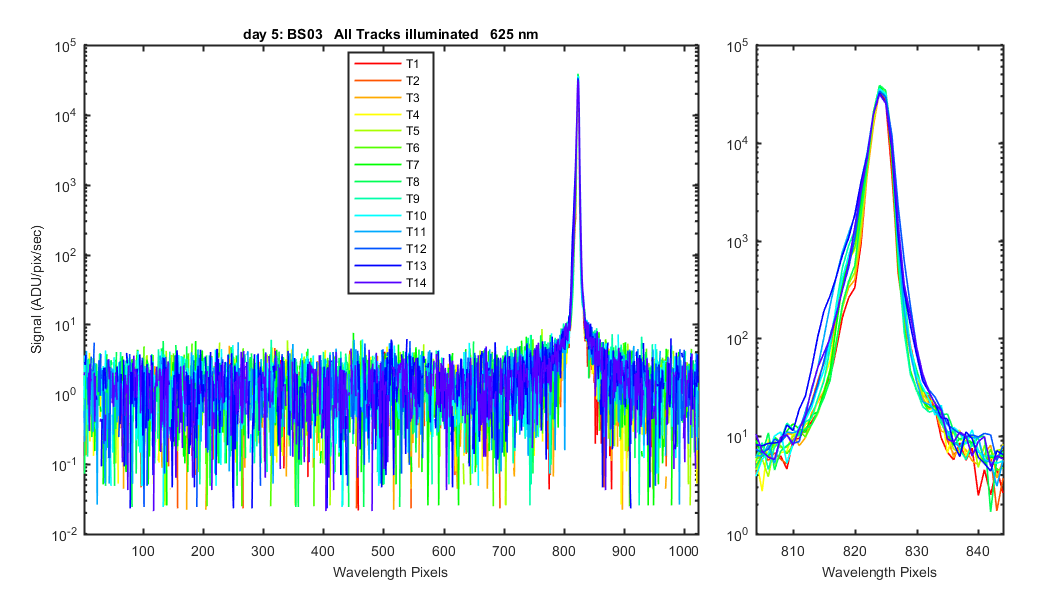
Figure 23
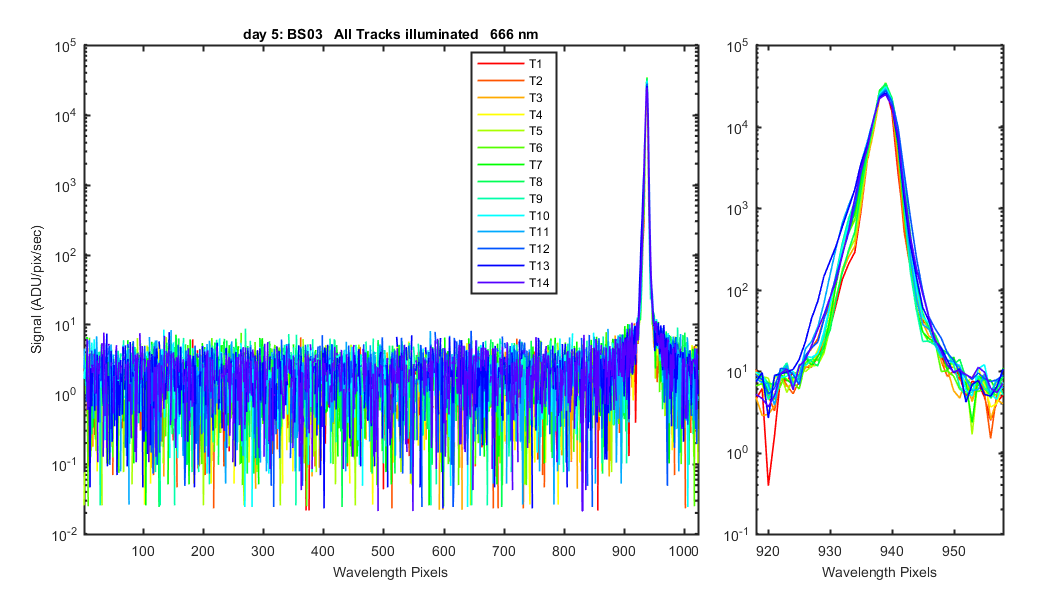
Figure 24
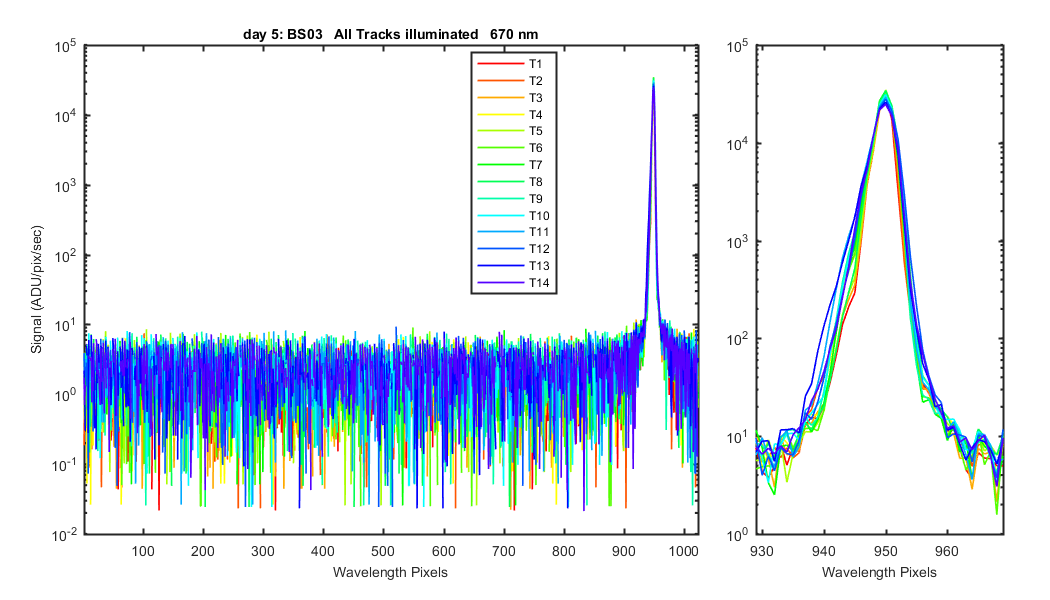
Figure 25
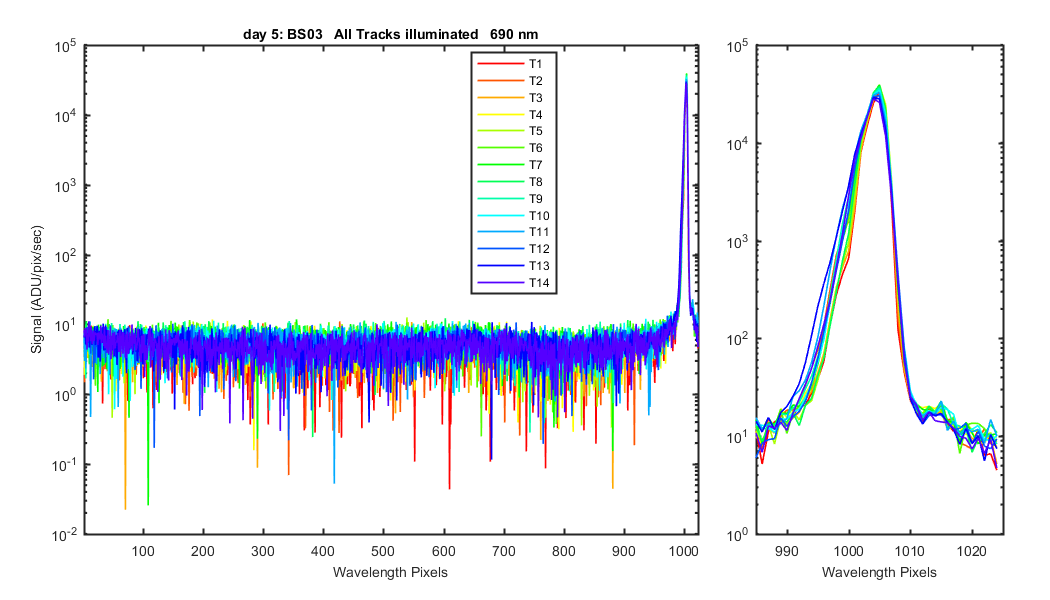
Figure 26
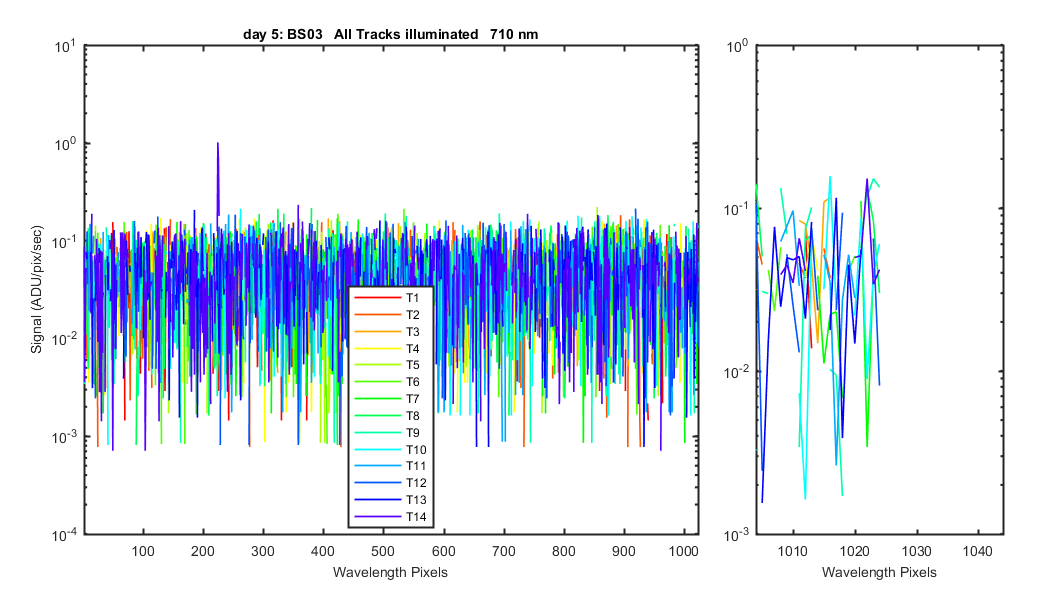
Figure 27
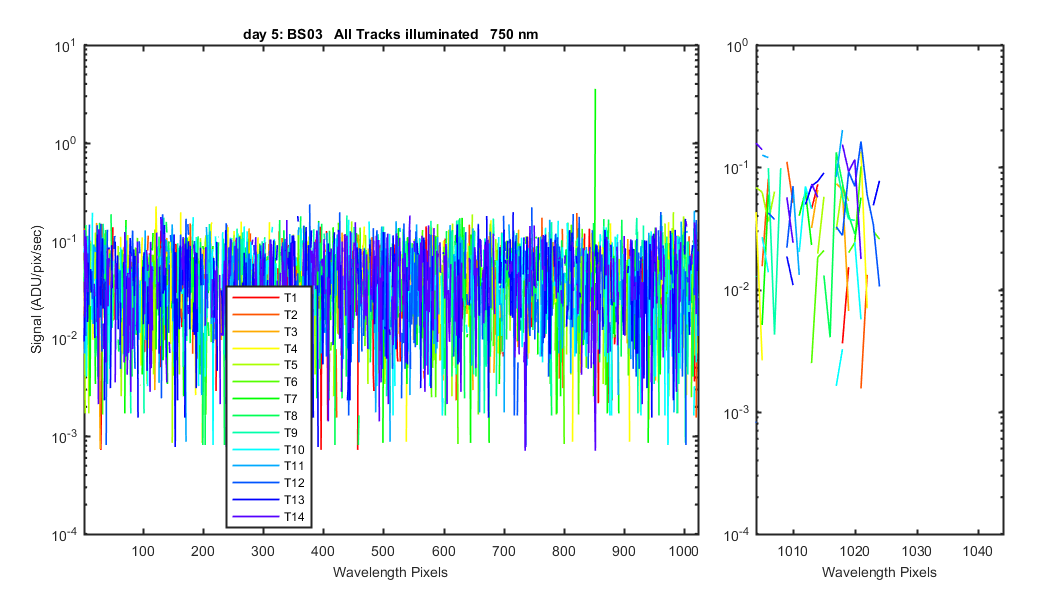
Figure 28
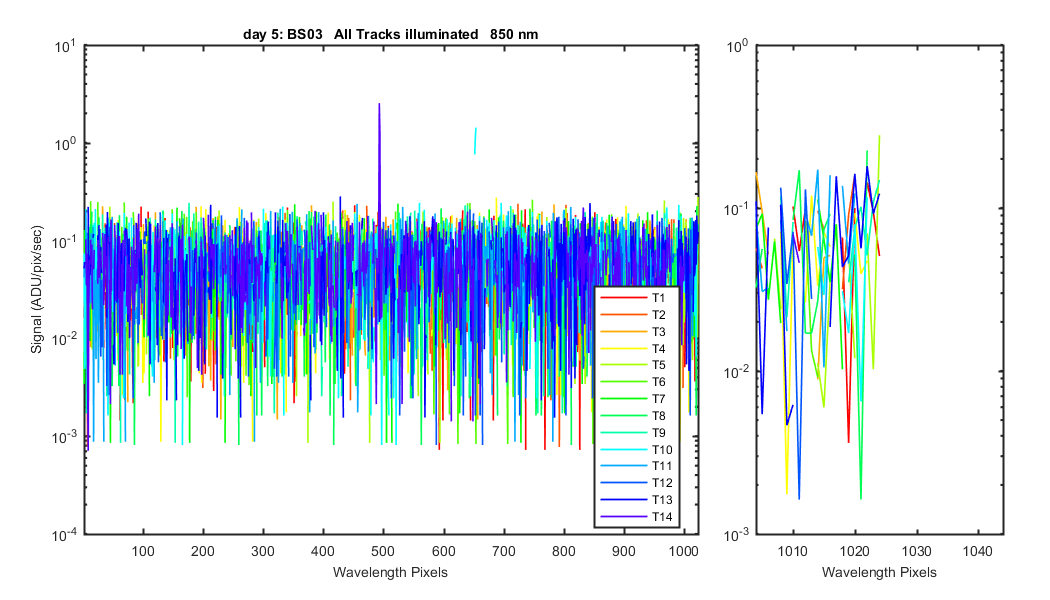
Figure 29
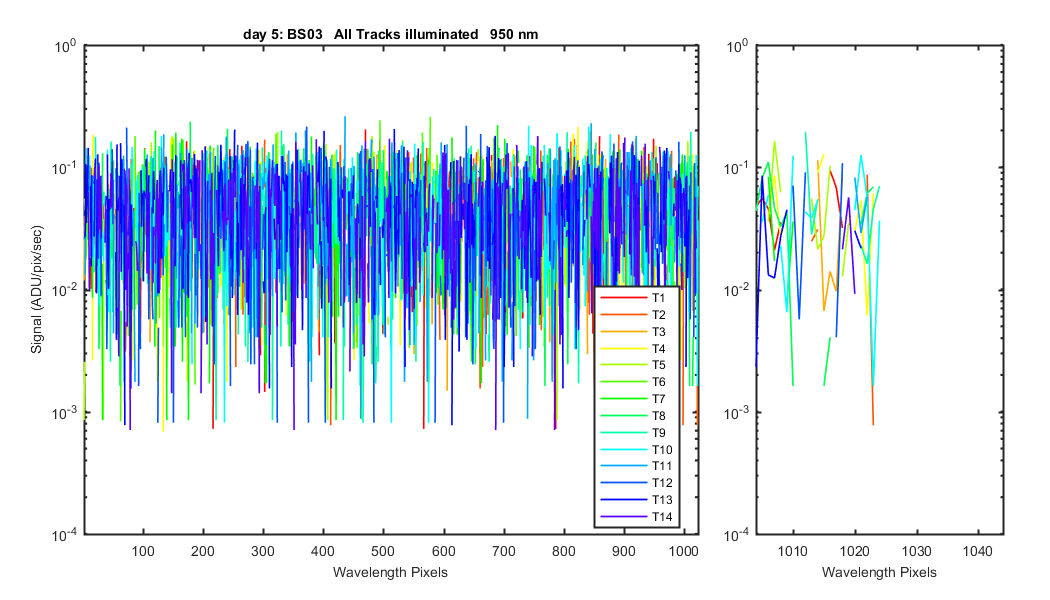
Figure 30