REVISION DATE: 29-Mar-2017 10:31:07
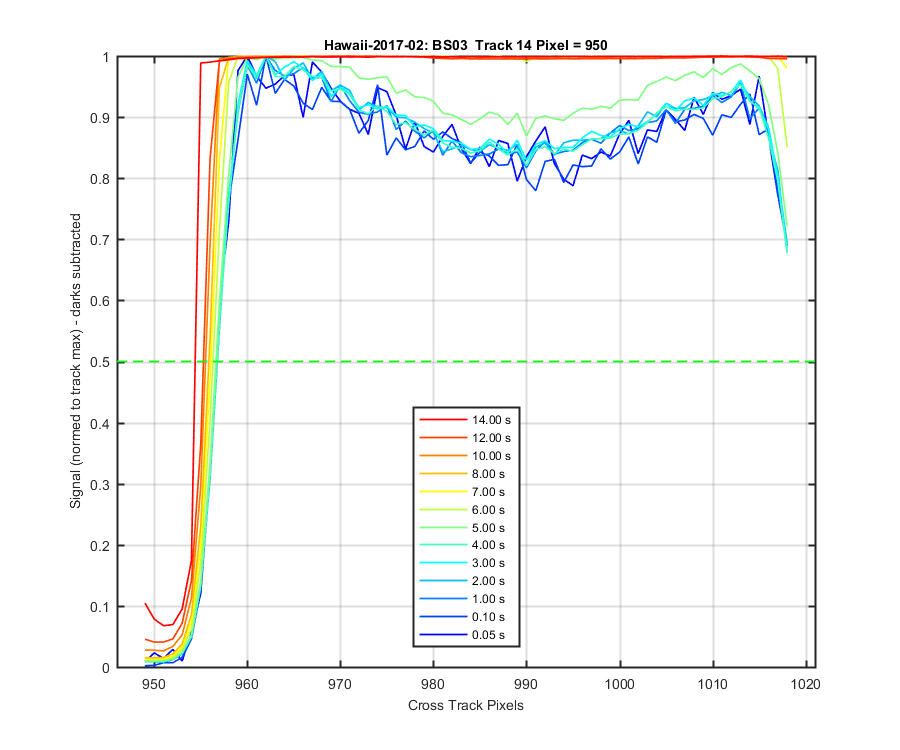
Mike wanted me to "plot the saddles normalized to 1=max? Im wondering how consistent the saddle shape stays as one fills up the ADU counter? I wonder if saturation shows up as the peaks of the saddle getting flattened, and if this happens at some ADU level somewhere less than the full 64k ADU level? The graphs below are taken from the program that looks for track movement. But it does what I want which is normalize each track by the max.
Looks at track movement and saddle shape for satuated data collected. For each file and track I normalized the track to its max value and plotted this for each file. Then I found where the right and left edge of each track crossed the 50% line. These track positions are plotted on the right panel below.
Figure 1
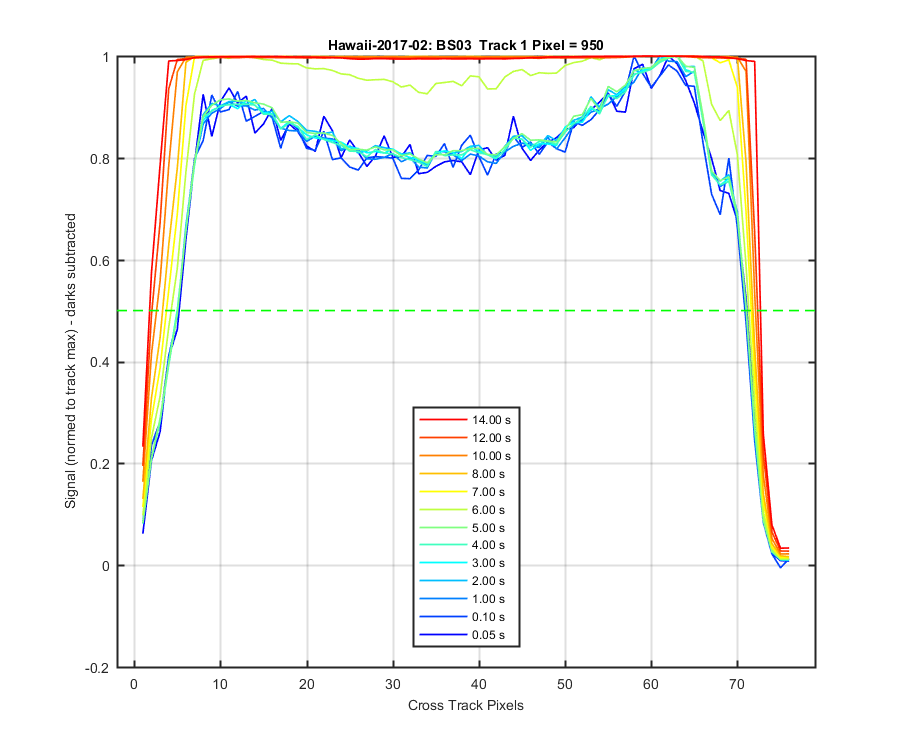
Figure 2
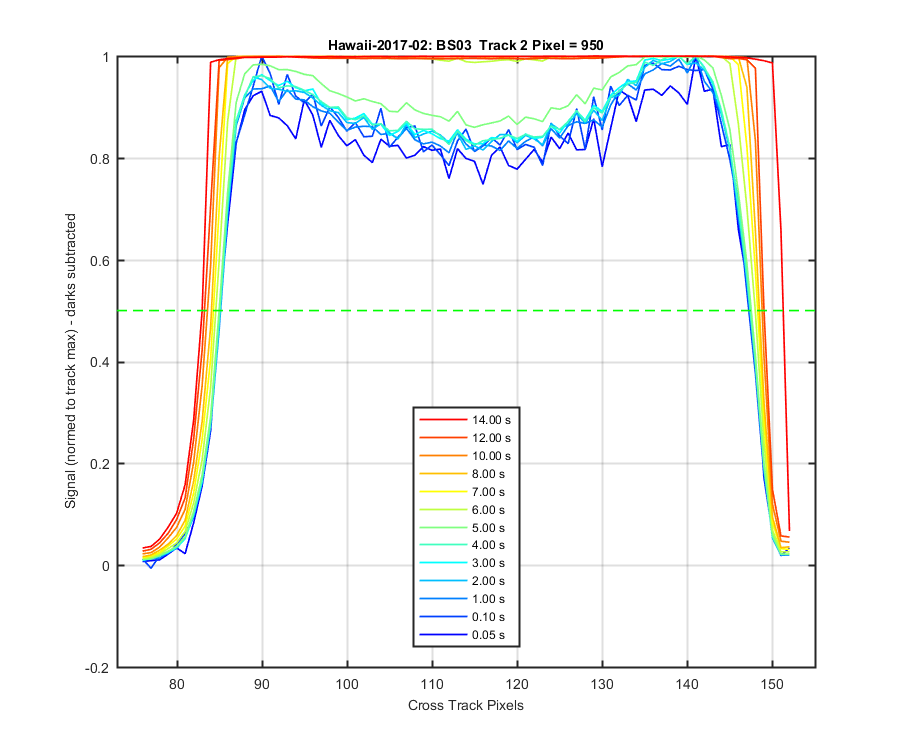
Figure 3
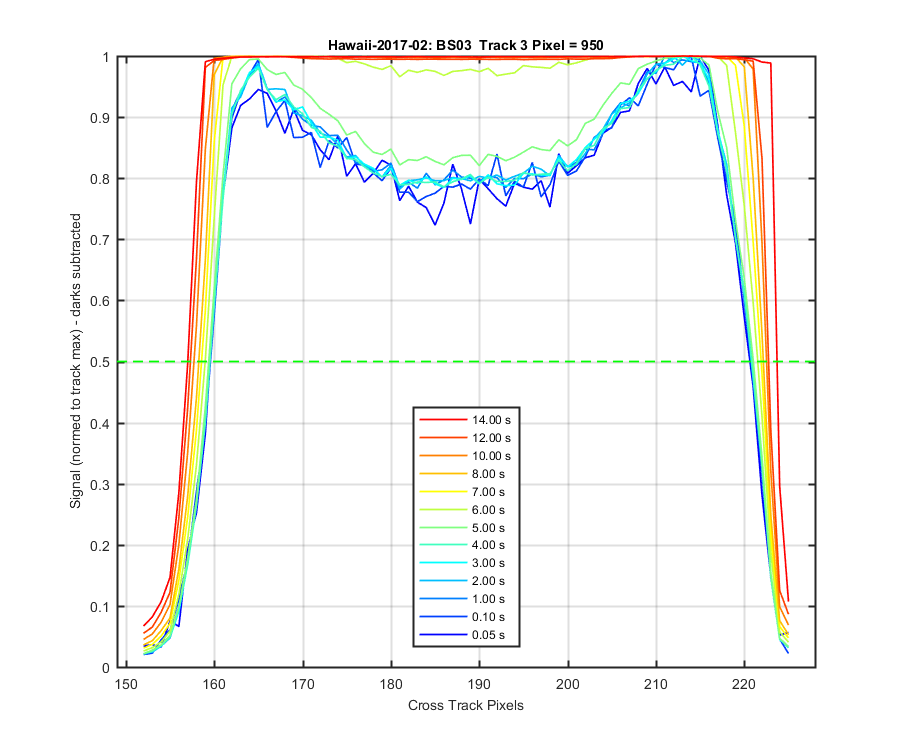
Figure 4
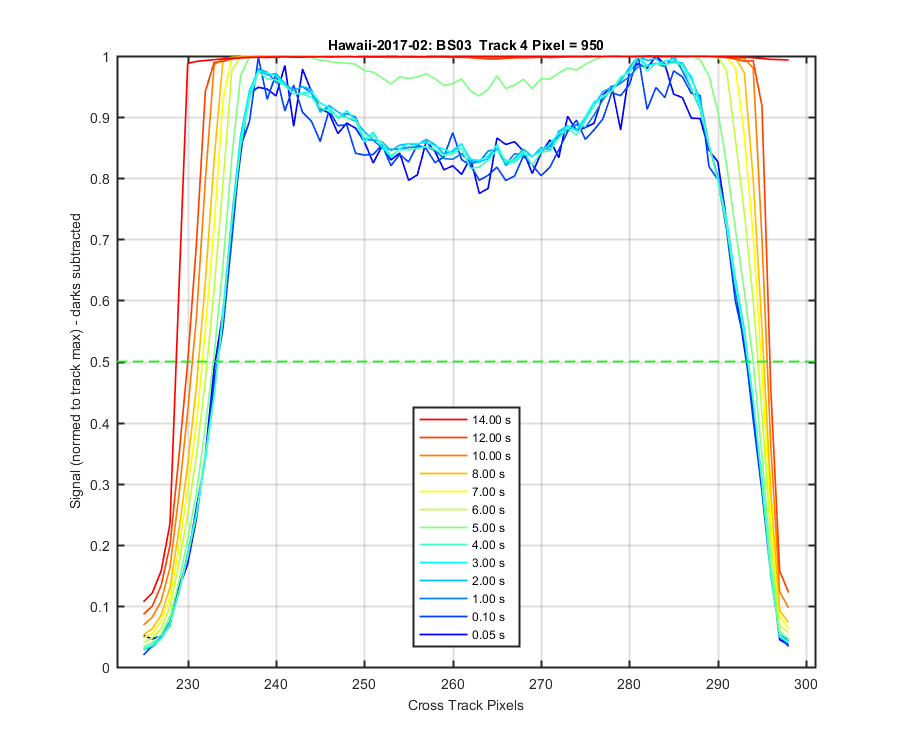
Figure 5
Figure 6
Figure 7
Figure 8
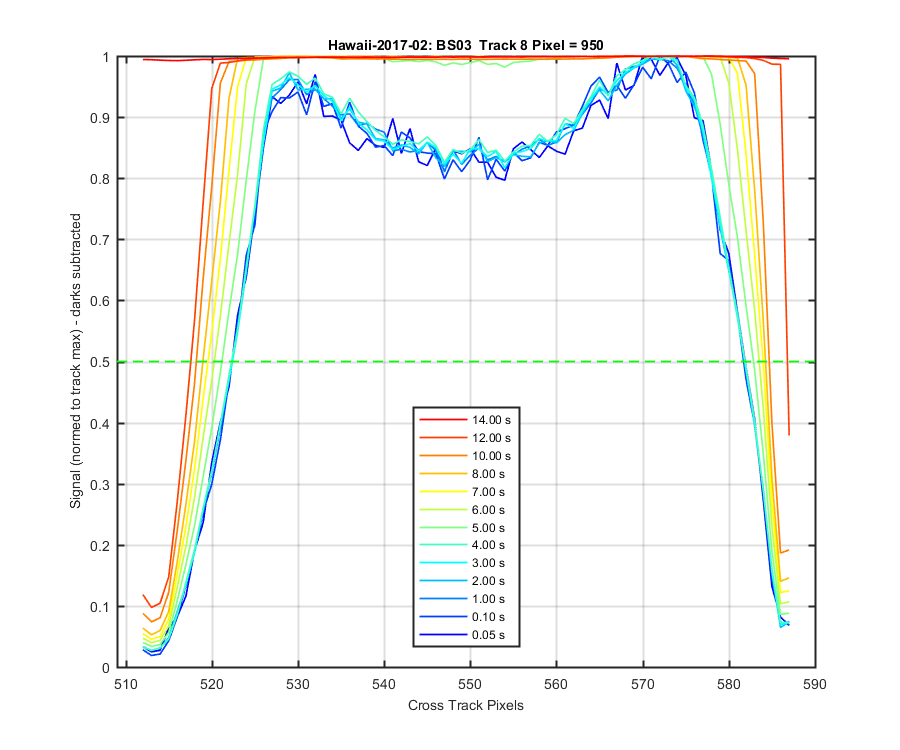
Figure 9
Figure 10
Figure 11
Figure 12
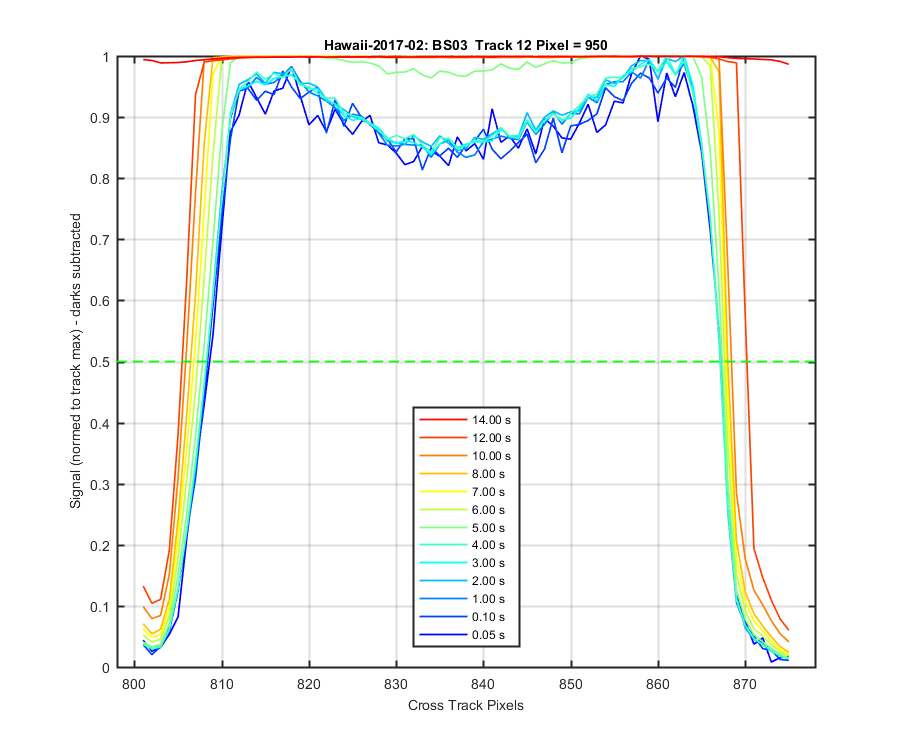
Figure 13
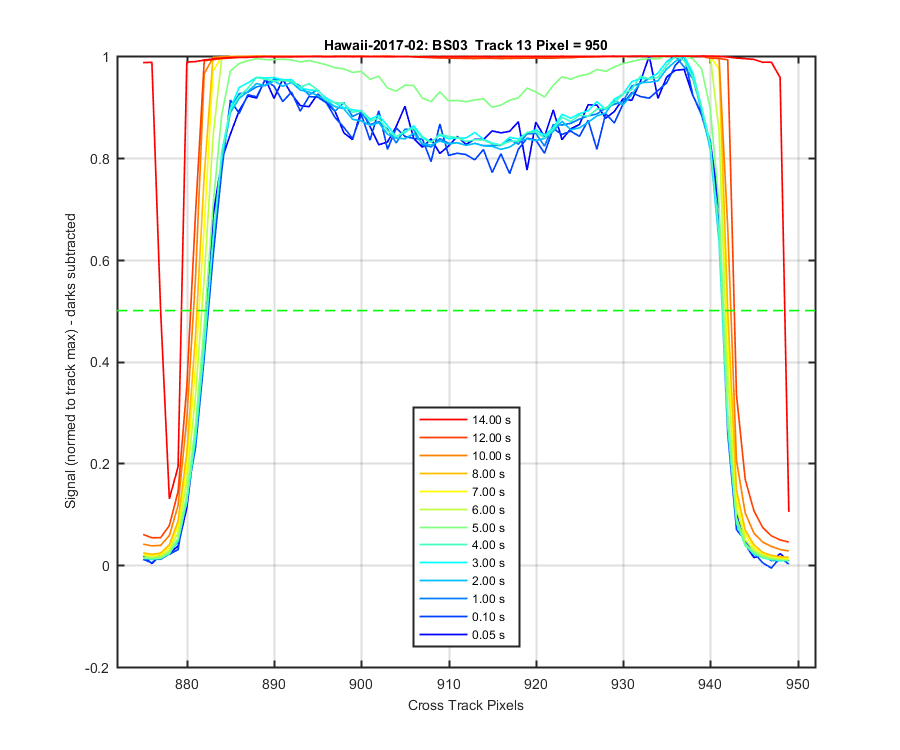
Figure 14