REVISION DATE: 01-Aug-2017 15:32:15
Initially to process the day01-03 data I used the BS03cfg001 track definitions. I created this graph to see if the definitions from the Resonon data sets worked with the new data sets. And it looks like they do. YEA. This means very little track movement. An interestingly it also shows a saddle shape change when the iris/reducers are installed. The following graphs show the track definition for each track zoomed in. The last graph shows a more detailed view of the day 1 data when the iris where installed.
Track pixels:
Track:  1       2       3       4       5       6       7       8       9      10      11      12      13      14
Left:   13      93     166     243     315     386     458     531     603     673     746     818     891     964
Right:  58     135     210     280     353     425     496     571     641     713     783     858     933    1010
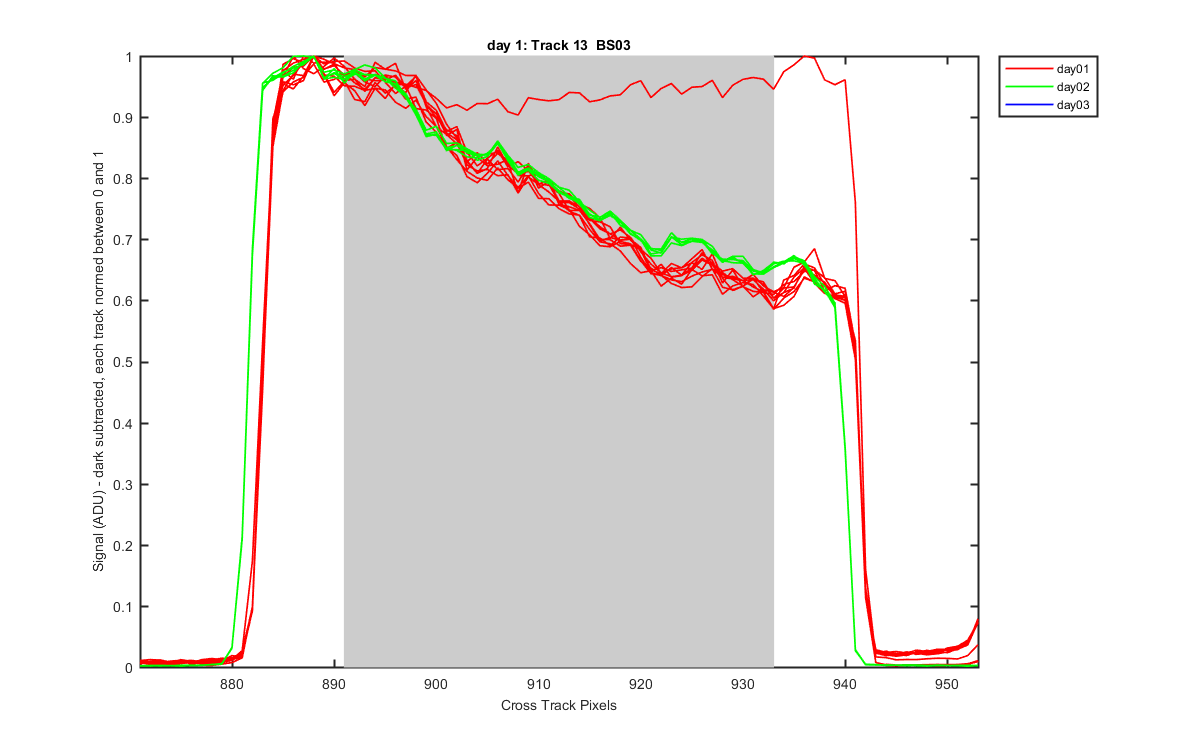
Plots of all the days data. With each track from each file normalized between 0 and 1. Note also from day01 to day02 the tracks moved their position a little bit to the left. For track 1 it is about 1.7 pixels. For Track 9 its about 1.5 pixels. For Track 11 its about 1.4 pixels. For Track 13 its about 1.65 pixels.
Figure 1
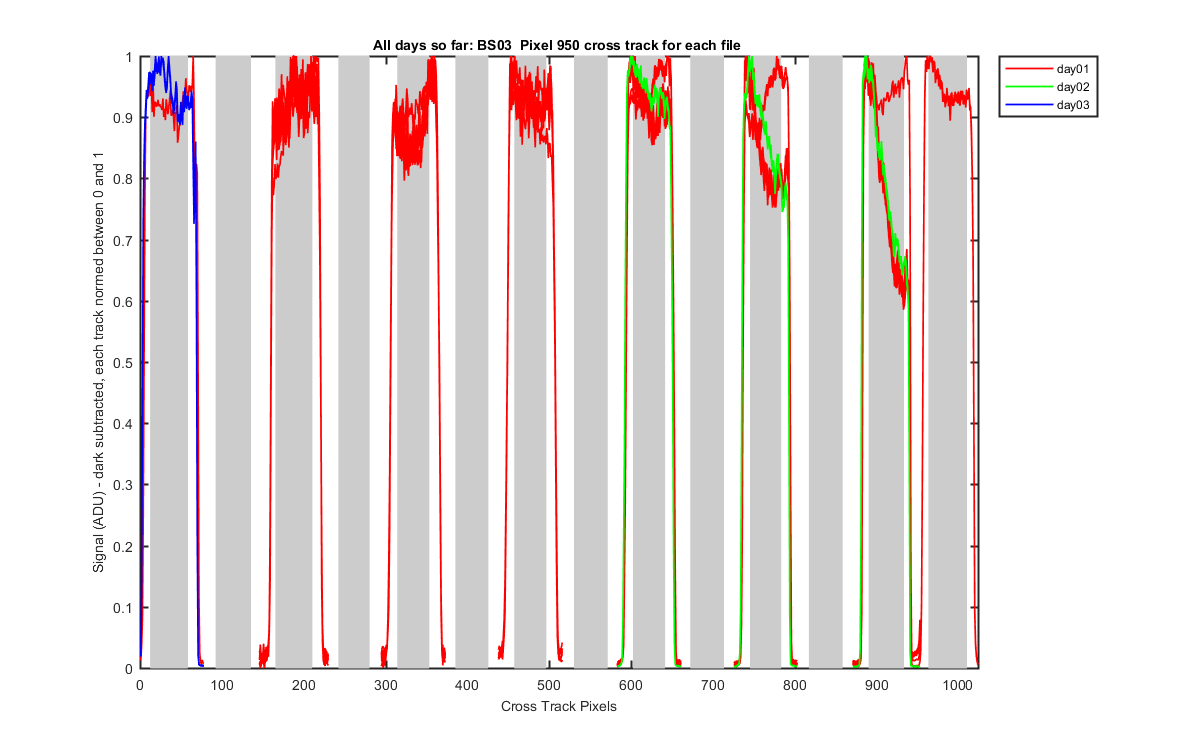
Figure 2
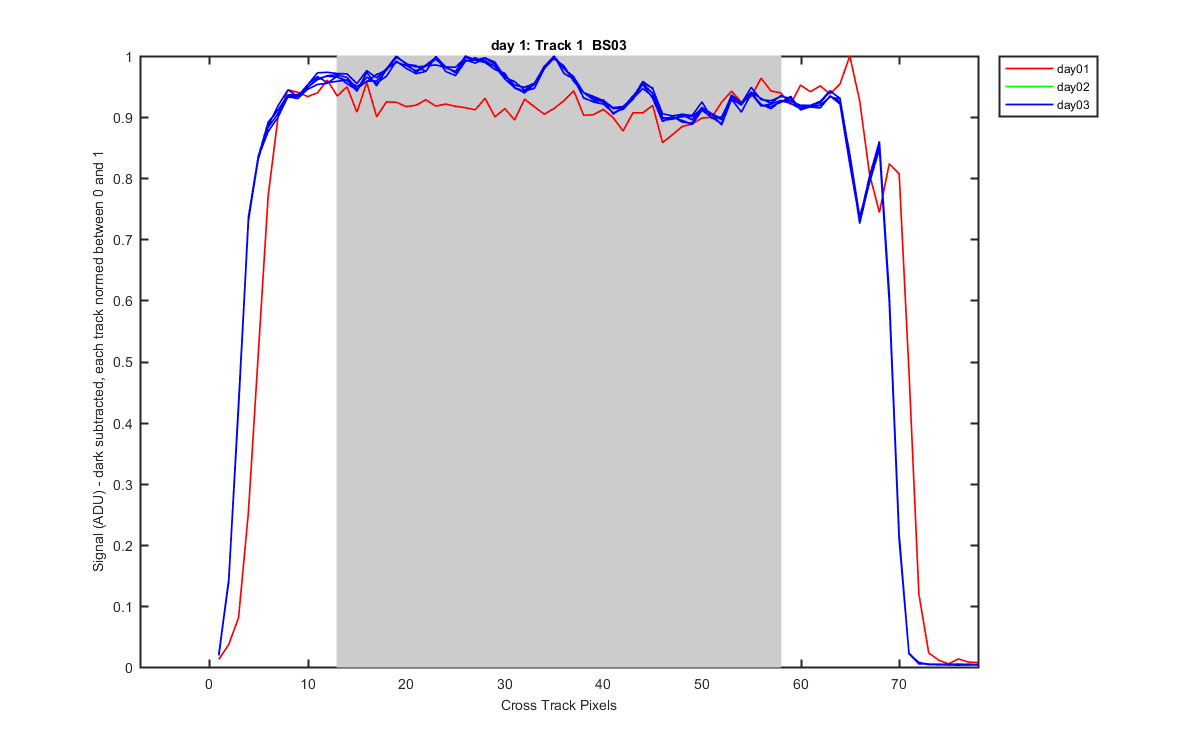
Figure 3
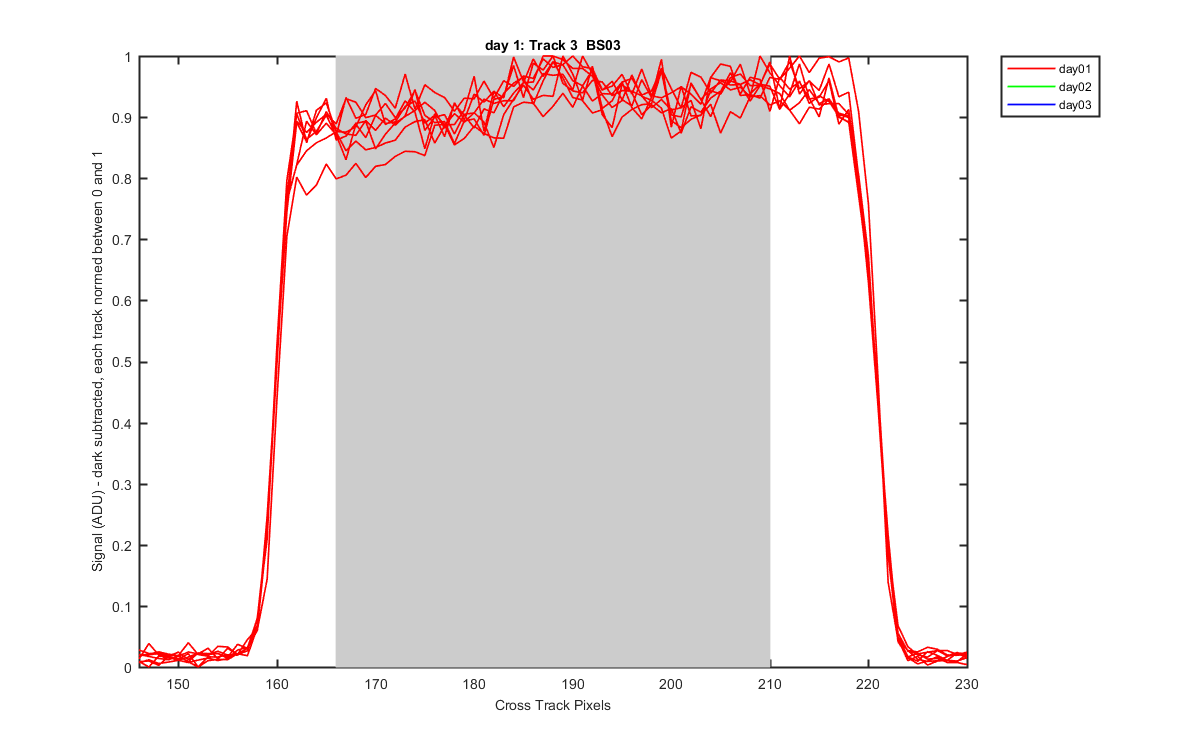
Figure 4
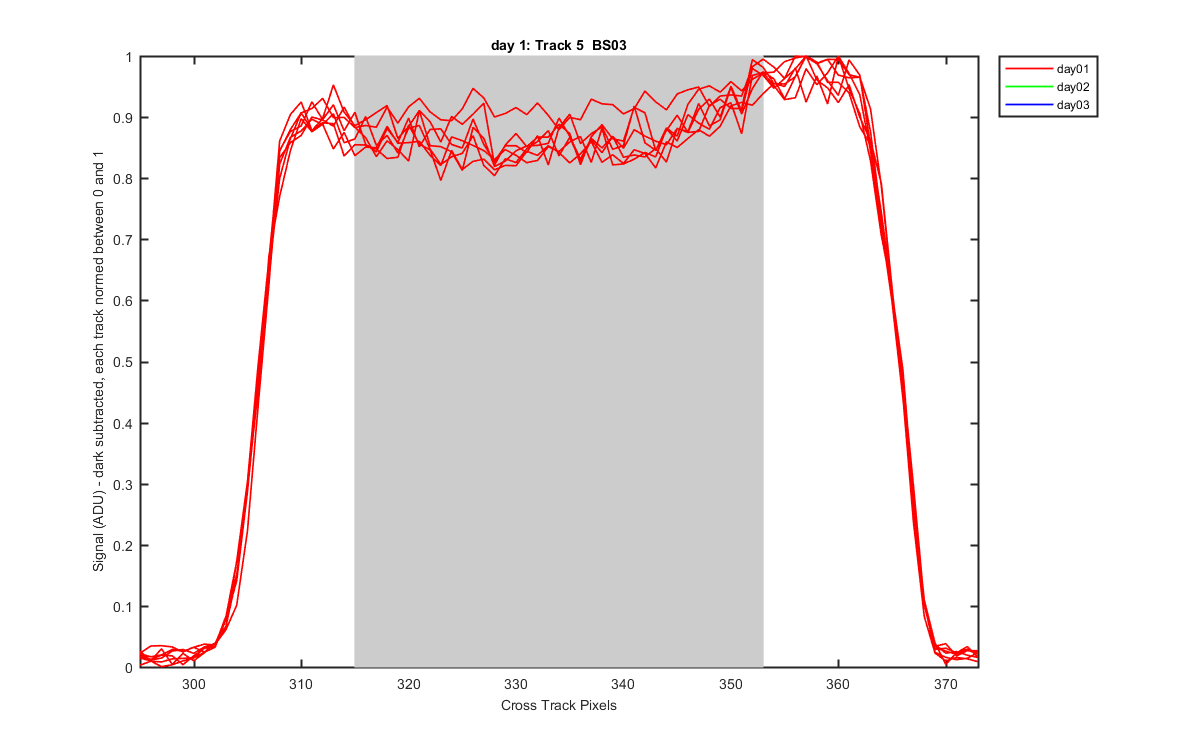
Figure 5
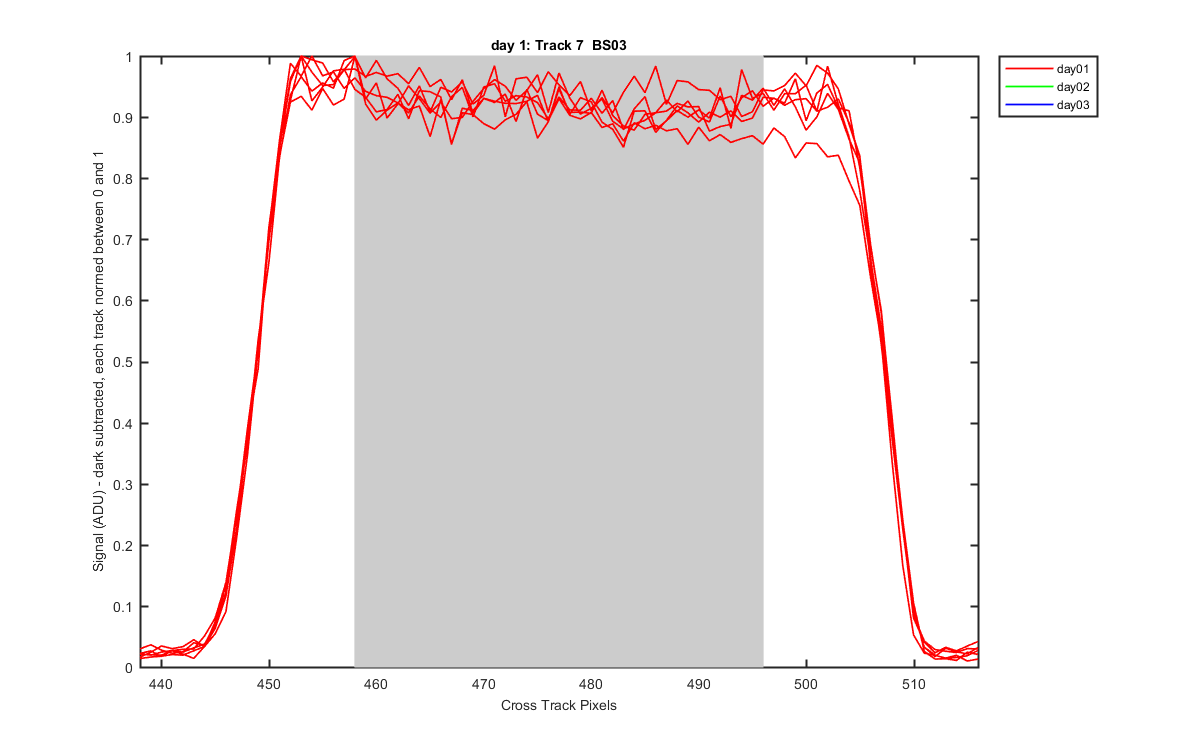
Figure 6
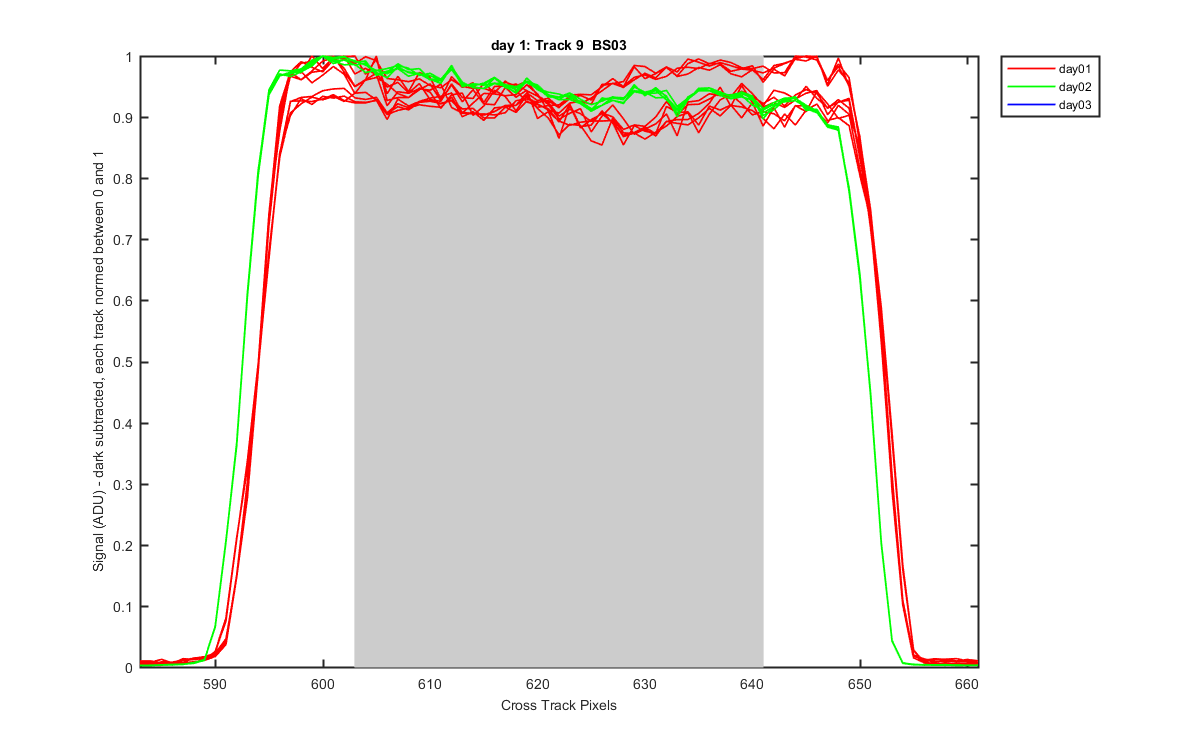
Figure 7
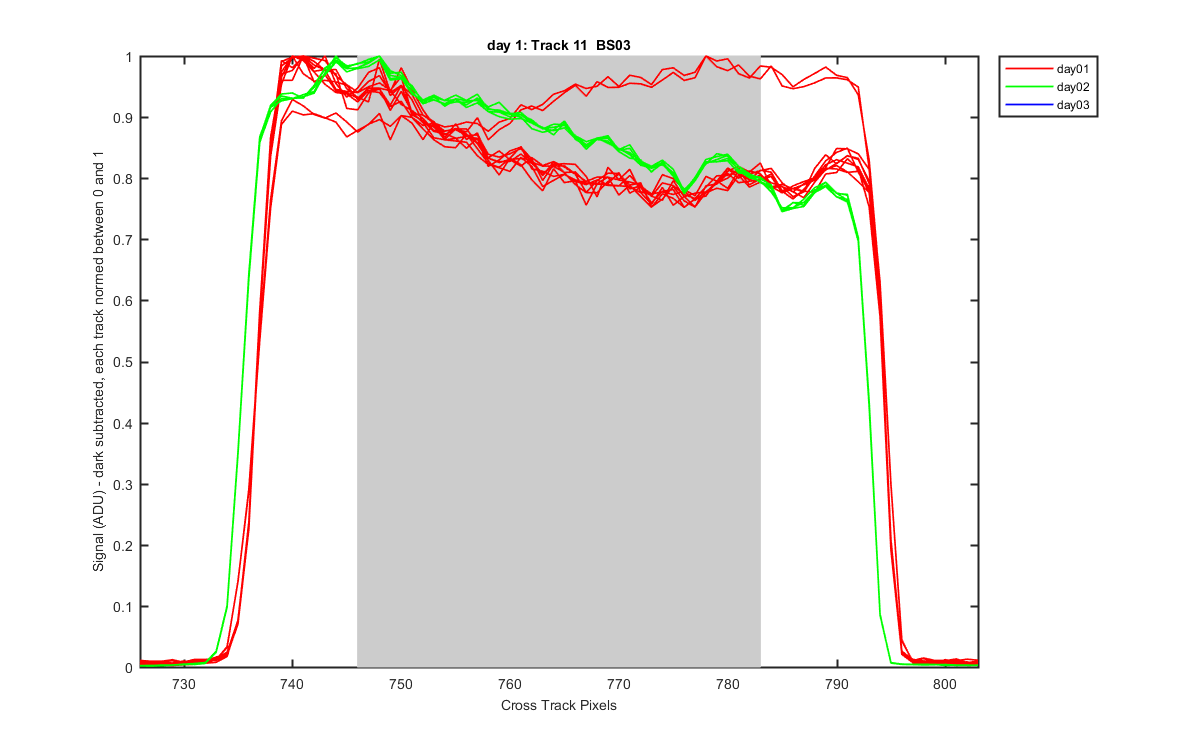
Figure 8
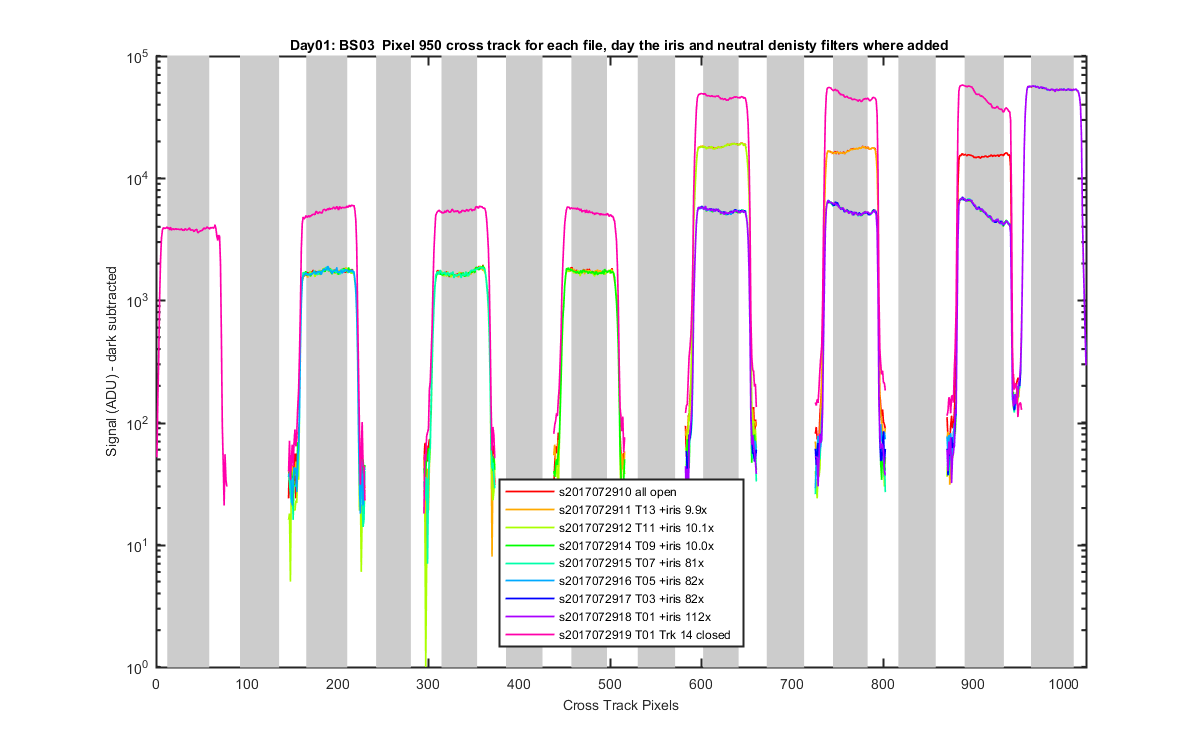
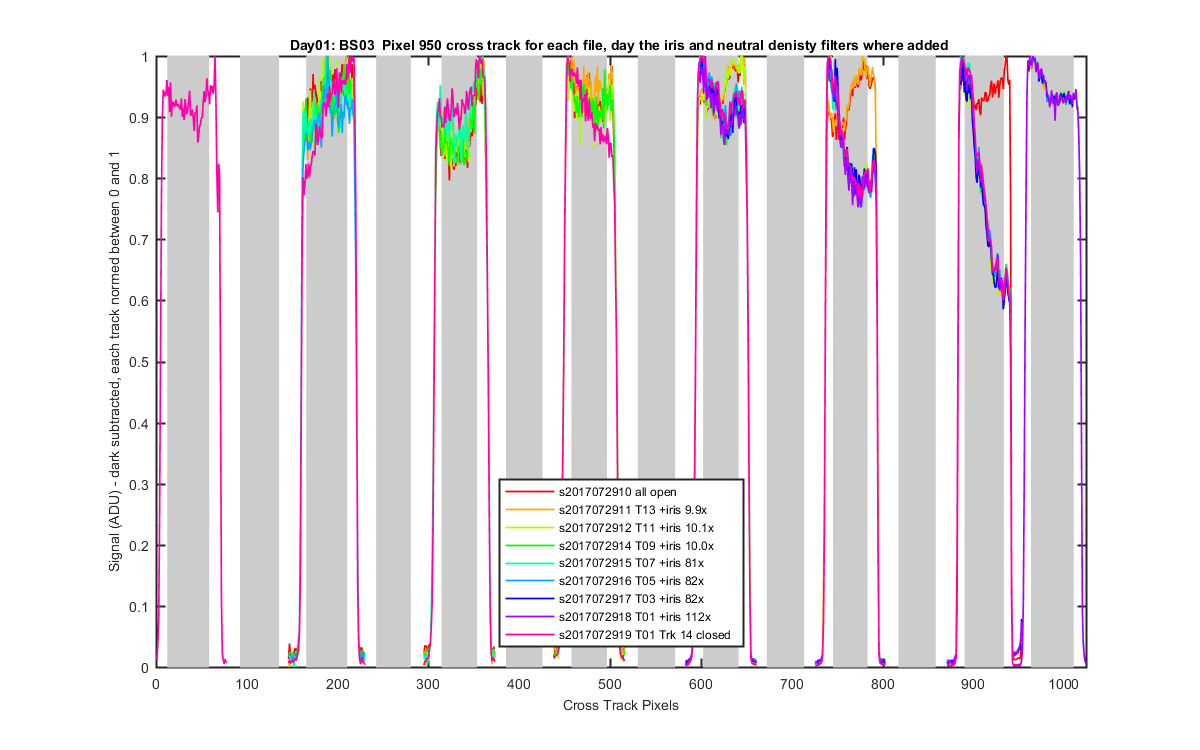
Day 1 data. Mike was installing the iris in each track and the neutral density filters. You can see when the iris is added there is a change to the saddle shape.
s2017072910 - all track with no iris        0.9 sec
s2017072911 - Trk 13 iris down by 9.9x      0.9 sec
s2017072912 - Trk 11 iris down by 10.1x     0.9 sec
s2017072914 - Trk 09 iris down by 10.0x     0.9 sec
s2017072915 - Trk 07 iris down by 81x       0.9 sec
s2017072916 - Trk 05 iris down by 82x       0.9 sec
s2017072917 - Trk 03 iris down by 82x       0.9 sec
s2017072918 - Trk 01 iris down by 112x      0.9 sec
s2017072919 - Trk 14 closed                   8 sec

Track 14 is closed on file 19 so Mike could take data on all the other tracks without saturating track 14
which has not iris or neutral density filters. You can see the relative reduction from the Lu track which
where reduced by 10x and the Es/Ed tracks which where reduced by 100x.
Figure 9
Day 1 data. Mike was installing the iris in each track and the neutral density filters. Same data as the previous graph but I have not normalized the data so you can see the level changes.
s2017072910 - all track with no iris        0.9 sec
s2017072911 - Trk 13 iris down by 9.9x      0.9 sec
s2017072912 - Trk 11 iris down by 10.1x     0.9 sec
s2017072914 - Trk 09 iris down by 10.0x     0.9 sec
s2017072915 - Trk 07 iris down by 81x       0.9 sec
s2017072916 - Trk 05 iris down by 82x       0.9 sec
s2017072917 - Trk 03 iris down by 82x       0.9 sec
s2017072918 - Trk 01 iris down by 112x      0.9 sec
s2017072919 - Trk 14 closed                   8 sec

Track 14 is closed on file 19 so Mike could take data on all the other tracks without saturating track 14
which has not iris or neutral density filters. You can see the relative reduction from the Lu track which
where reduced by 10x and the Es/Ed tracks which where reduced by 100x.
Figure 10