REVISION DATE: 28-Aug-2019 14:18:08
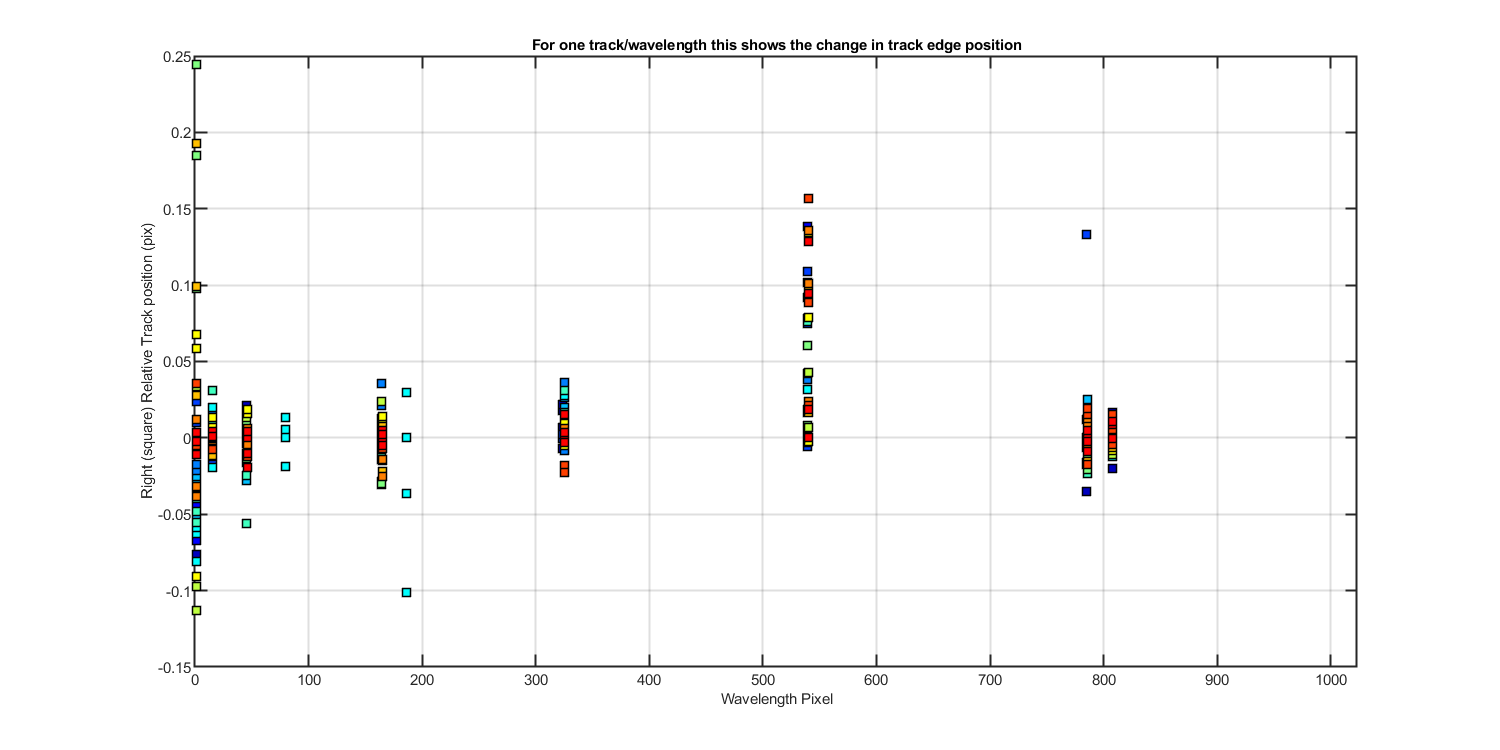
Looks at track movement for experiment laser data. For each lite/wavelngth and track I normalized the track to its max value and plotted this for each file. Then I found where the right and left edge of each track crossed the 25% line. I also decided to create a "net" (lite-dark) for each light Mike collected. So rather than the drk-drk-lite-lite-lite-lite-drk-drk for each wavelength producing one net data set. I did a mean of the darks and subtracted the mean dark from each light scan. So for each wavelength/day/track there are 4 net lights.
This only includes laser data. Unlike broadband sources like a lamp or LED where I can pick fixed cross track pixels on the array, laser data only has light on a few pixels. So I have to use the pixels where the laser data are. I have found the laser peak and then used that as the cross track pixel. This means that each change in laser wavelength will product a different cross track pixel. The broadband sources has 3 fixed pixels for all tracks/days. I am plotting all the laser data for one track on one graph. So you will see different pixels on the track depending on the laser data collected. This will allow you to see how the track shape changes across the array where ever laser data are collected.
I have not figured out how to denote that the data was collected using all tracks verses single track or with or without a Lu head etc. The table included is where I will start. Once there is more data I will re-evaluate the way I am plotting data.
| Laser Wave | filename | Tracks with data | Cross Trk pix for tracks on |
# of pixels Saturated for tracks on values > 62500 are marked Saturated |
Max for tracks on (ADU, before dark subraction) | |||||||||||||||||||||||||||
|---|---|---|---|---|---|---|---|---|---|---|---|---|---|---|---|---|---|---|---|---|---|---|---|---|---|---|---|---|---|---|---|---|
| Day | nm | yyyymmdd | number | laser peak pix | 1 | 2 | 3 | 4 | 5 | 6 | 7 | 8 | 9 | 10 | 11 | 12 | 13 | 14 | 1 | 2 | 3 | 4 | 5 | 6 | 7 | 8 | 9 | 10 | 11 | 12 | 13 | 14 |
| 2 | 345 | 20190718 | 1 2 3 4 5 6 7 8 9 10 11 12 13 14 | 1 | 0 | 0 | 0 | 0 | 0 | 0 | 0 | 0 | 0 | 0 | 0 | 0 | 0 | 0 | 5956 | 6992 | 6955 | 7303 | 7082 | 6648 | 5124 | 4445 | 4145 | 4124 | 4548 | 5625 | 6211 | 6772 |
| 2 | 350 | 20190718 | 1 2 3 4 5 6 7 8 9 10 11 12 13 14 | 15 | 0 | 0 | 0 | 0 | 0 | 0 | 0 | 0 | 0 | 0 | 0 | 0 | 0 | 0 | 33694 | 41256 | 41128 | 39752 | 36531 | 41012 | 40729 | 39724 | 37322 | 39050 | 42135 | 41983 | 37670 | 38002 |
| 2 | 360 | 20190718 | 1 2 3 4 5 6 7 8 9 10 11 12 13 14 | 45 46 | 0 | 0 | 0 | 0 | 0 | 0 | 0 | 0 | 0 | 0 | 0 | 0 | 0 | 0 | 35162 | 36202 | 40425 | 38144 | 34816 | 34582 | 39329 | 37573 | 33364 | 36329 | 42325 | 45055 | 35911 | 37624 |
| 2 | 400 | 20190718 | 1 2 3 4 5 6 7 8 9 10 11 12 13 14 | 164 165 | 0 | 0 | 0 | 0 | 0 | 0 | 0 | 0 | 0 | 0 | 0 | 0 | 0 | 0 | 28780 | 28469 | 30316 | 29788 | 29970 | 29500 | 28827 | 29135 | 28440 | 31671 | 35432 | 35666 | 30140 | 30238 |
| 2 | 455 | 20190718 | 1 2 3 4 5 6 7 8 9 10 11 12 13 14 | 324 325 | 0 | 0 | 0 | 0 | 0 | 0 | 0 | 0 | 0 | 0 | 0 | 0 | 0 | 0 | 31179 | 28653 | 28179 | 28337 | 29606 | 29686 | 29529 | 30642 | 31594 | 32952 | 34294 | 34390 | 32665 | 32092 |
| 2 | 530 | 20190718 | 1 2 3 4 5 6 7 8 9 10 11 12 13 14 | 539 540 | 60 | 25 | 22 | 11 | 7 | 2 | 0 | 0 | 9 | 25 | 37 | 37 | 28 | 29 | 62911 | 62911 | 62901 | 62871 | 62776 | 62626 | 62255 | 61402 | 62929 | 63173 | 63149 | 63228 | 63211 | 63151 |
| 2 | 617 | 20190718 | 1 2 3 4 5 6 7 8 9 10 11 12 13 14 | 785 786 | 0 | 0 | 0 | 0 | 0 | 0 | 0 | 0 | 0 | 0 | 0 | 0 | 0 | 0 | 57388 | 50570 | 49980 | 50962 | 50821 | 50859 | 48246 | 48593 | 50836 | 52970 | 56310 | 56072 | 52530 | 51992 |
| 2 | 625 | 20190718 | 1 2 3 4 5 6 7 8 9 10 11 12 13 14 | 808 | 0 | 0 | 0 | 0 | 0 | 0 | 0 | 0 | 0 | 0 | 0 | 0 | 0 | 0 | 57837 | 51246 | 52504 | 51038 | 52295 | 50612 | 48068 | 46418 | 47970 | 47579 | 49219 | 49534 | 48327 | 46287 |
| 4 | 372 | 20190827 | 6 | 80 | x | x | x | x | x | 0 | x | x | x | x | x | x | x | x | x | x | x | x | x | 52687 | x | x | x | x | x | x | x | x |
| 4 | 407 | 20190827 | 6 | 186 | x | x | x | x | x | 59 | x | x | x | x | x | x | x | x | x | x | x | x | x | 63242 | x | x | x | x | x | x | x | x |
Figure 1
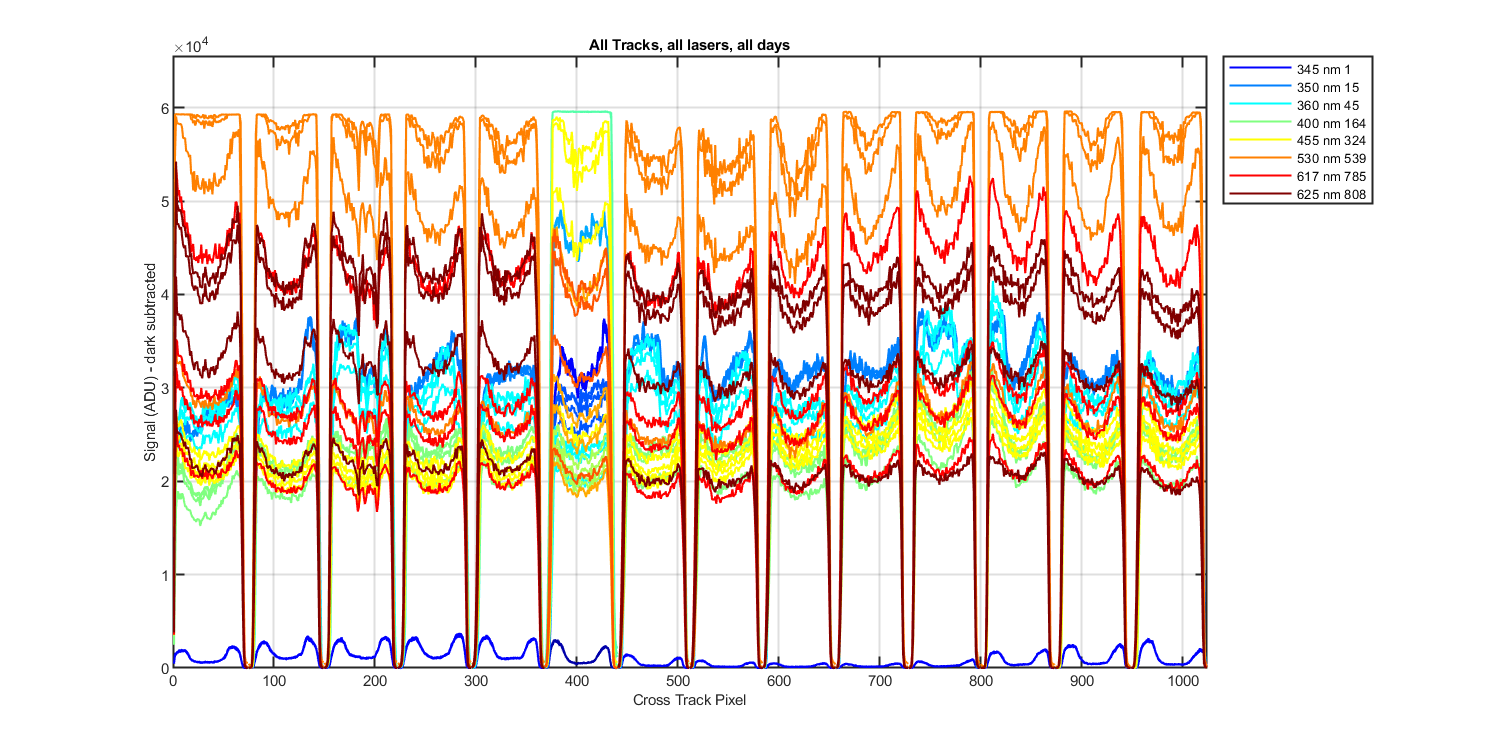
Figure 2
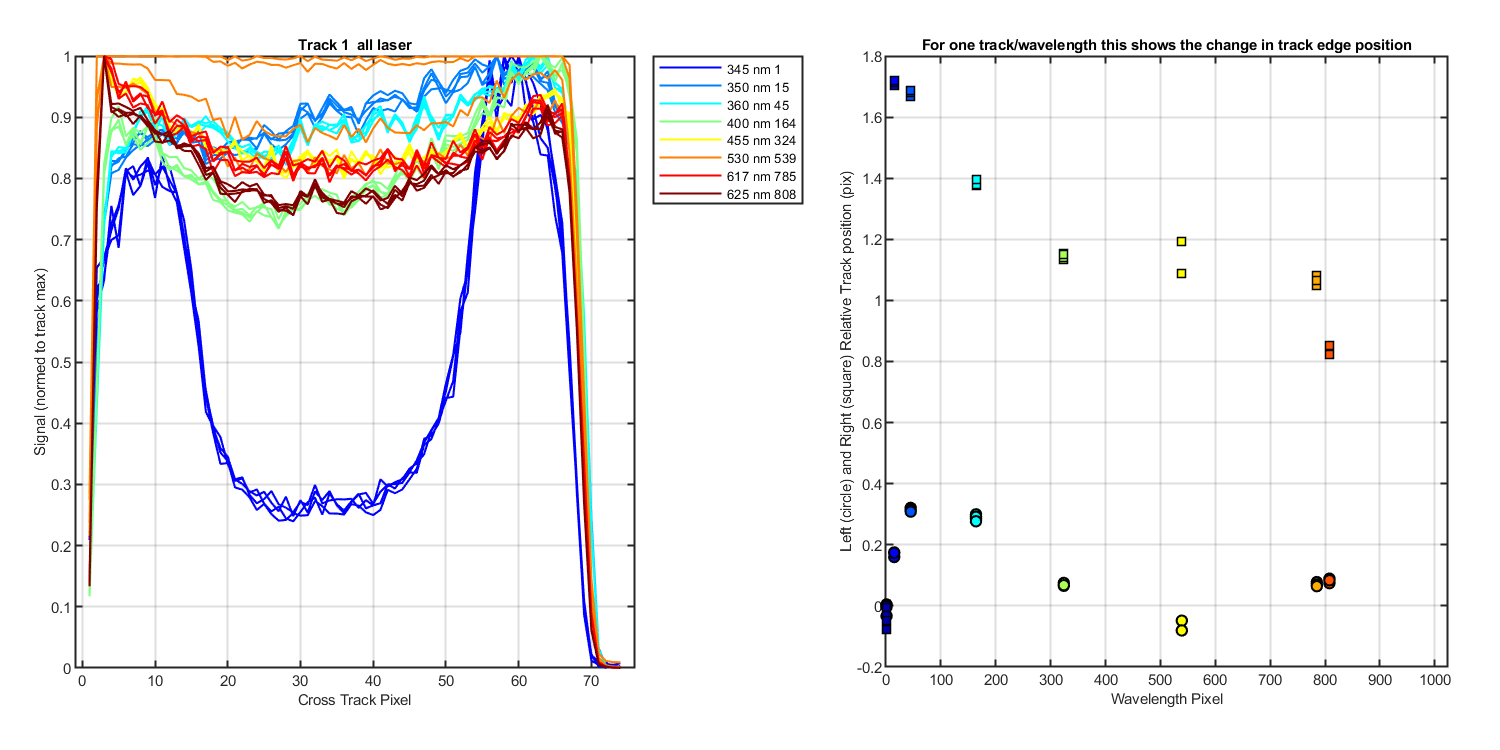
Figure 3
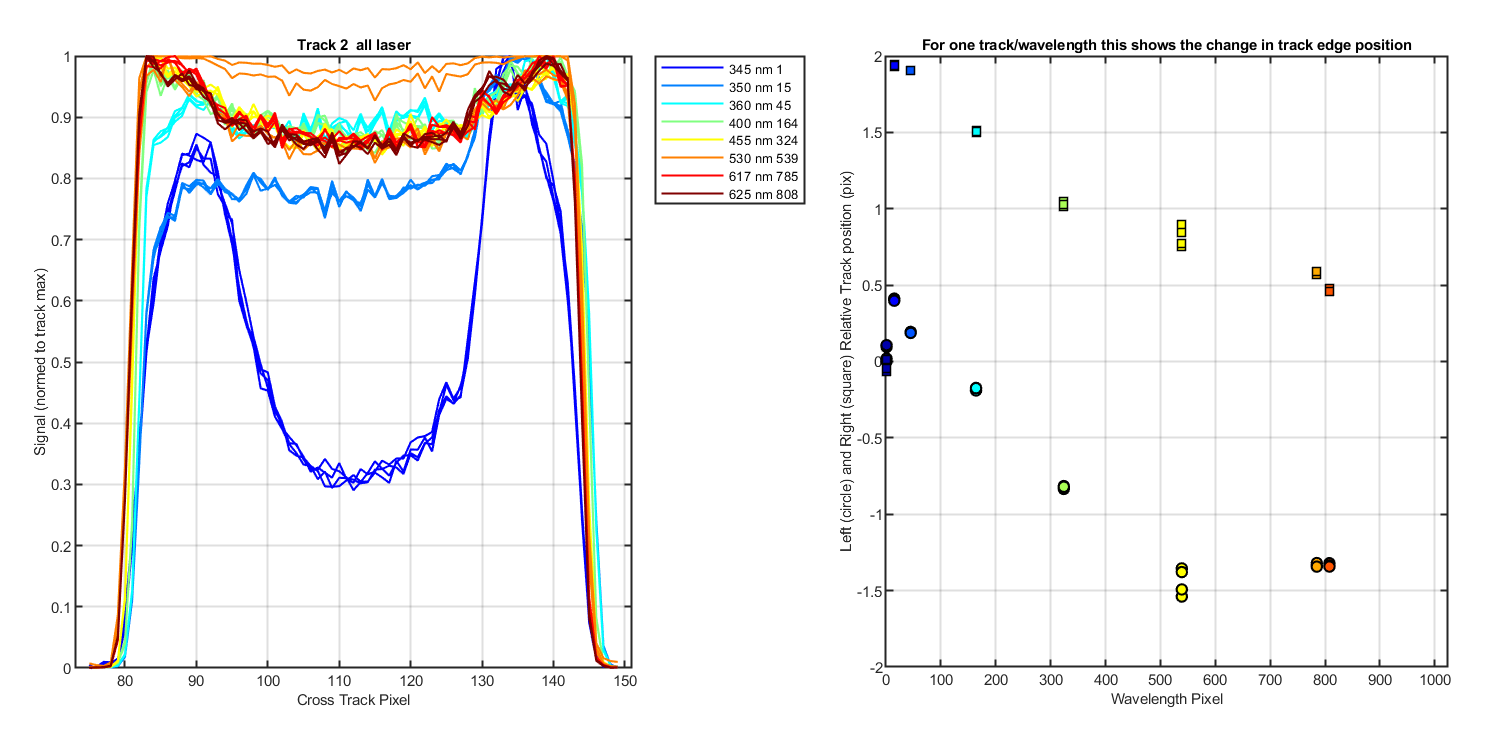
Figure 4
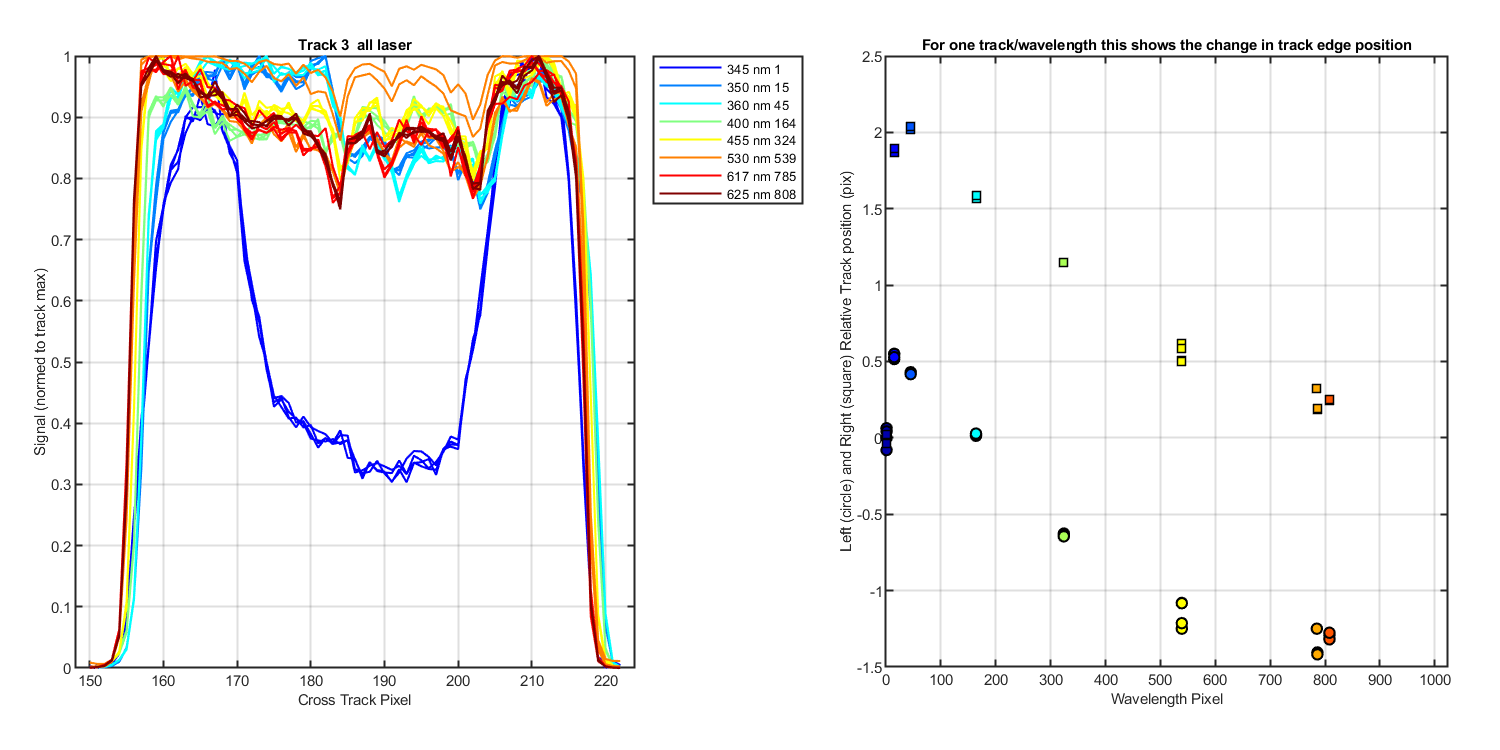
Figure 5
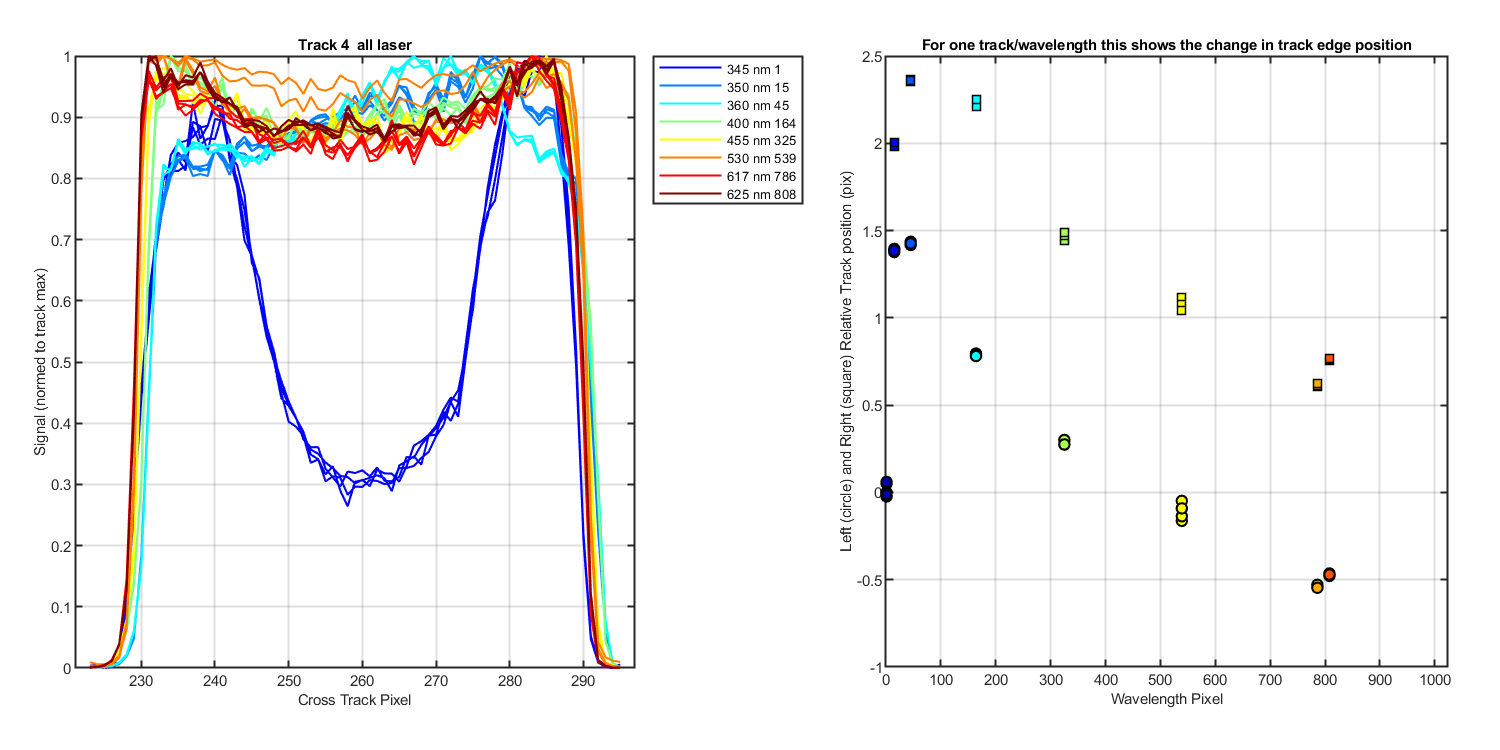
Figure 6
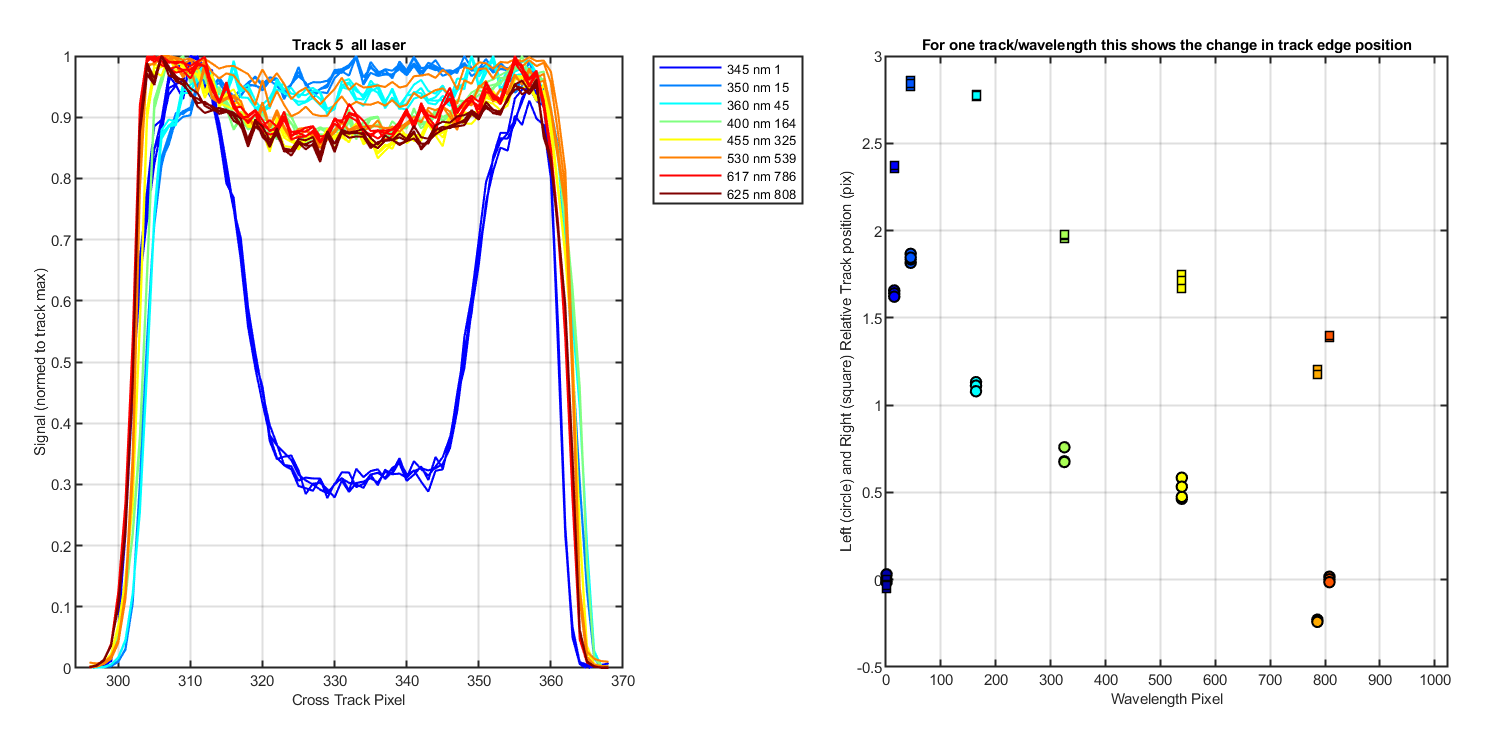
Figure 7
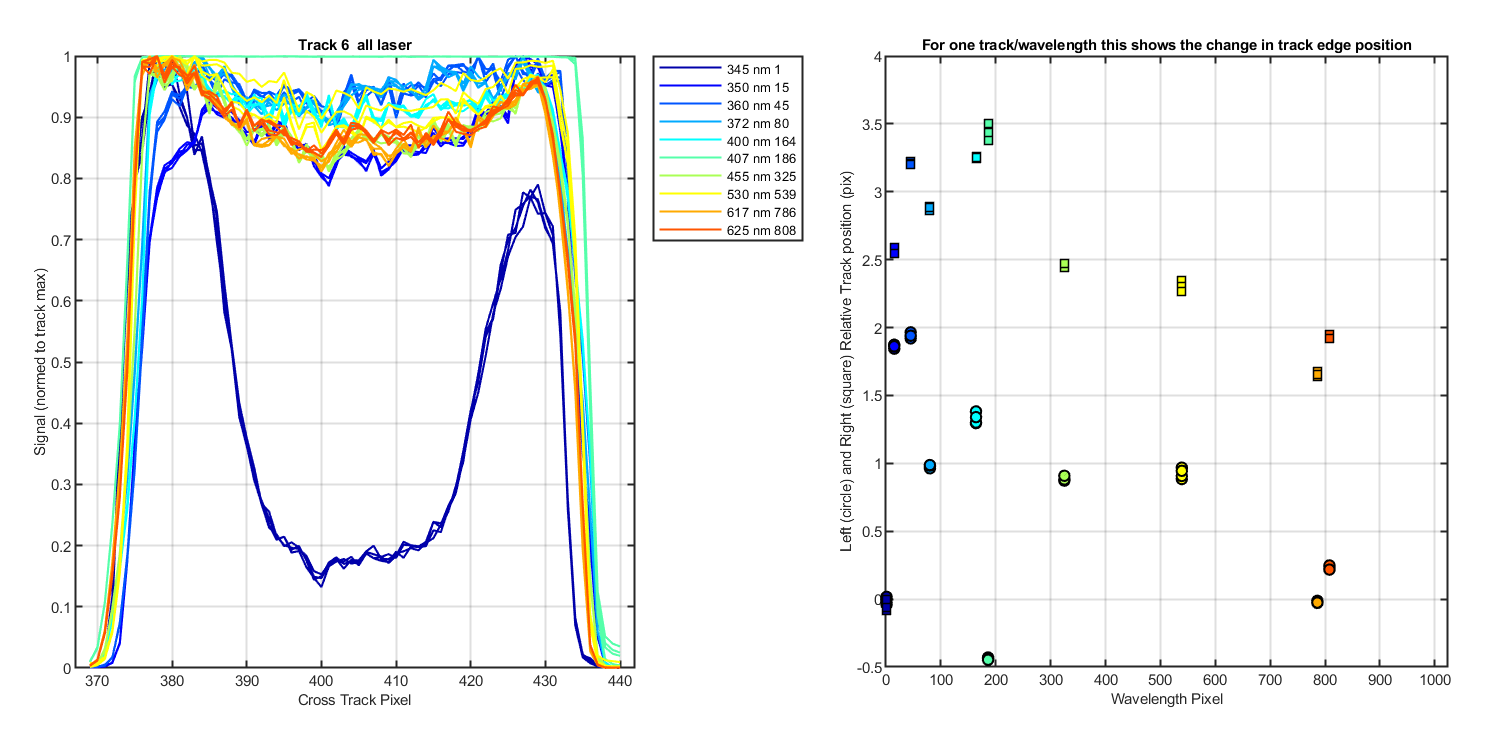
Figure 8
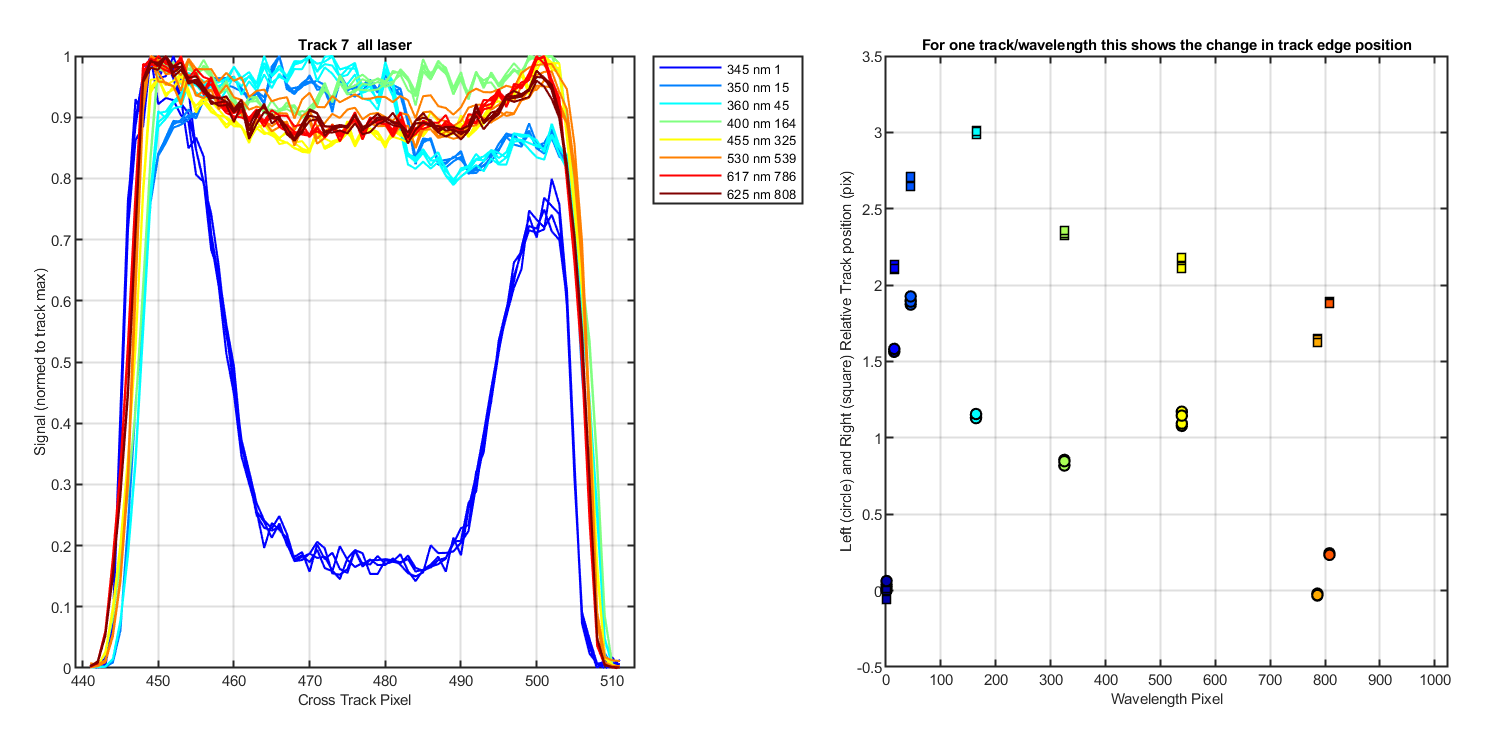
Figure 9
Figure 10
Figure 11
Figure 12
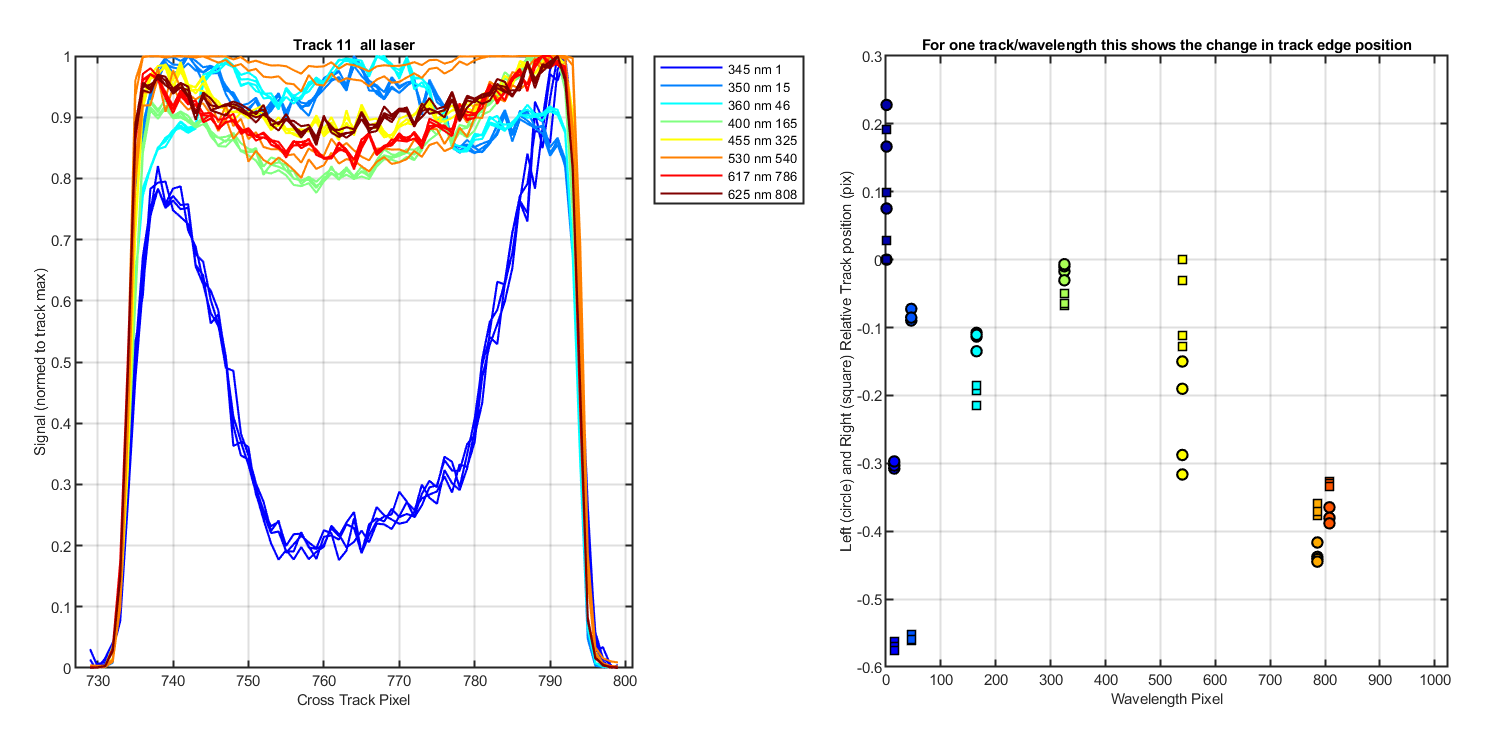
Figure 13
Figure 14
Figure 15
Figure 16
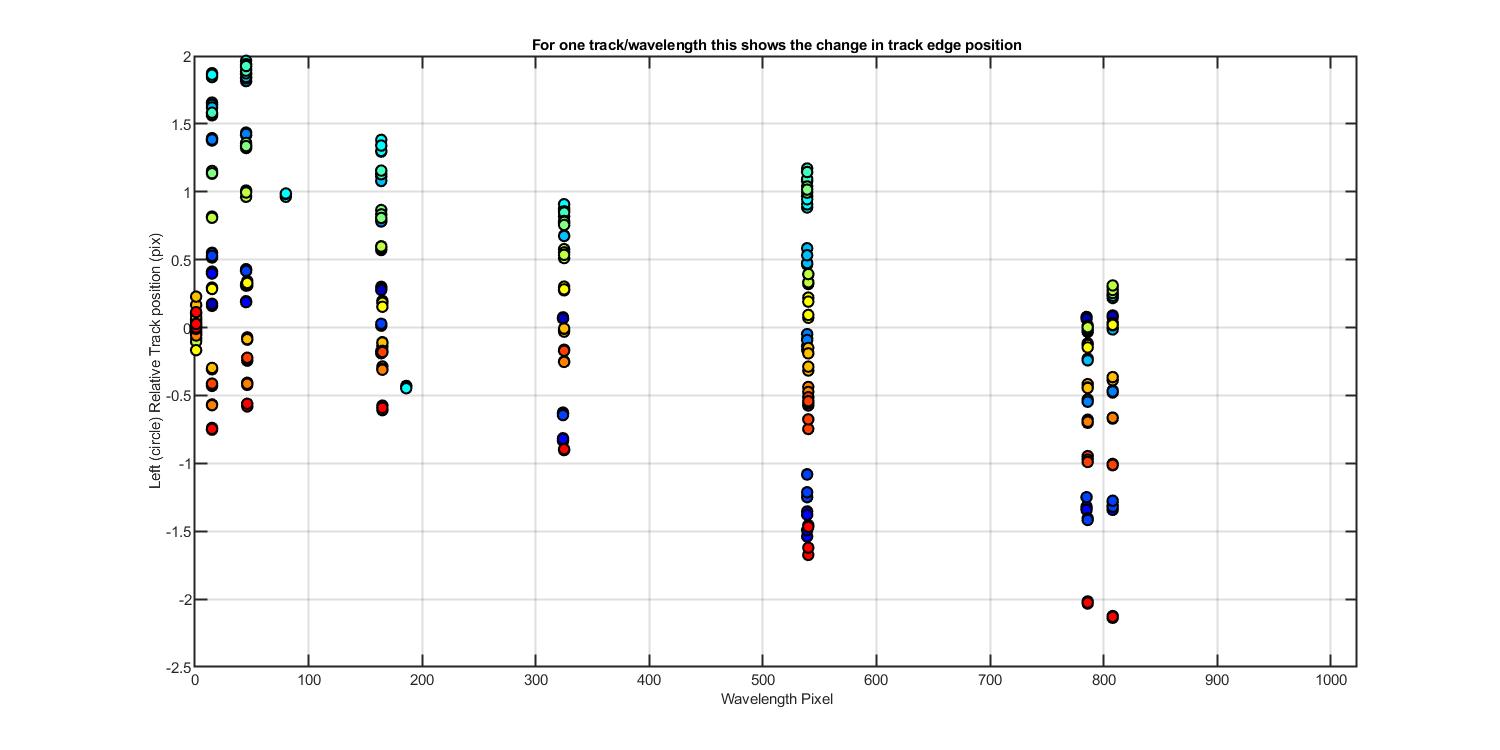
Figure 17