REVISION DATE: 18-Jul-2019 19:14:14
Exerimental BS or RS data starting to put data into new Vaux setup.
| Dataset# | Filename / Fit# | Type | file creation date | Total Exposure Time | Tracks on | Temperature | Pre Amplifier Gain | Matrix Max (ADU) | Matrix Mean (ADU) | Matrix % std |
|---|---|---|---|---|---|---|---|---|---|---|
| 1 | BS_20190717_045509_raw01 / 001 | Background | 17-Jul-2019 04:55:09 | 0.75 | 1 2 3 4 5 6 7 8 9 10 11 12 13 14 | -40 | 4 | 3642 | 3605.6084 | 0.22313 |
| 1 | BS_20190717_045509_raw01 / 002 | Background | 17-Jul-2019 04:56:51 | 0.75 | 1 2 3 4 5 6 7 8 9 10 11 12 13 14 | -40 | 4 | 3642 | 3603.3238 | 0.22341 |
| 1 | BS_20190717_045509_raw01 / 001 | Lite | 17-Jul-2019 04:57:36 | 0.75 | 1 2 3 4 5 6 7 8 9 10 11 12 13 14 | -40 | 4 | 57897 | 6567.521 | 117.4942 |
| 1 | BS_20190717_045509_raw01 / 002 | Lite | 17-Jul-2019 04:58:11 | 0.75 | 1 2 3 4 5 6 7 8 9 10 11 12 13 14 | -40 | 4 | 58152 | 6562.5343 | 117.4132 |
| 1 | BS_20190717_045509_raw01 / 003 | Lite | 17-Jul-2019 04:58:28 | 0.75 | 1 2 3 4 5 6 7 8 9 10 11 12 13 14 | -40 | 4 | 57921 | 6568.0233 | 117.4952 |
| 1 | BS_20190717_045509_raw01 / 004 | Lite | 17-Jul-2019 04:58:44 | 0.75 | 1 2 3 4 5 6 7 8 9 10 11 12 13 14 | -40 | 4 | 58271 | 6563.5933 | 117.4093 |
| 1 | BS_20190717_045509_raw01 / 003 | Background | 17-Jul-2019 04:59:05 | 0.75 | 1 2 3 4 5 6 7 8 9 10 11 12 13 14 | -40 | 4 | 3645 | 3604.0261 | 0.22408 |
| 1 | BS_20190717_045509_raw01 / 004 | Background | 17-Jul-2019 04:59:20 | 0.75 | 1 2 3 4 5 6 7 8 9 10 11 12 13 14 | -40 | 4 | 3641 | 3603.8409 | 0.22378 |
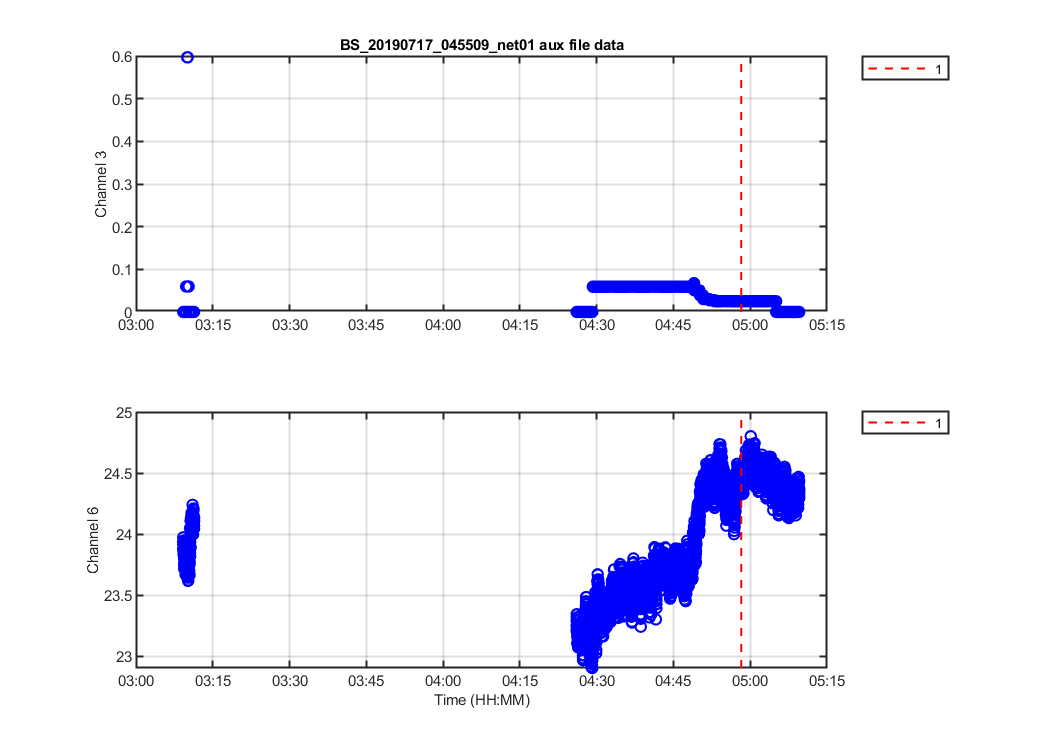
Figure 1A: Mikes Lamp monitoring log files. One shows the whole data set and one shows only the data with FITS files. black * is the number from Mikes logsheet.
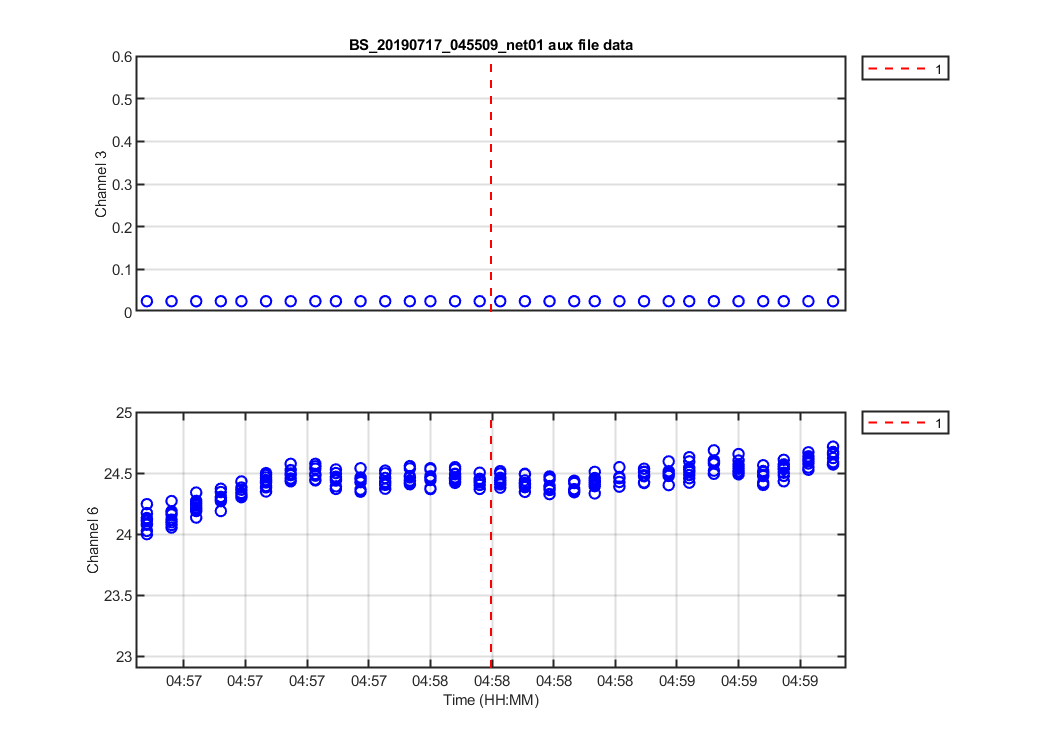
Figure 2A: Mikes Lamp monitoring log files. One shows the whole data set and one shows only the data with FITS files. black * is the number from Mikes logsheet.
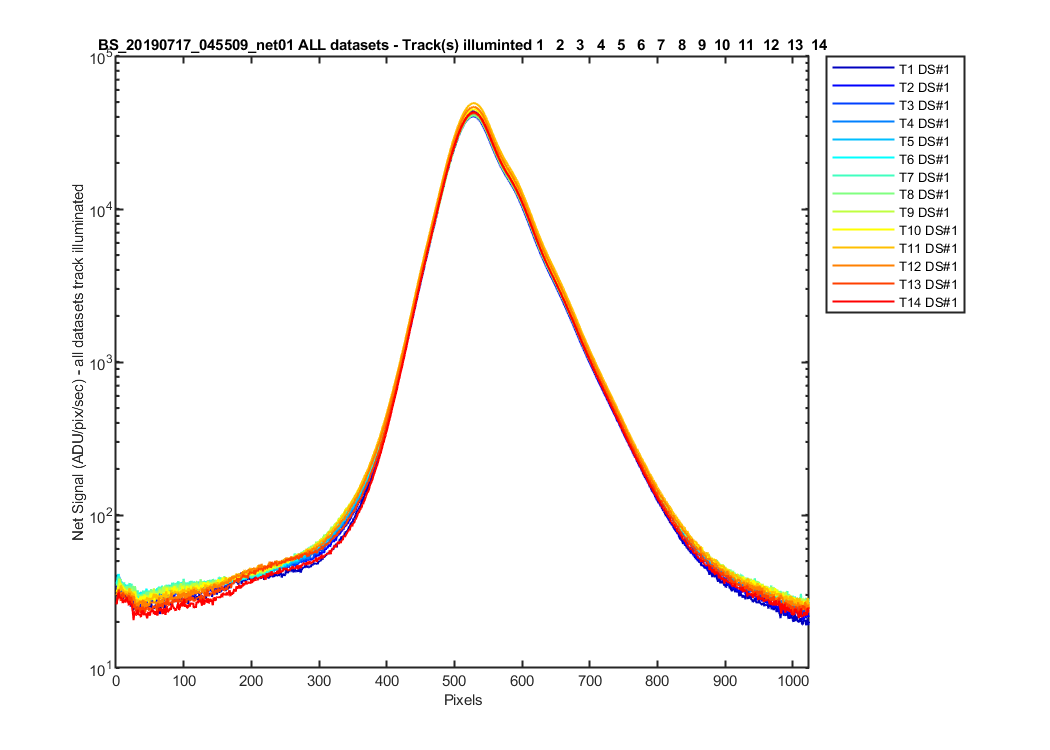
Figure 1B: All the net data sets with a track illuminated. This shows ALL the net tracks with light on them.
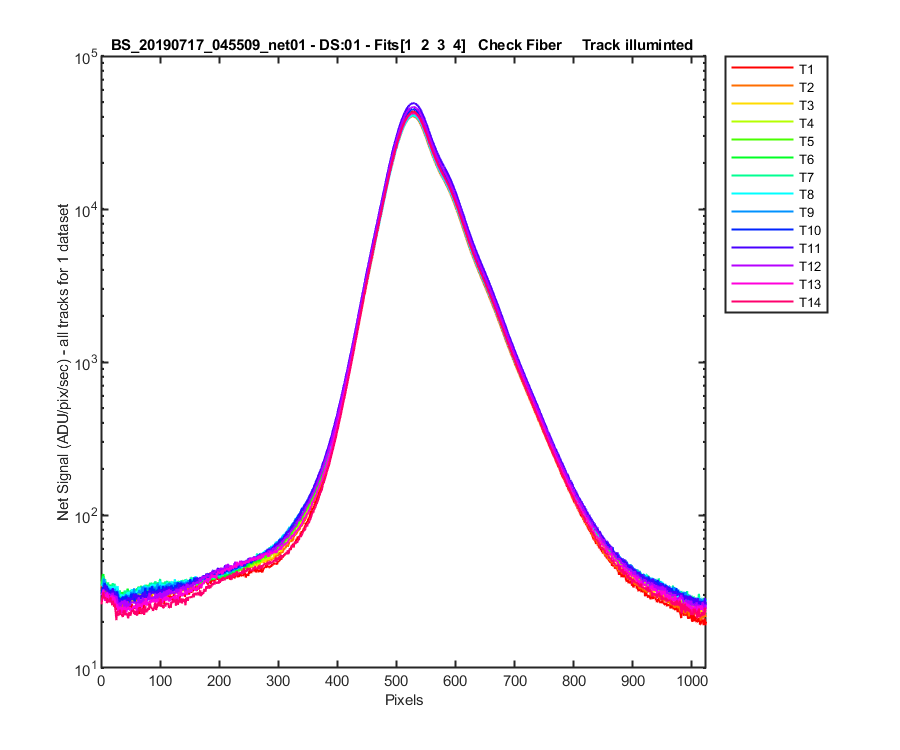
Figure 2B: The net for one dataset (dark-lite-dark) for all tracks illuminated or not. This allows you to see the straylight on other tracks. The dataset number and fits files used to create this net are in the title of the figure.