REVISION DATE: 01-Aug-2019 17:04:52
The exerpiment data time series Backgrounds. This shows all the Background collected from all the experiments data. A 7 pixels mean was calculated for each Background, day, track, and pixel. A standard deviation was also calculted.
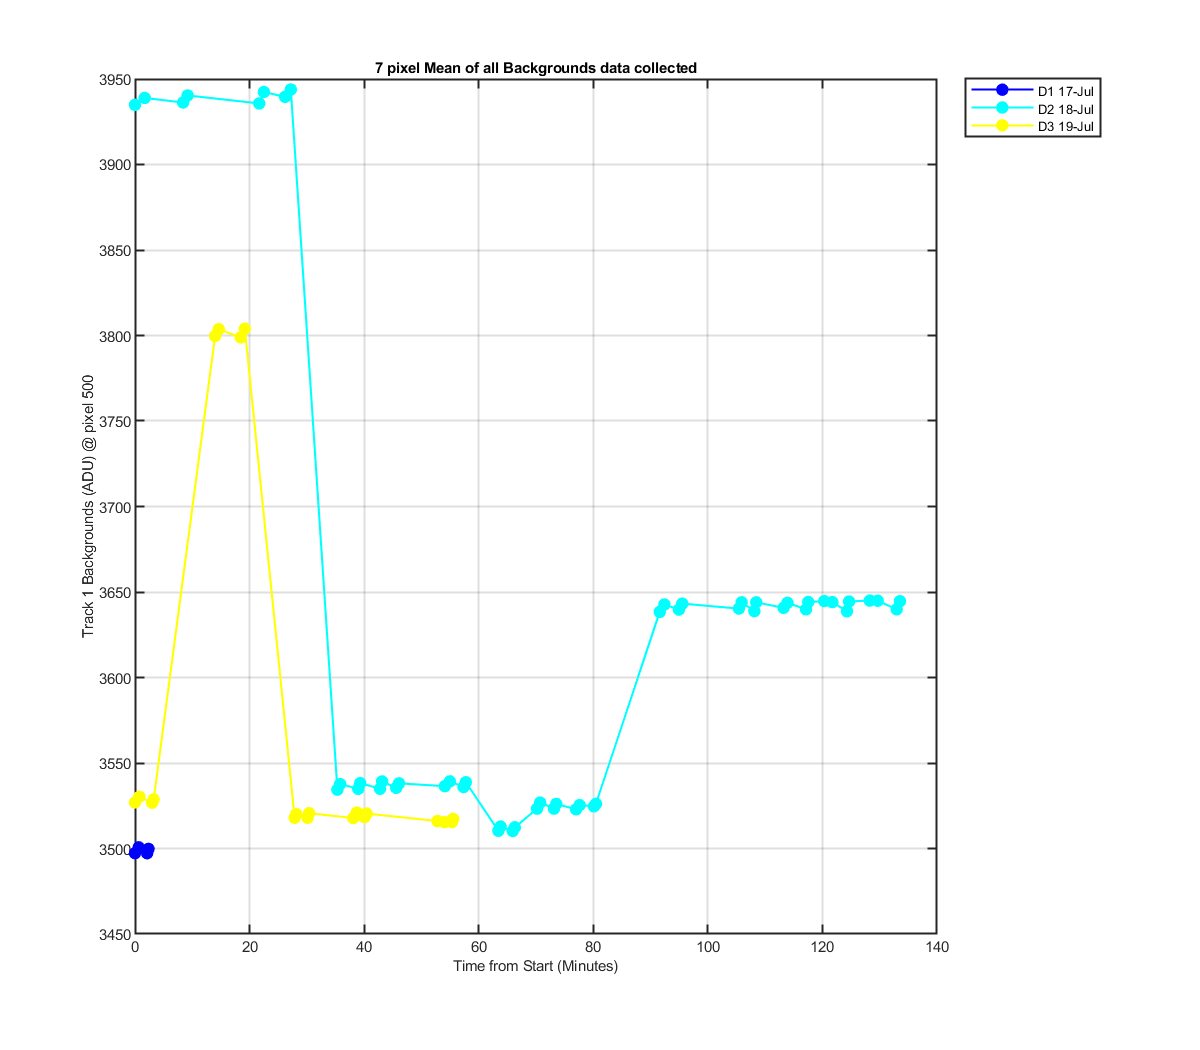
Figure 1 The 7 pxiels mean for each of the tracks in ADU with a sensor attached plotted against the time since the first data set in the file. This allows you to see the change in the Background during experiment data collection.
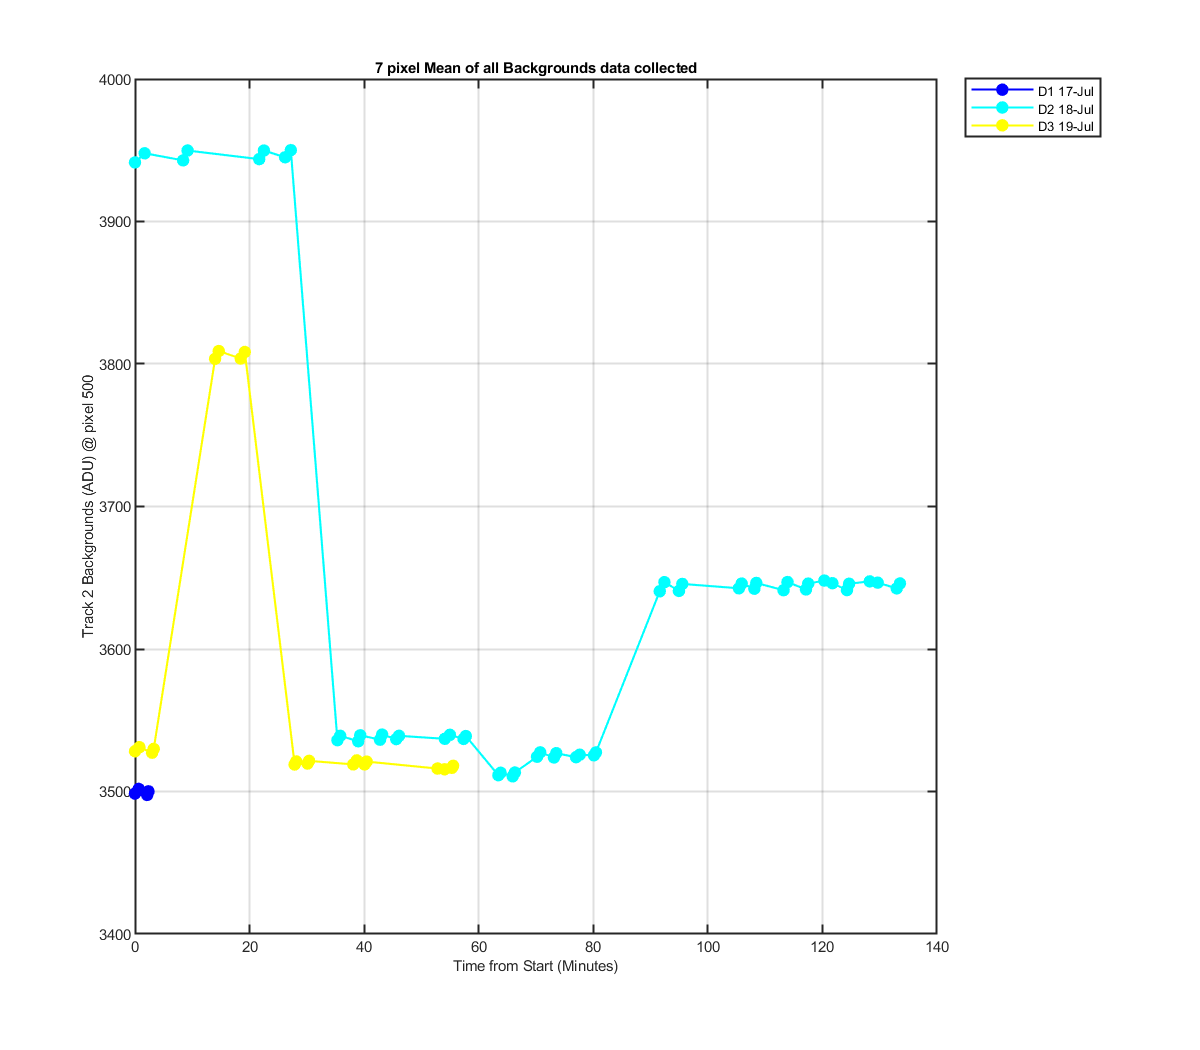
Figure 2 The 7 pxiels mean for each of the tracks in ADU with a sensor attached plotted against the time since the first data set in the file. This allows you to see the change in the Background during experiment data collection.
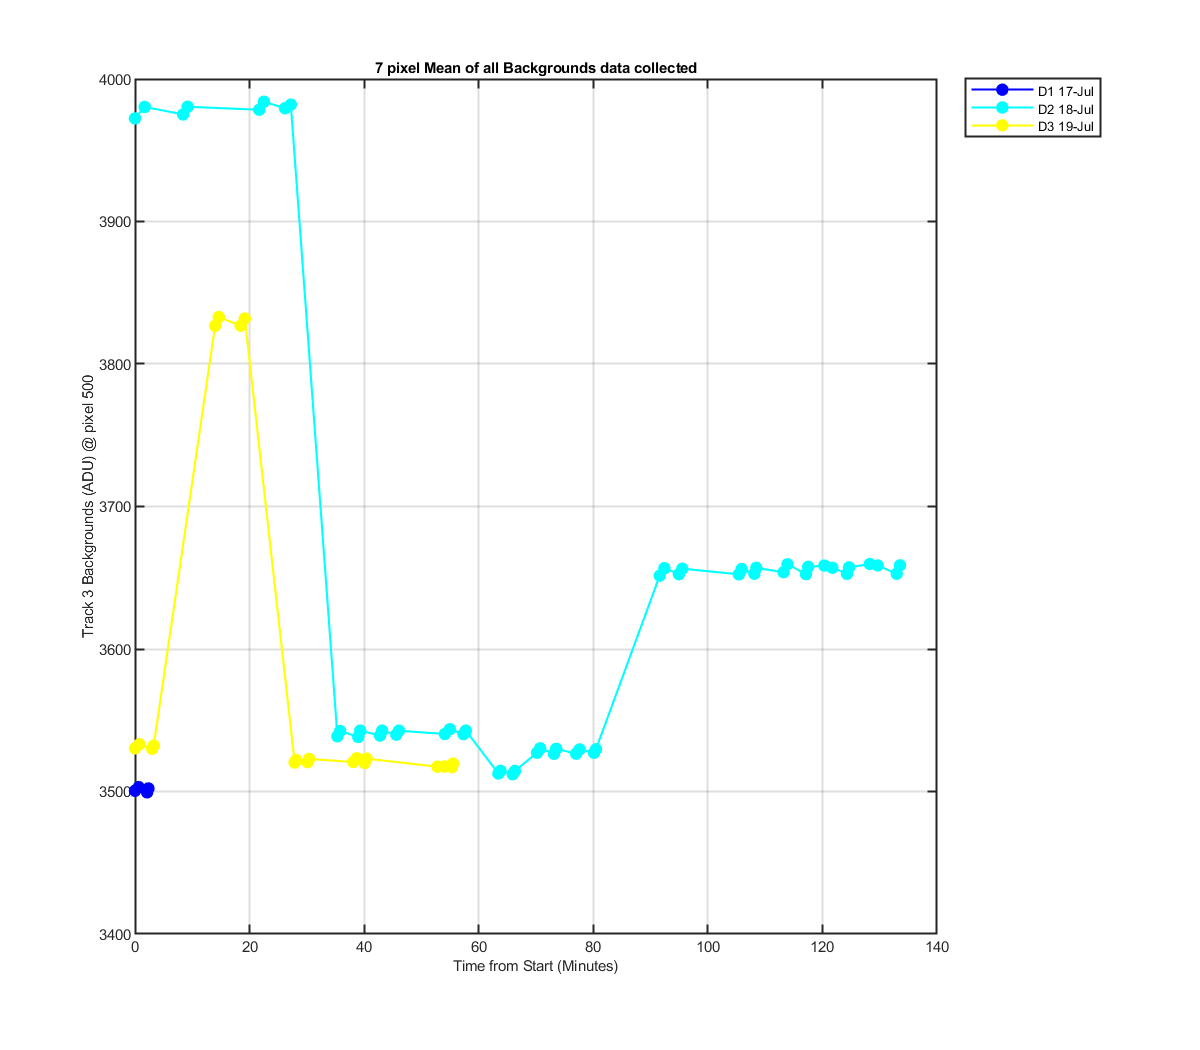
Figure 3 The 7 pxiels mean for each of the tracks in ADU with a sensor attached plotted against the time since the first data set in the file. This allows you to see the change in the Background during experiment data collection.

Figure 4 The 7 pxiels mean for each of the tracks in ADU with a sensor attached plotted against the time since the first data set in the file. This allows you to see the change in the Background during experiment data collection.
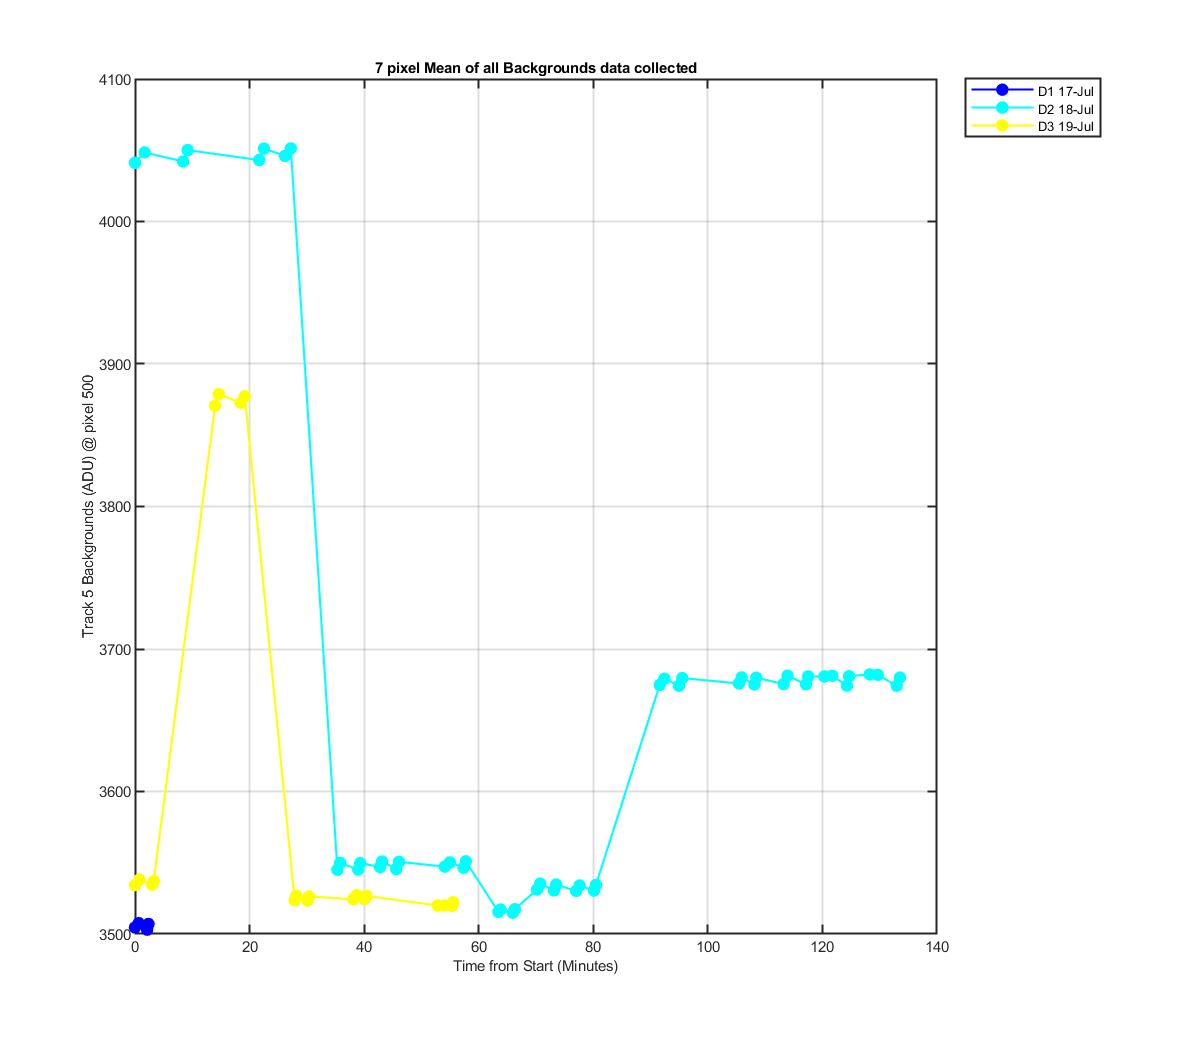
Figure 5 The 7 pxiels mean for each of the tracks in ADU with a sensor attached plotted against the time since the first data set in the file. This allows you to see the change in the Background during experiment data collection.
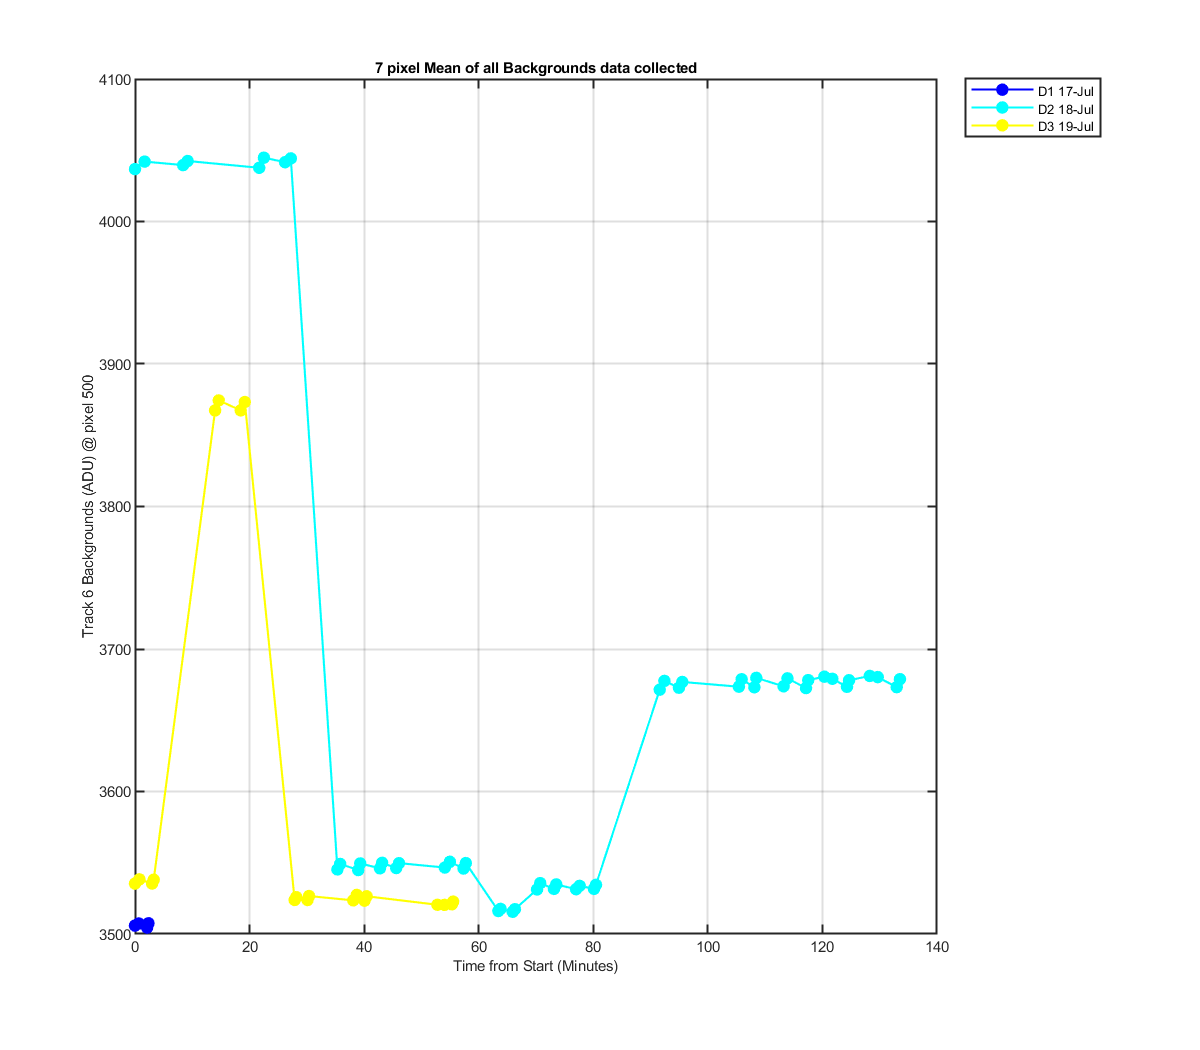
Figure 6 The 7 pxiels mean for each of the tracks in ADU with a sensor attached plotted against the time since the first data set in the file. This allows you to see the change in the Background during experiment data collection.

Figure 7 The 7 pxiels mean for each of the tracks in ADU with a sensor attached plotted against the time since the first data set in the file. This allows you to see the change in the Background during experiment data collection.

Figure 8 The 7 pxiels mean for each of the tracks in ADU with a sensor attached plotted against the time since the first data set in the file. This allows you to see the change in the Background during experiment data collection.
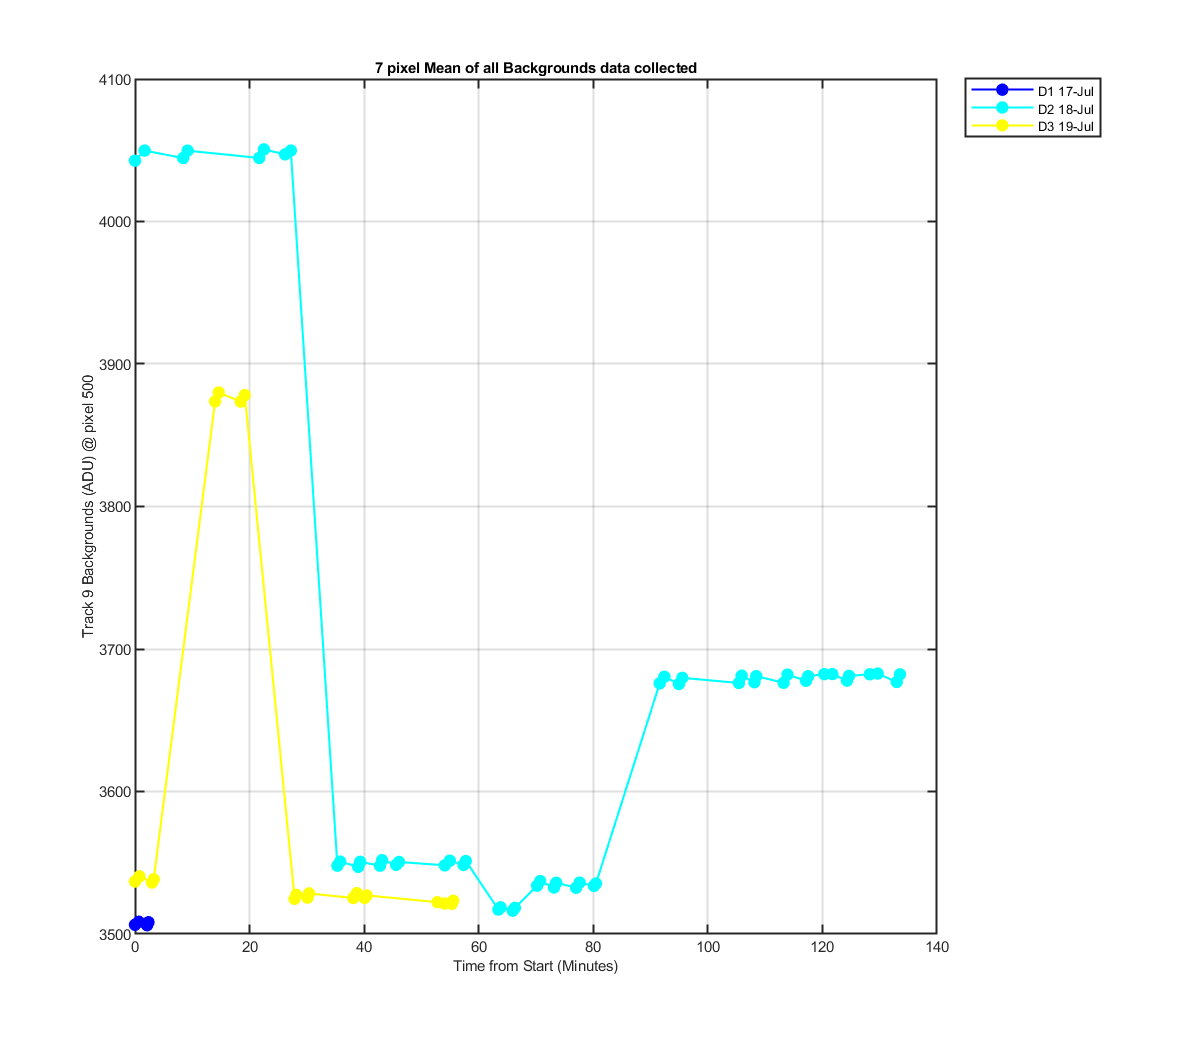
Figure 9 The 7 pxiels mean for each of the tracks in ADU with a sensor attached plotted against the time since the first data set in the file. This allows you to see the change in the Background during experiment data collection.
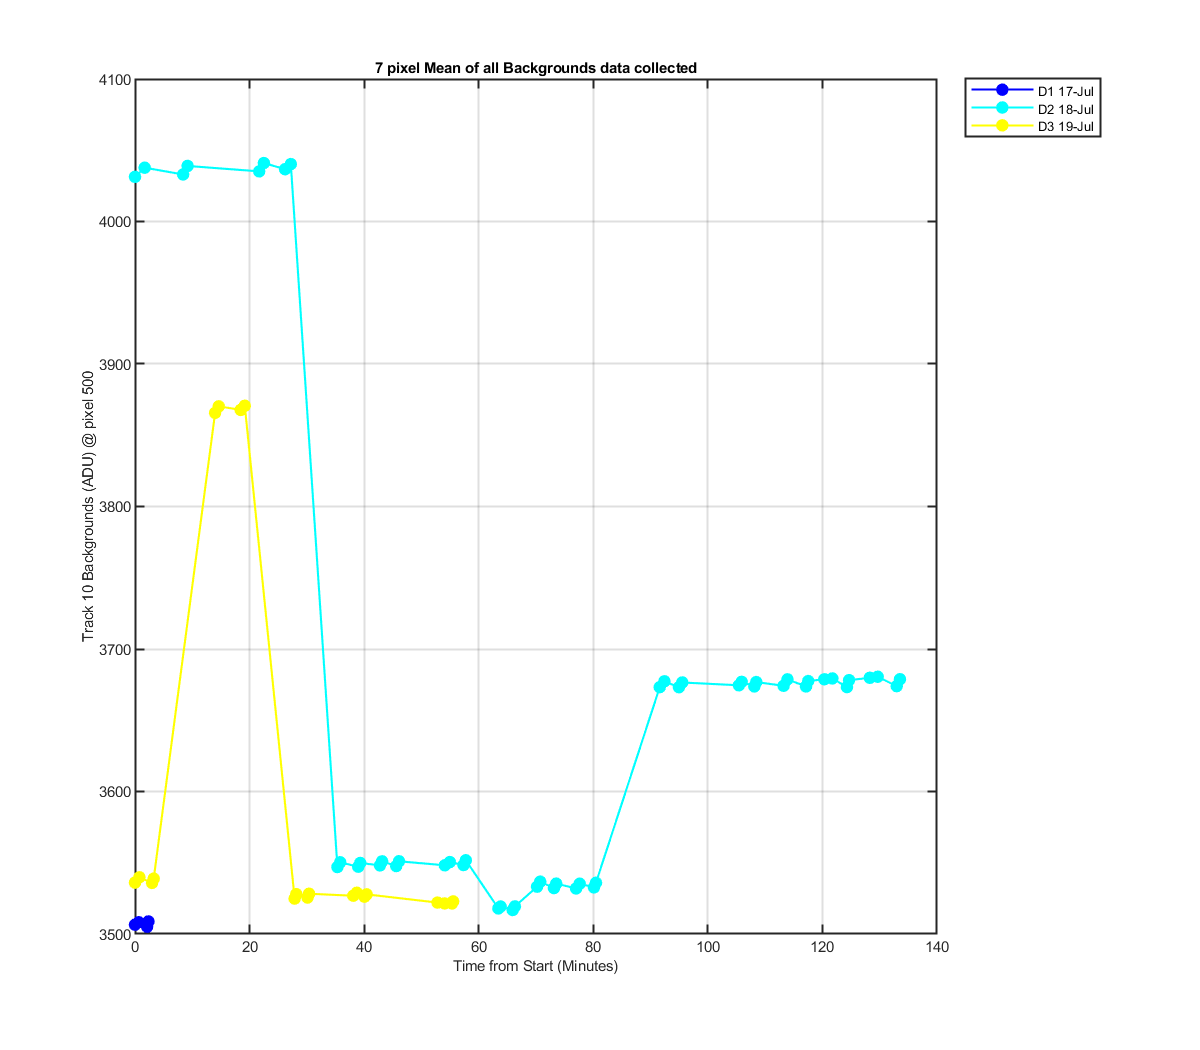
Figure 10 The 7 pxiels mean for each of the tracks in ADU with a sensor attached plotted against the time since the first data set in the file. This allows you to see the change in the Background during experiment data collection.
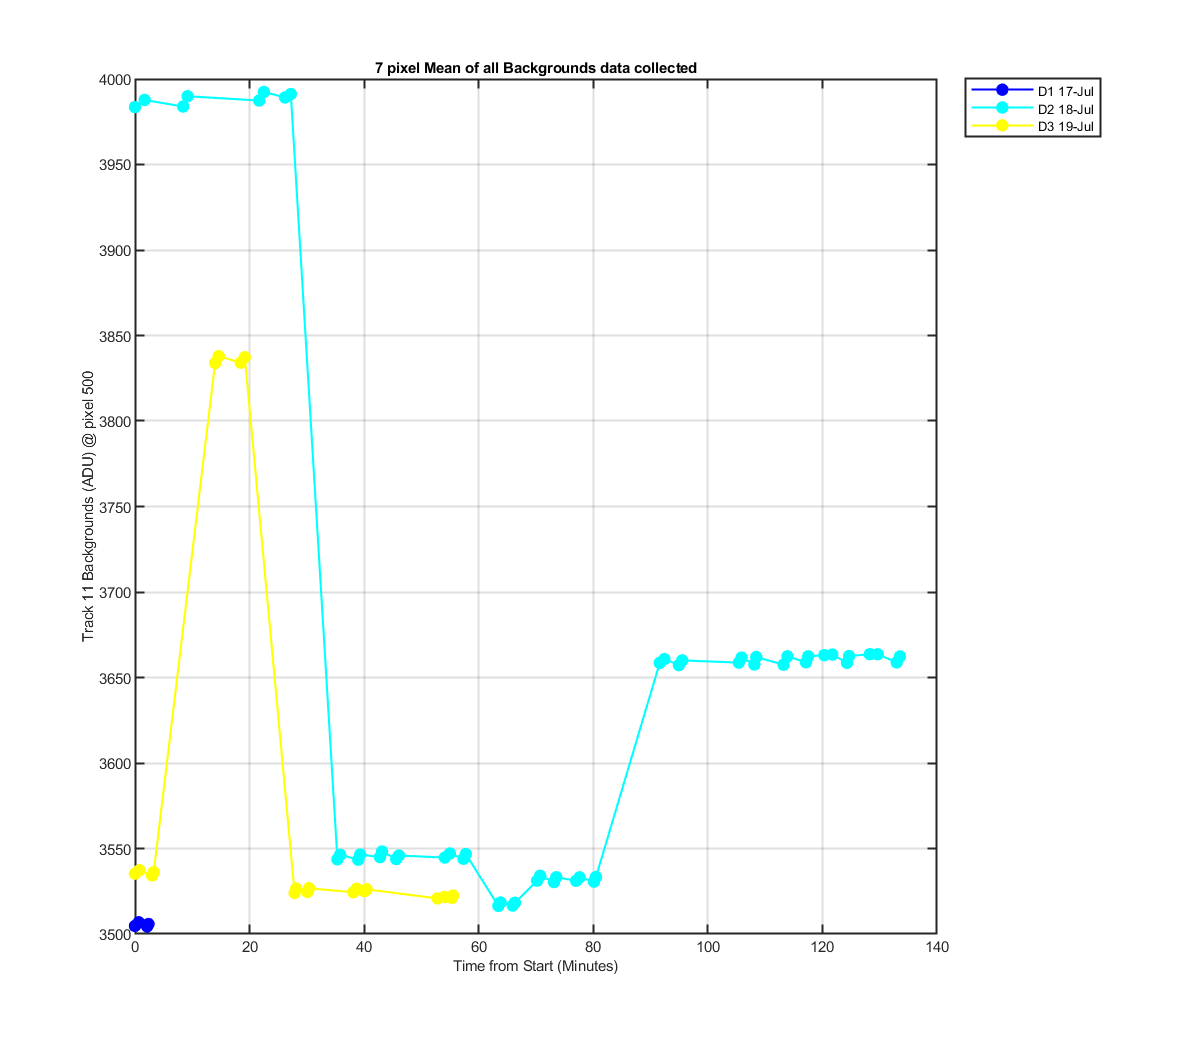
Figure 11 The 7 pxiels mean for each of the tracks in ADU with a sensor attached plotted against the time since the first data set in the file. This allows you to see the change in the Background during experiment data collection.

Figure 12 The 7 pxiels mean for each of the tracks in ADU with a sensor attached plotted against the time since the first data set in the file. This allows you to see the change in the Background during experiment data collection.

Figure 13 The 7 pxiels mean for each of the tracks in ADU with a sensor attached plotted against the time since the first data set in the file. This allows you to see the change in the Background during experiment data collection.
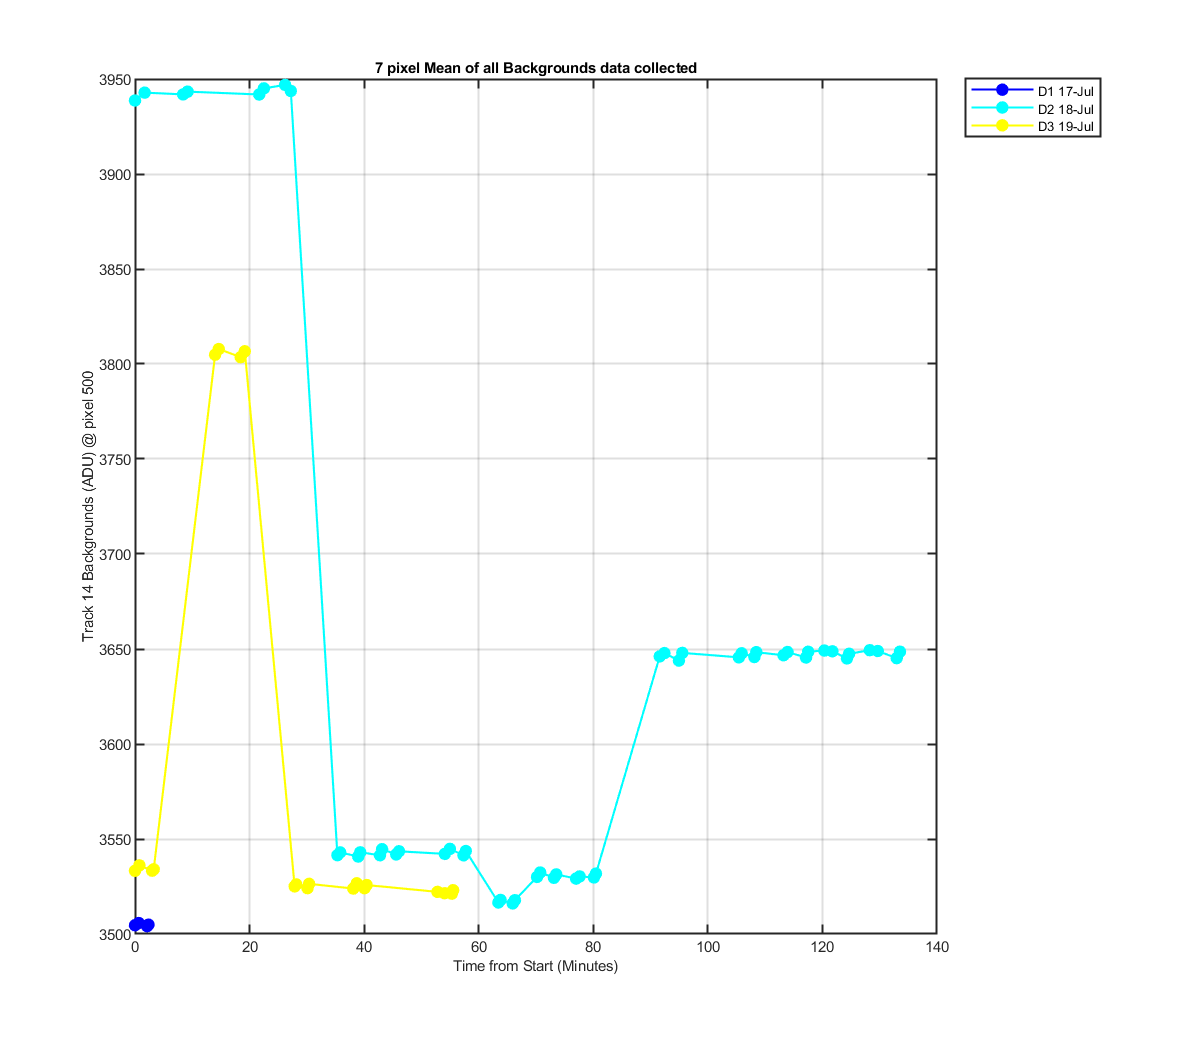
Figure 14 The 7 pxiels mean for each of the tracks in ADU with a sensor attached plotted against the time since the first data set in the file. This allows you to see the change in the Background during experiment data collection.

Figure 15 The 7 pxiels mean for each of the tracks in ADU/sec with a sensor attached plotted against the time since the first data set in the file. This allows you to see the change in the Background during experiment data collection.
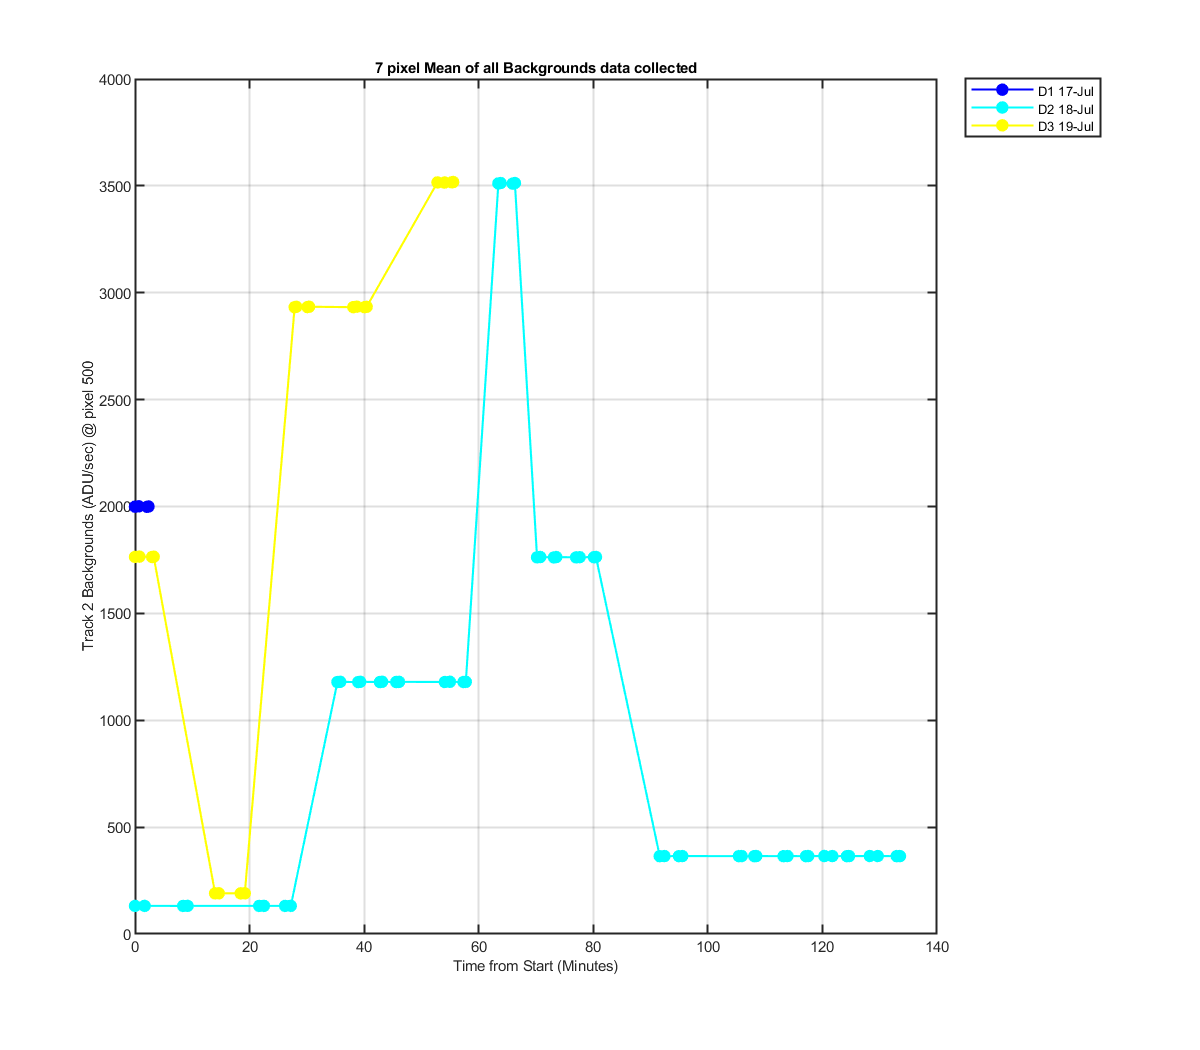
Figure 16 The 7 pxiels mean for each of the tracks in ADU/sec with a sensor attached plotted against the time since the first data set in the file. This allows you to see the change in the Background during experiment data collection.
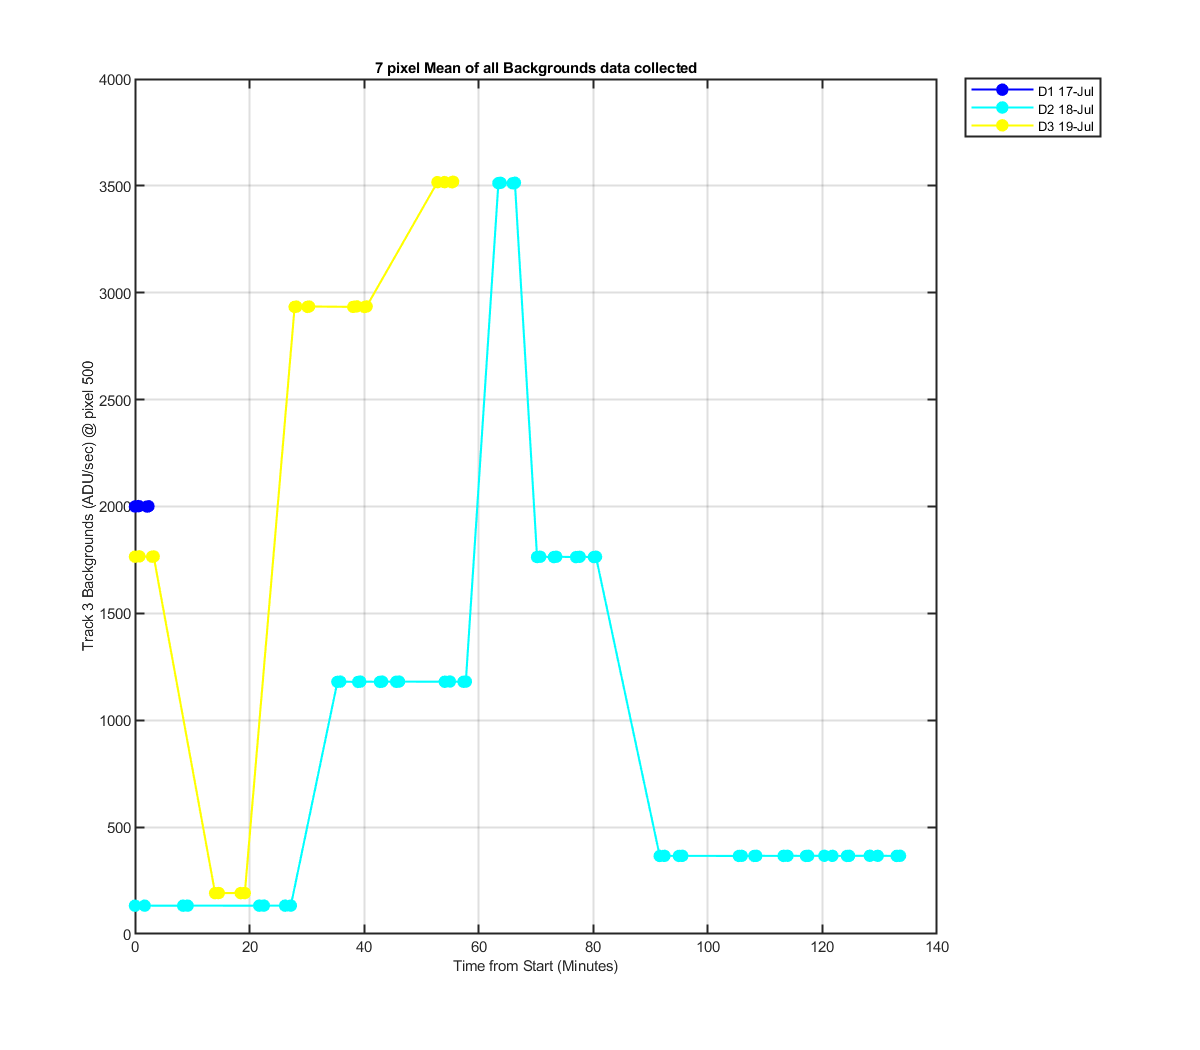
Figure 17 The 7 pxiels mean for each of the tracks in ADU/sec with a sensor attached plotted against the time since the first data set in the file. This allows you to see the change in the Background during experiment data collection.

Figure 18 The 7 pxiels mean for each of the tracks in ADU/sec with a sensor attached plotted against the time since the first data set in the file. This allows you to see the change in the Background during experiment data collection.

Figure 19 The 7 pxiels mean for each of the tracks in ADU/sec with a sensor attached plotted against the time since the first data set in the file. This allows you to see the change in the Background during experiment data collection.

Figure 20 The 7 pxiels mean for each of the tracks in ADU/sec with a sensor attached plotted against the time since the first data set in the file. This allows you to see the change in the Background during experiment data collection.

Figure 21 The 7 pxiels mean for each of the tracks in ADU/sec with a sensor attached plotted against the time since the first data set in the file. This allows you to see the change in the Background during experiment data collection.
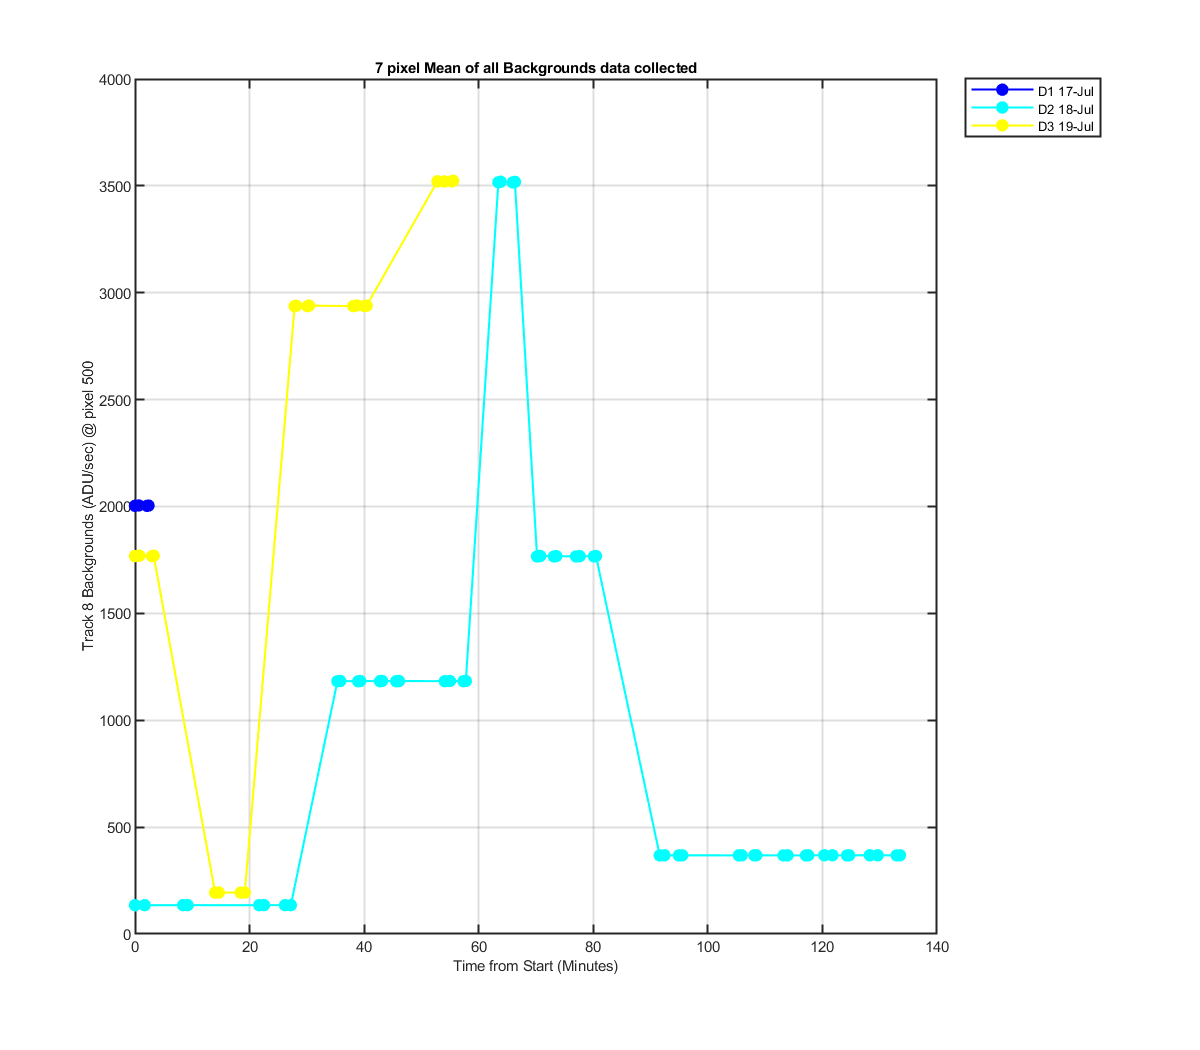
Figure 22 The 7 pxiels mean for each of the tracks in ADU/sec with a sensor attached plotted against the time since the first data set in the file. This allows you to see the change in the Background during experiment data collection.

Figure 23 The 7 pxiels mean for each of the tracks in ADU/sec with a sensor attached plotted against the time since the first data set in the file. This allows you to see the change in the Background during experiment data collection.

Figure 24 The 7 pxiels mean for each of the tracks in ADU/sec with a sensor attached plotted against the time since the first data set in the file. This allows you to see the change in the Background during experiment data collection.

Figure 25 The 7 pxiels mean for each of the tracks in ADU/sec with a sensor attached plotted against the time since the first data set in the file. This allows you to see the change in the Background during experiment data collection.

Figure 26 The 7 pxiels mean for each of the tracks in ADU/sec with a sensor attached plotted against the time since the first data set in the file. This allows you to see the change in the Background during experiment data collection.
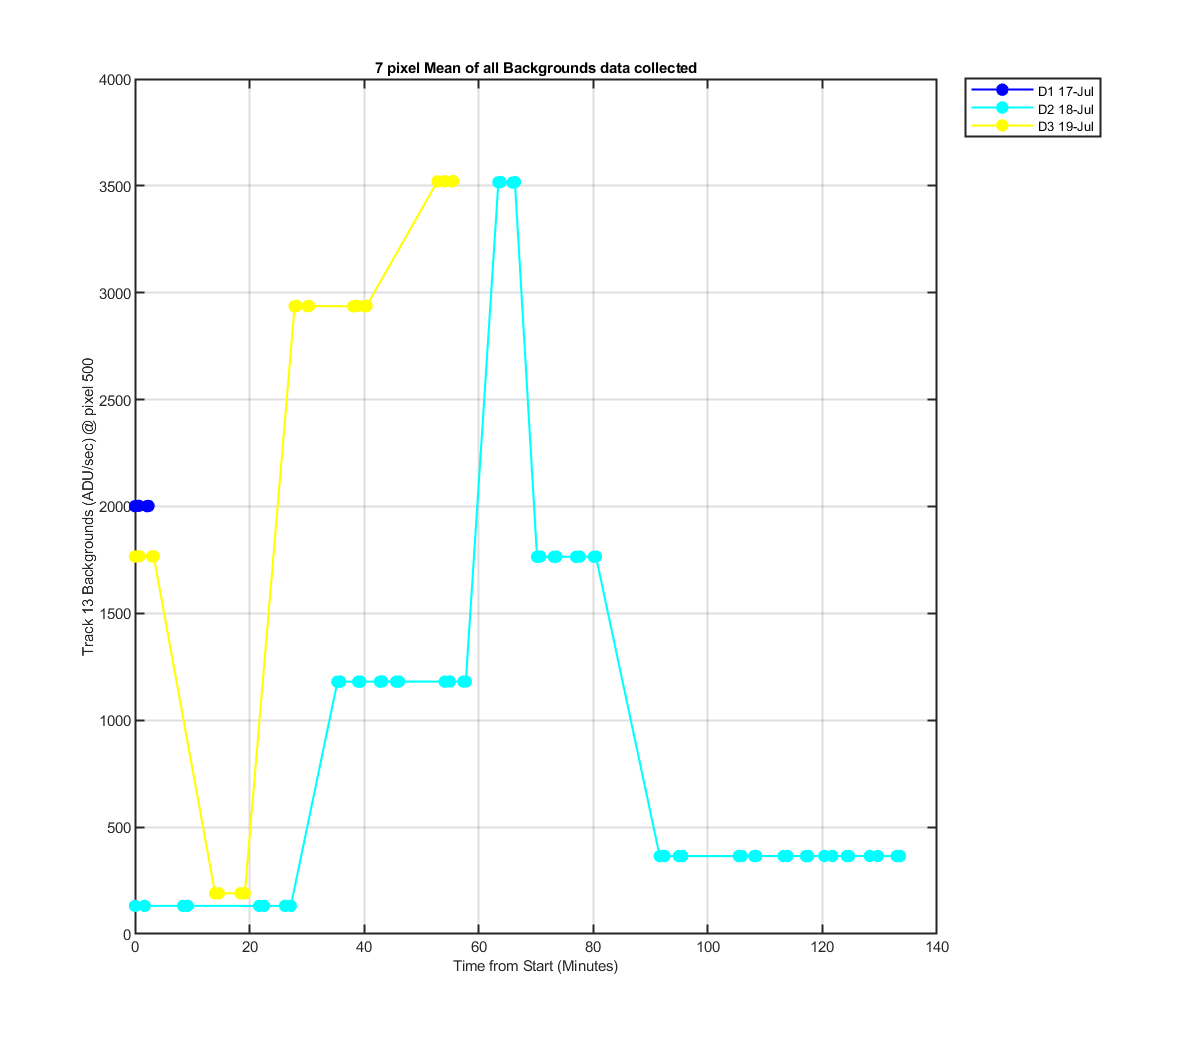
Figure 27 The 7 pxiels mean for each of the tracks in ADU/sec with a sensor attached plotted against the time since the first data set in the file. This allows you to see the change in the Background during experiment data collection.

Figure 28 The 7 pxiels mean for each of the tracks in ADU/sec with a sensor attached plotted against the time since the first data set in the file. This allows you to see the change in the Background during experiment data collection.
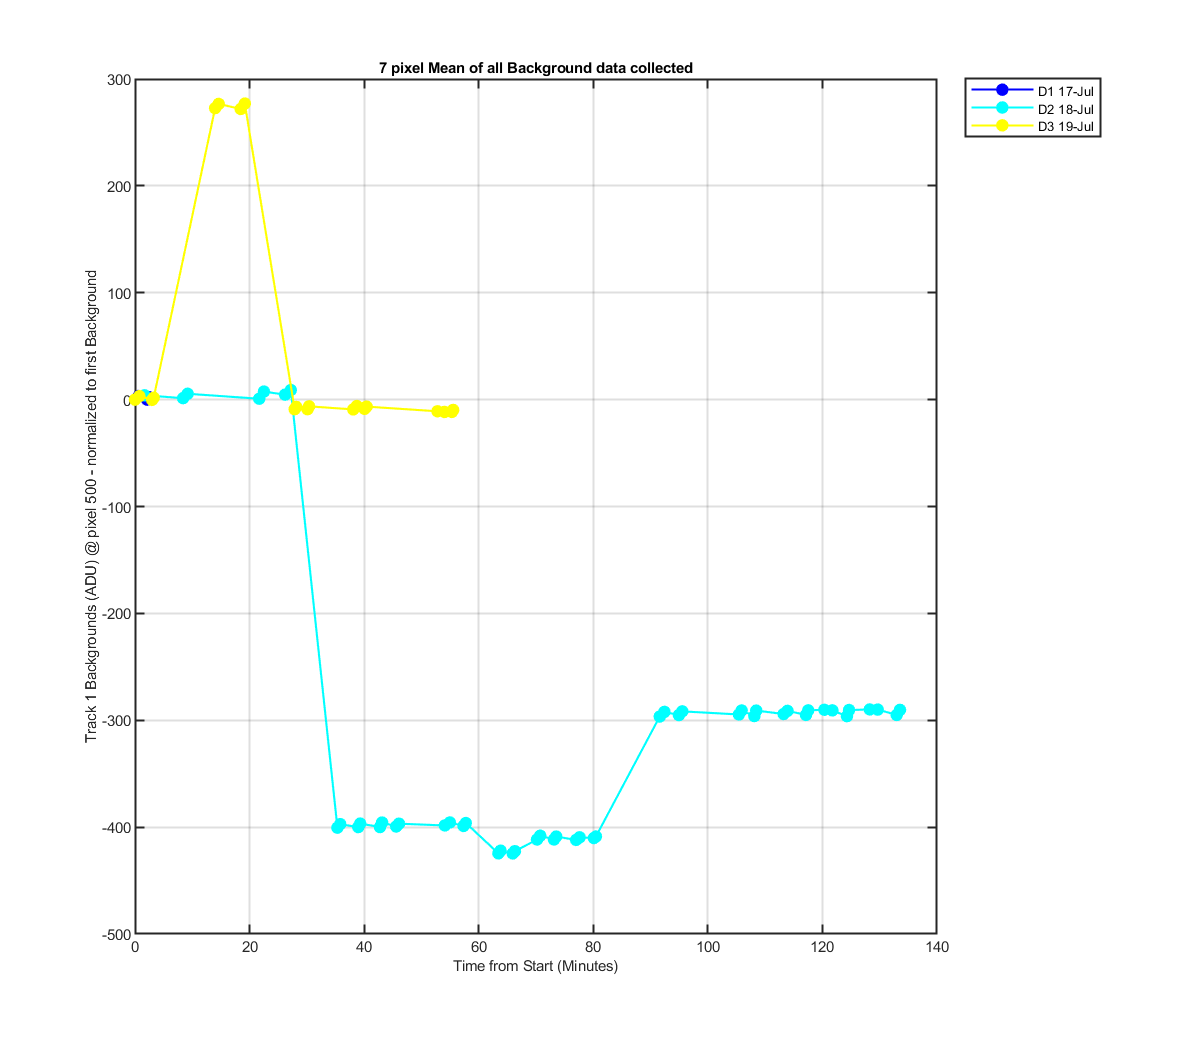
Figure 29 The same 7 pxiel mean as the previous graphs but I have subtracted off the first dark, so you can see the number of ADU change during the file. Starting them all at 0 ADU makes it easier to see how the files increase in Background compares.
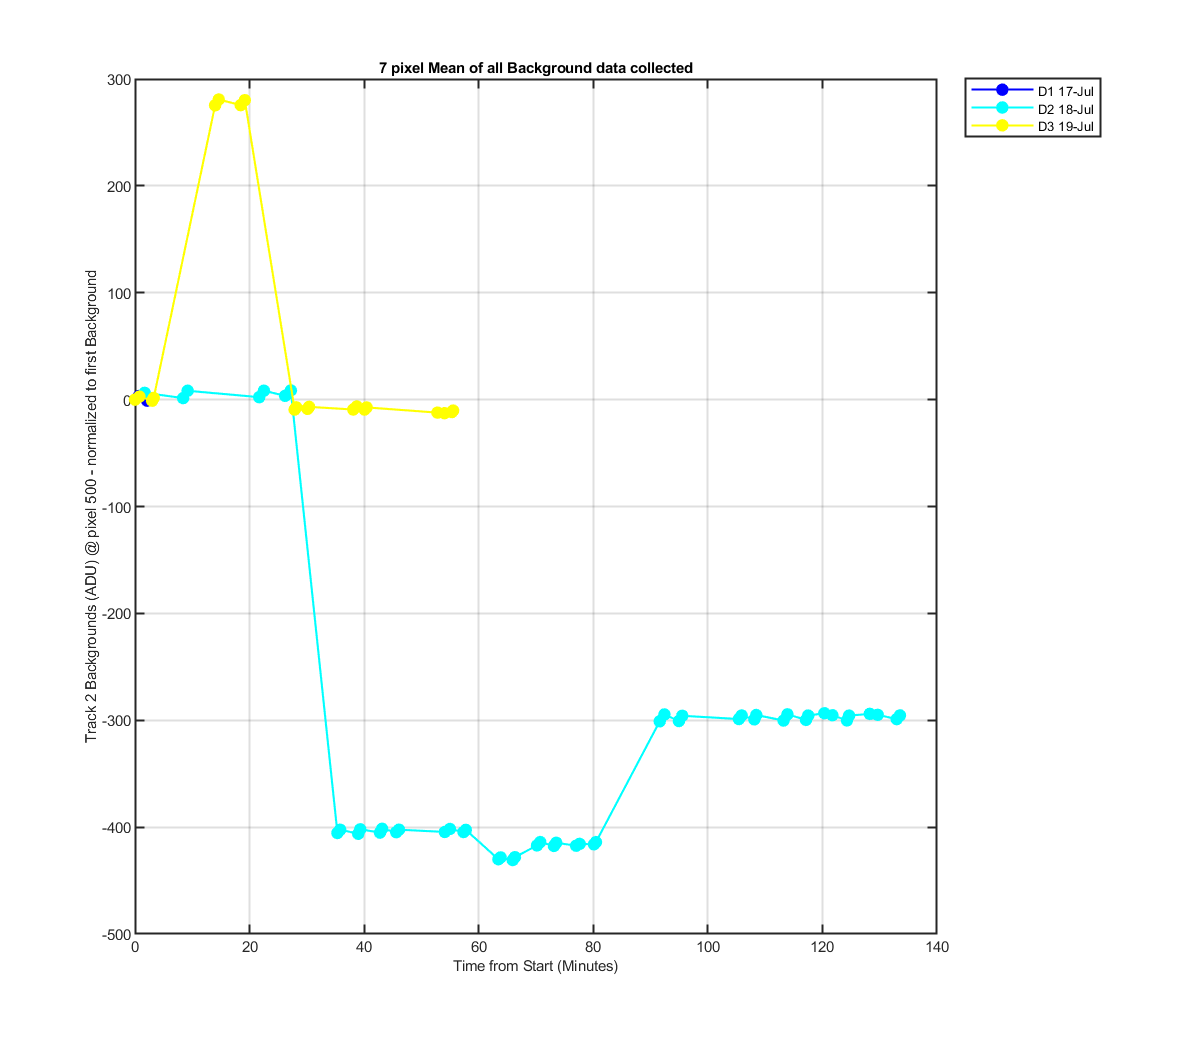
Figure 30
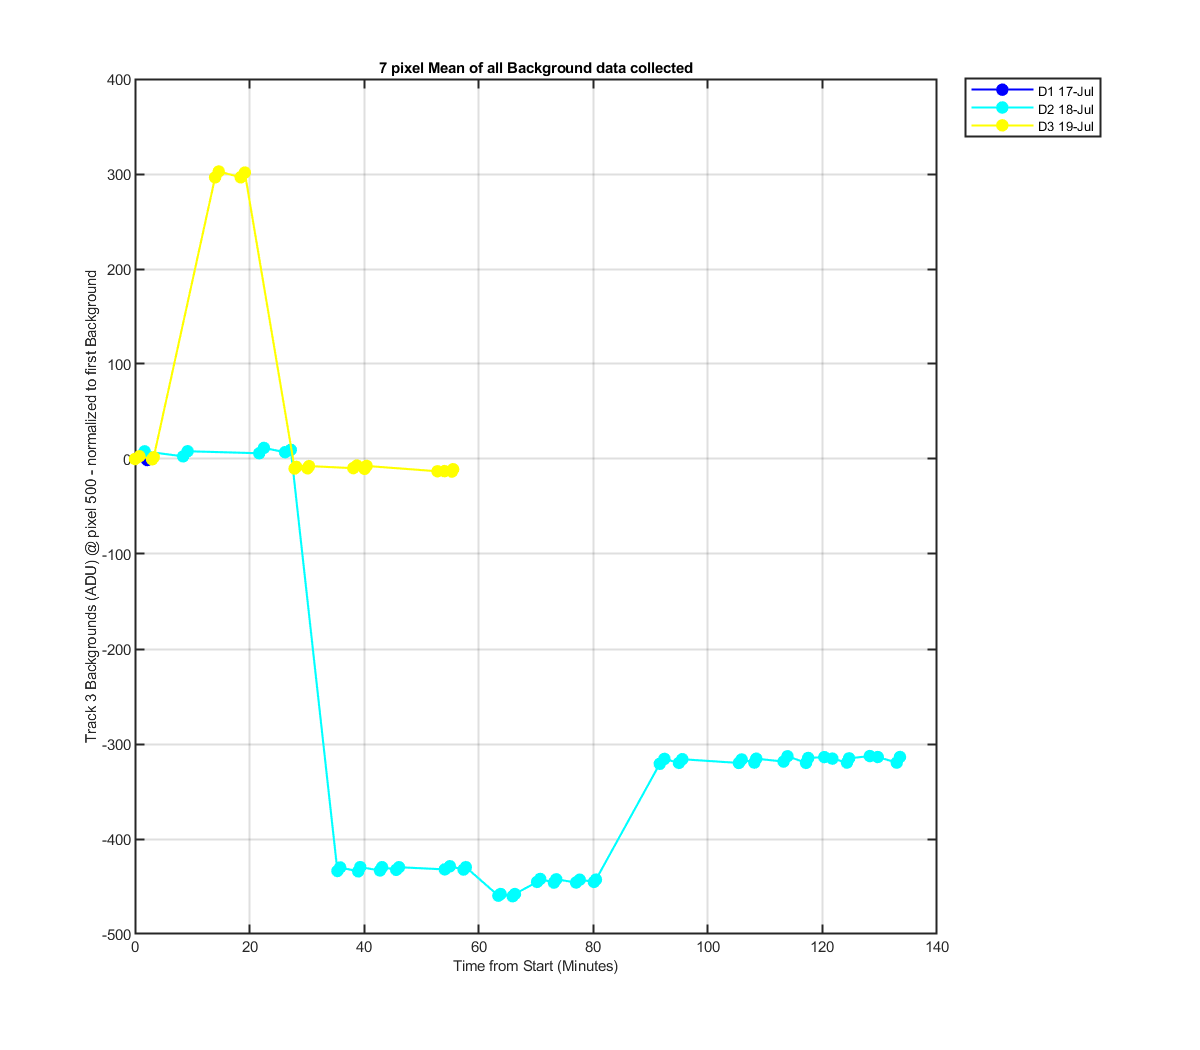
Figure 31
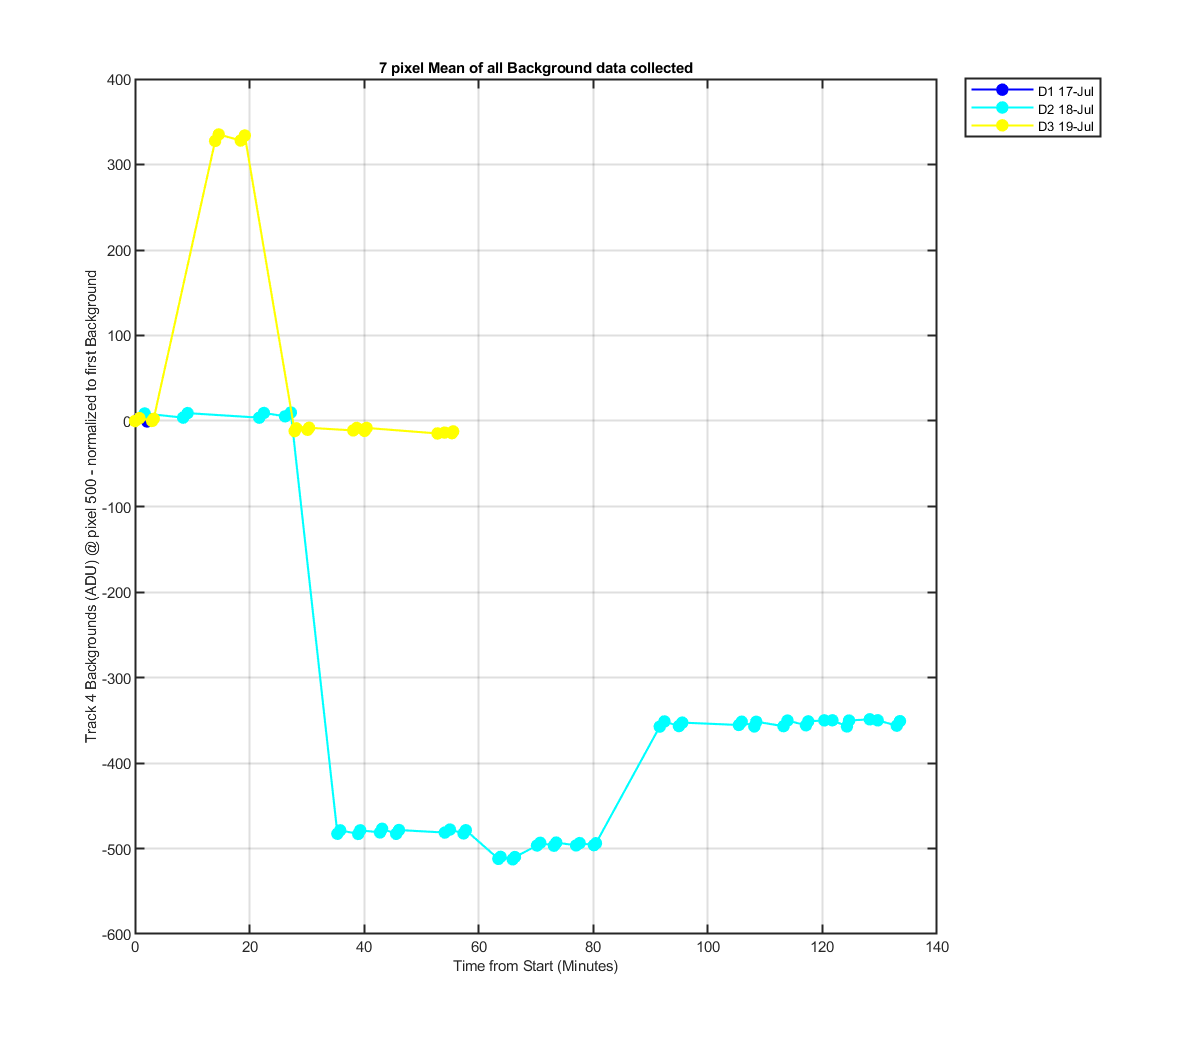
Figure 32

Figure 33
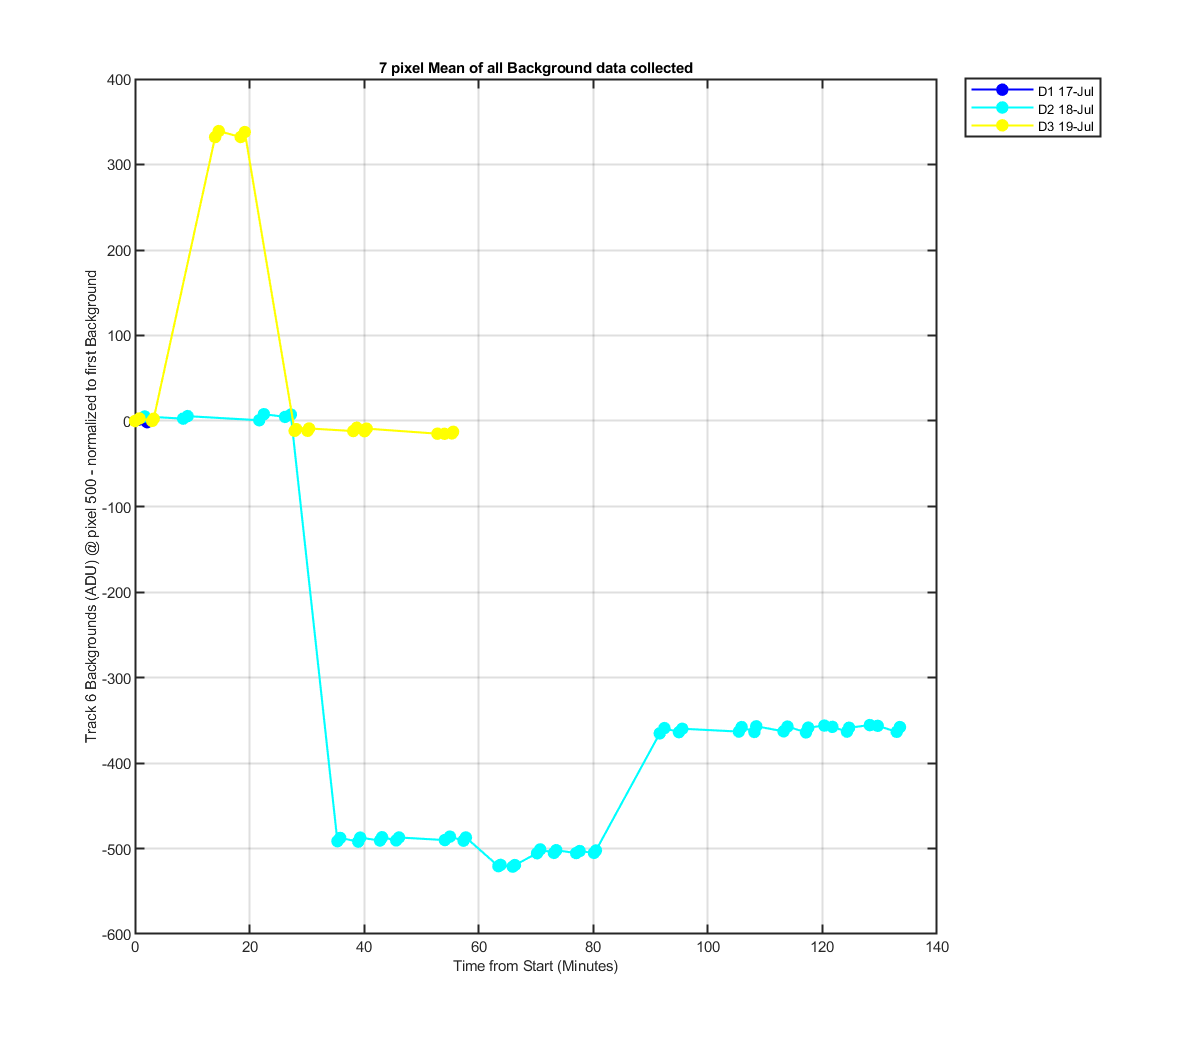
Figure 34
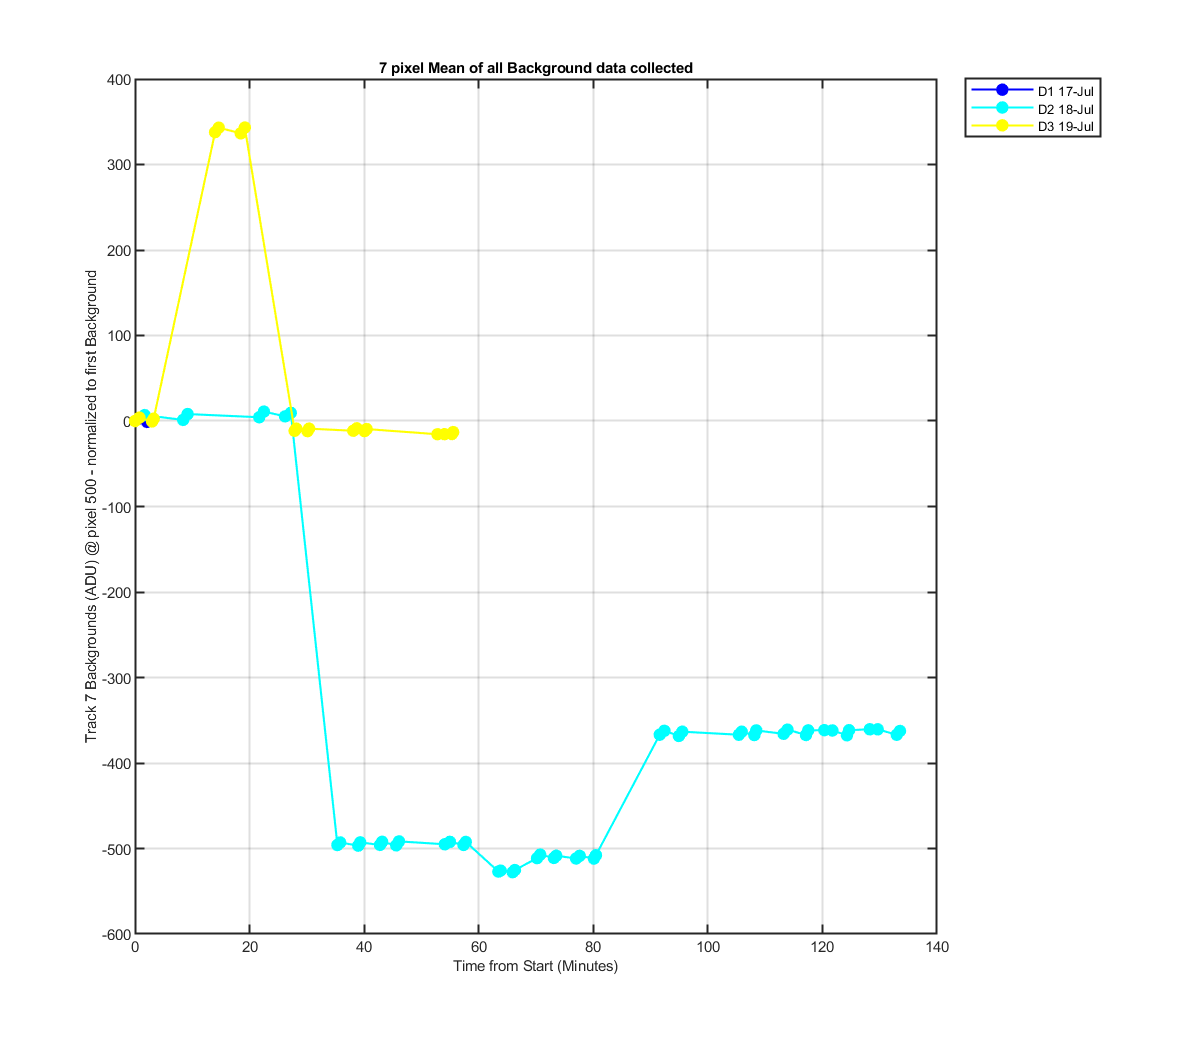
Figure 35

Figure 36

Figure 37

Figure 38
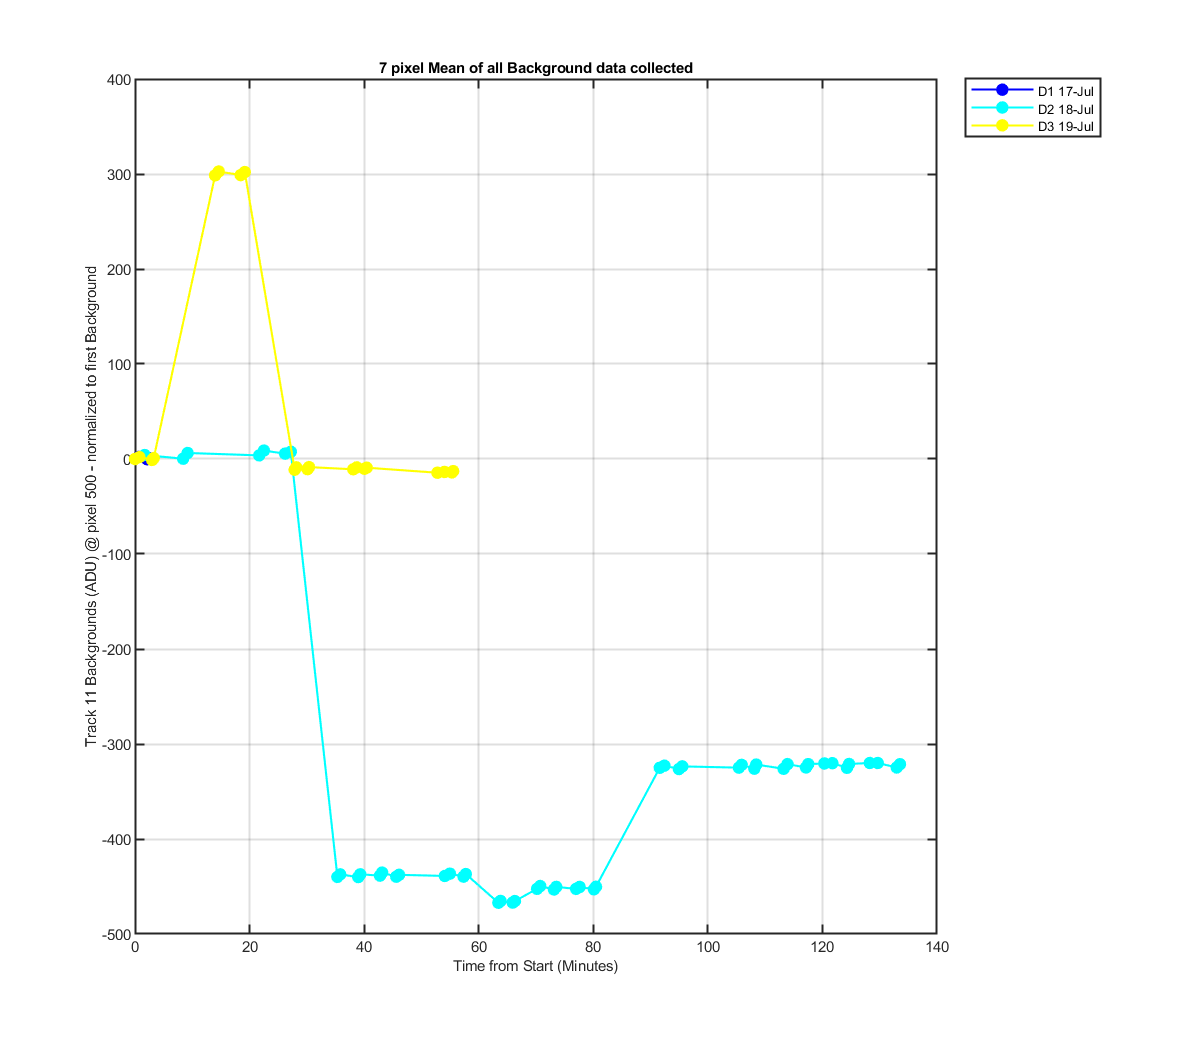
Figure 39
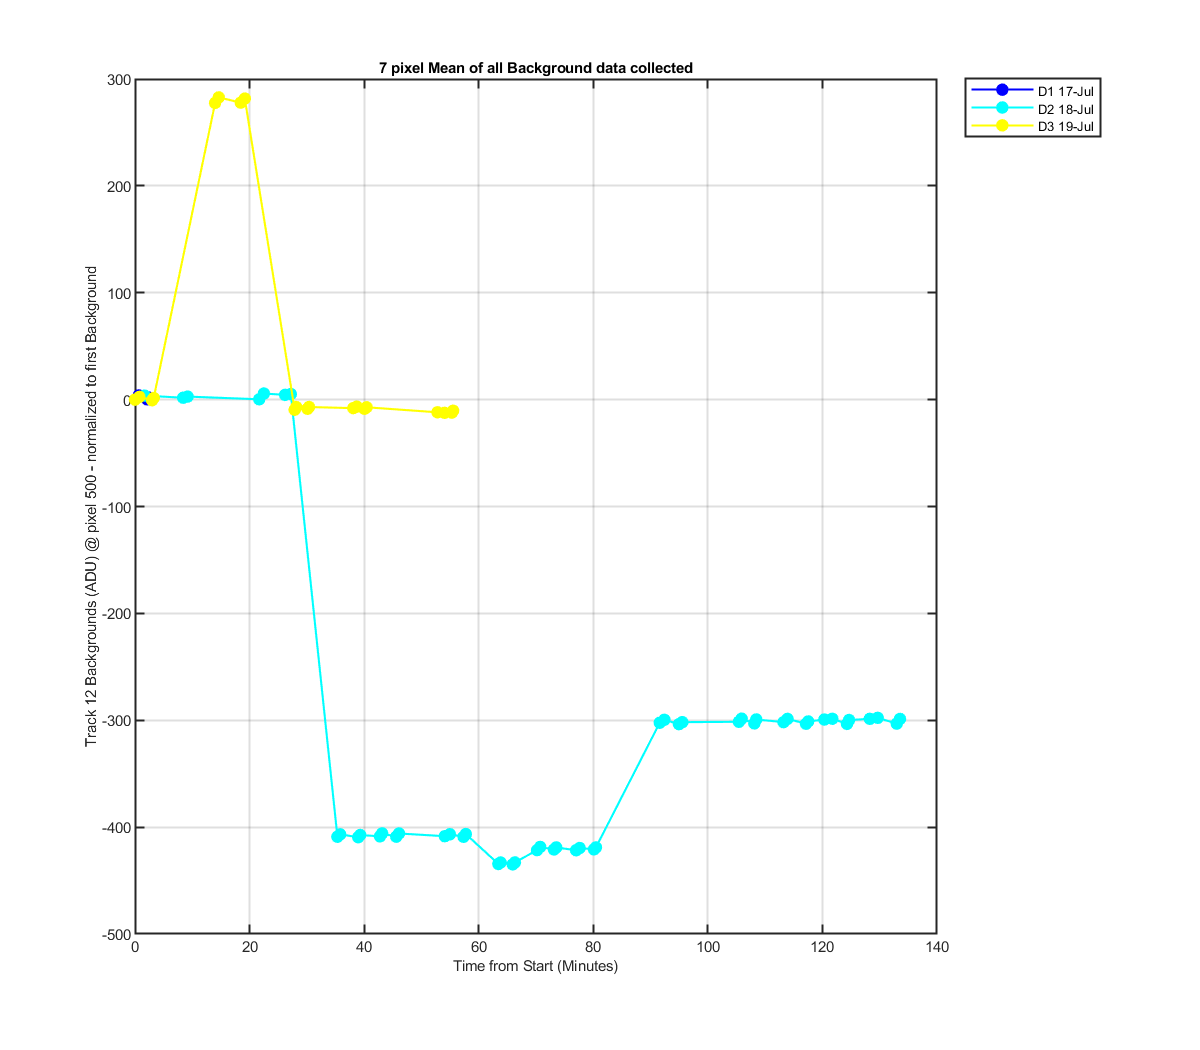
Figure 40
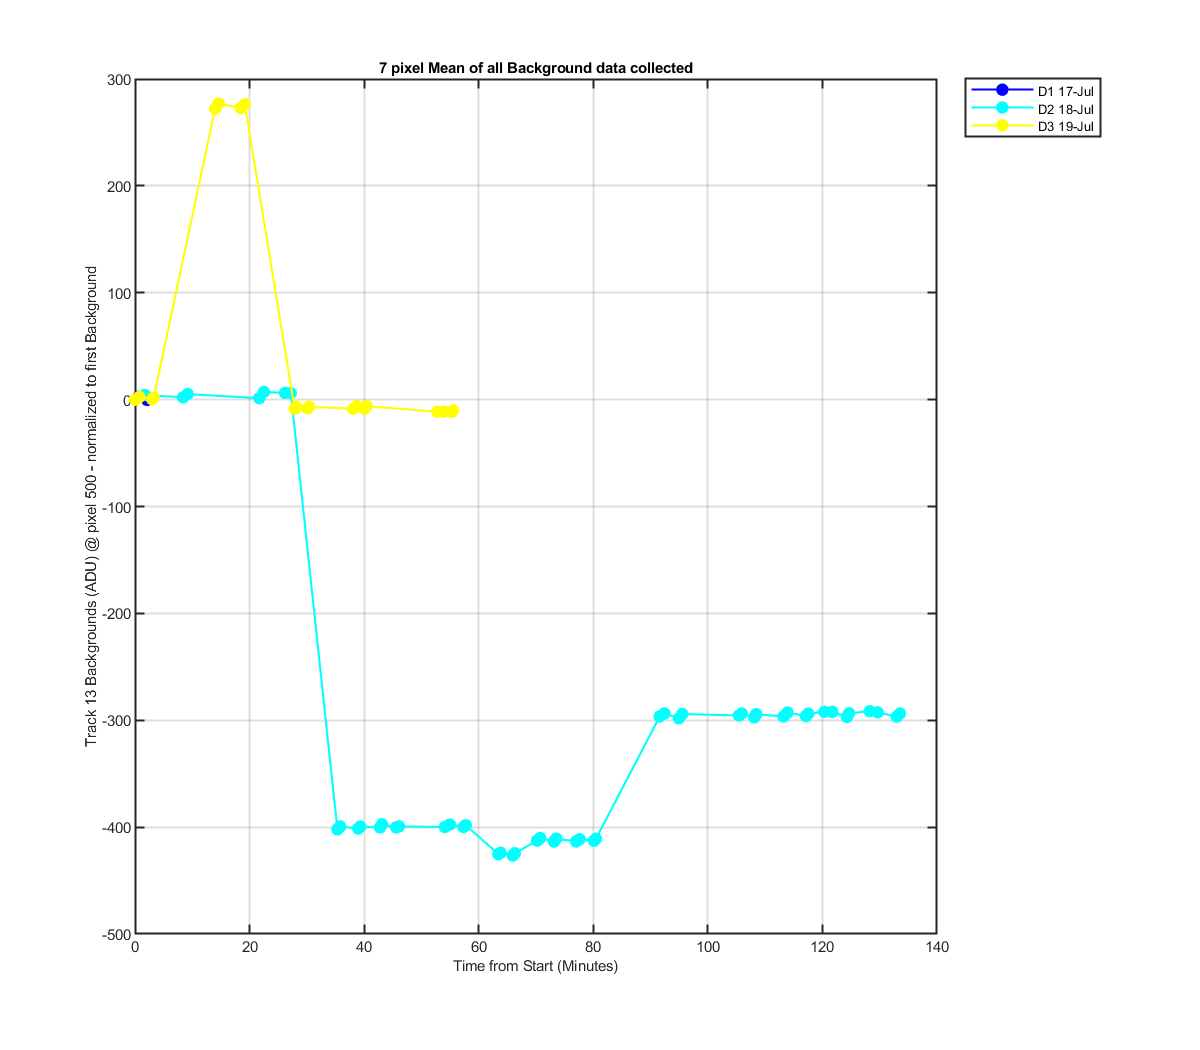
Figure 41

Figure 42
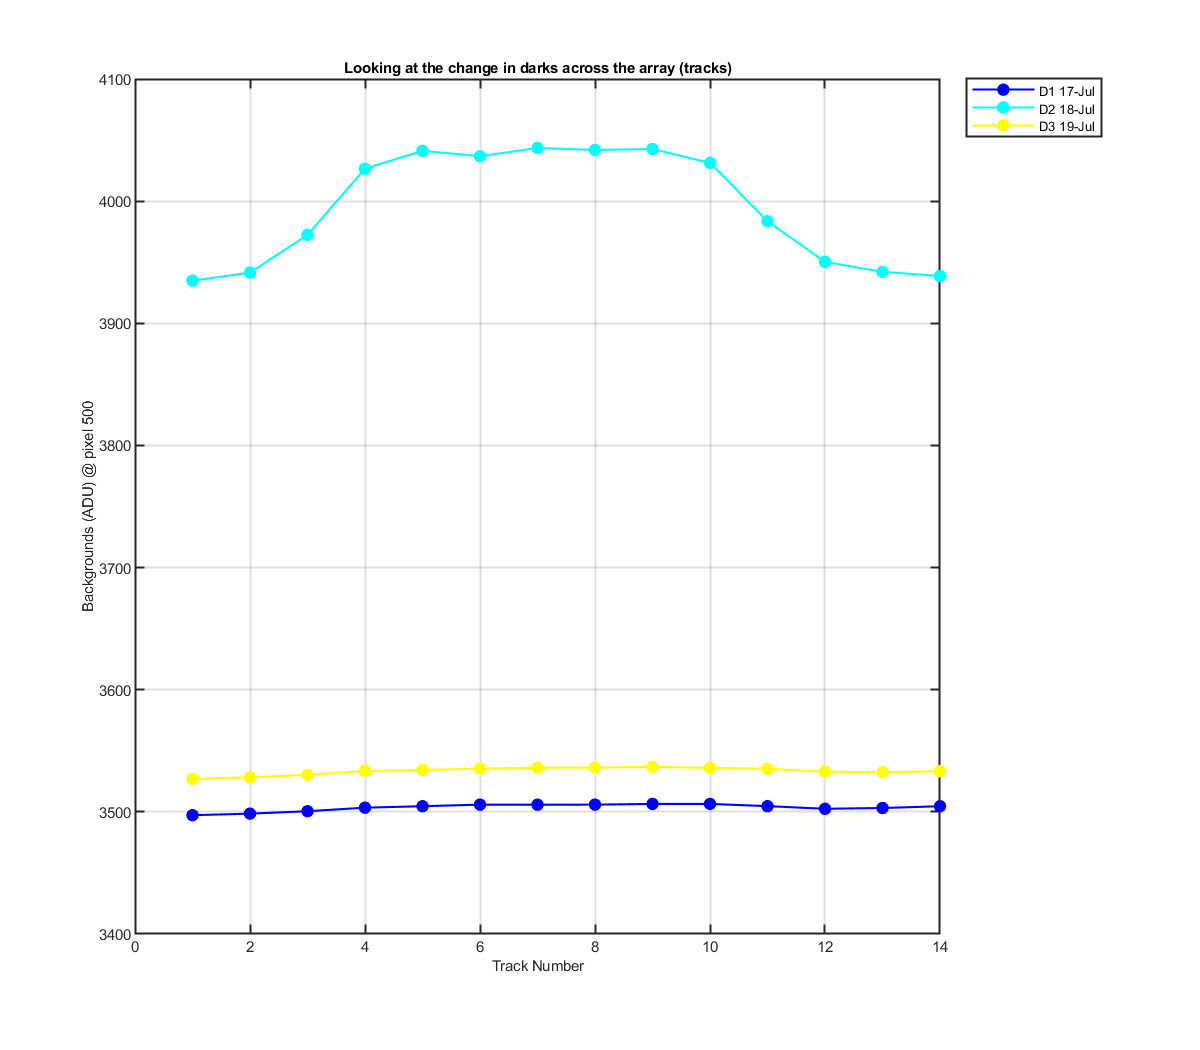
Figure 43 I wanted to see the change in the Background across the array (in the track direction). THis show the first data set taken for all the track for each file. Background on the image are highest on track 1 and decrease to track 14.
Figure 44 7 pixel mean for all tracks and all days of data. Just trying to see the change if any over time. The second graph is the percent standard deviation of the 7 pixels
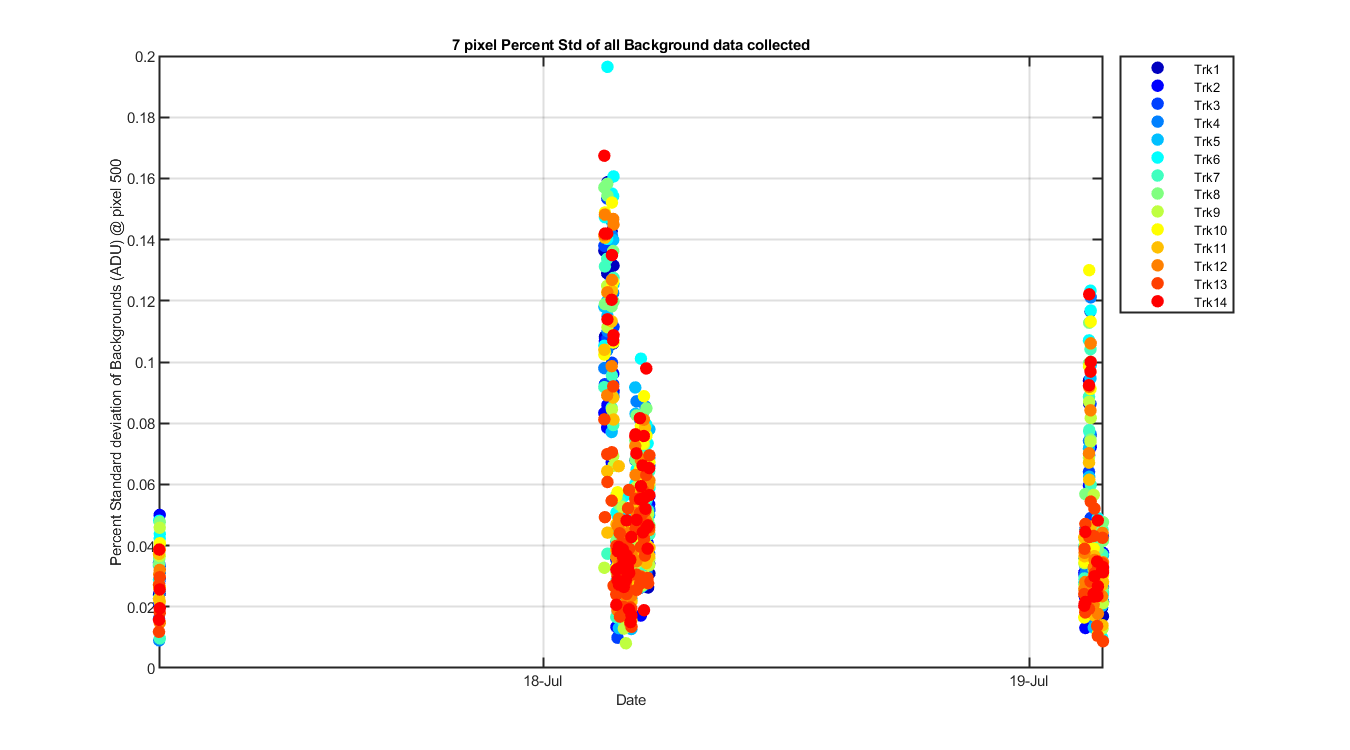
Figure 45
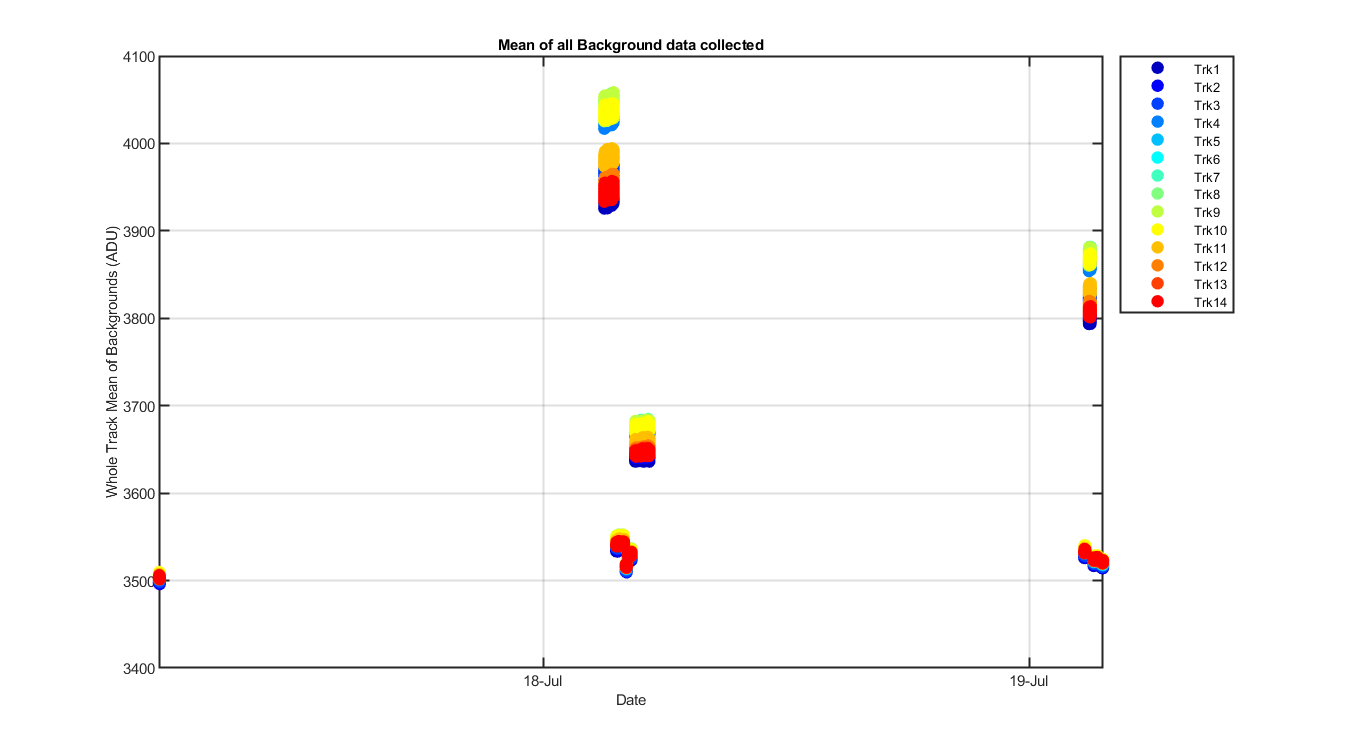
Figure 46 Whole track mean for all tracks and all days of data. Just trying to see the change if any over time and if the whole track is noisier (sine waves?) than the 7 pixel mean. The second graph is the percent standard deviation of the entire track.
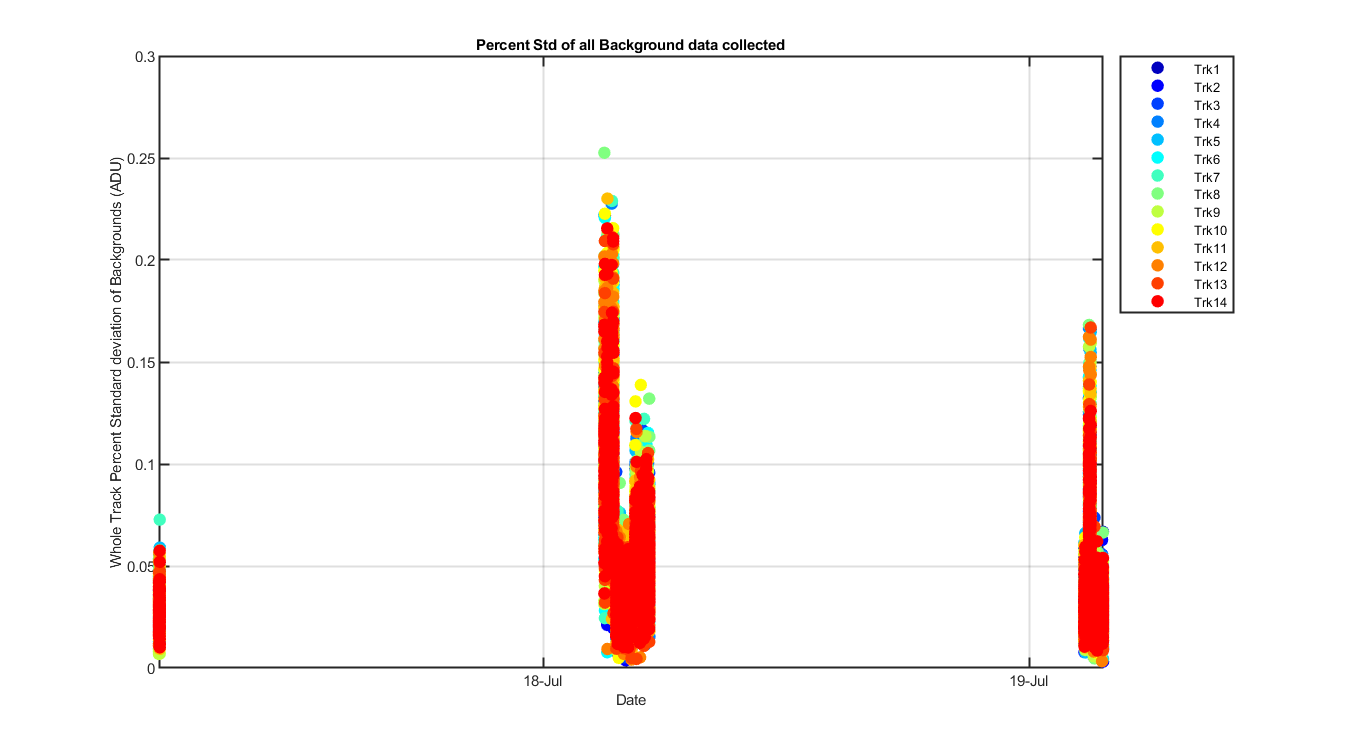
Figure 47