REVISION DATE: 10-Oct-2017 16:05:53
Looking at track definitions for this experiment the MOBY262 in-water data and the precal data from Hawaii-2017-01.
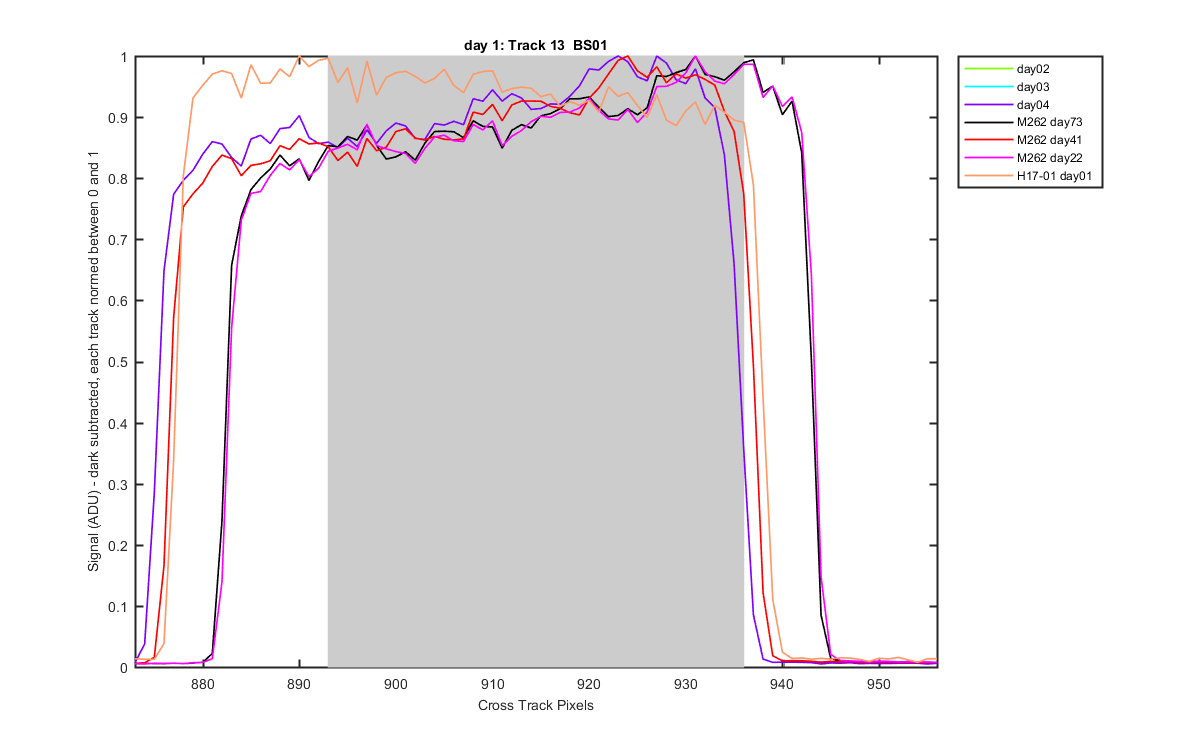
Track pixels:
Track:  1       2       3       4       5       6       7       8       9      10      11      12      13      14
Left:   12      90     163     239     312     386     458     530     602     675     747     820     893     966
Right:  60     136     208     281     353     426     498     569     642     712     787     860     936    1011
Plots of all the days data. With each track from each file normalized between 0 and 1. Note also from day01 to day02 the tracks moved their position a little bit to the left. For track 1 it is about 1.7 pixels. For Track 9 its about 1.5 pixels. For Track 11 its about 1.4 pixels. For Track 13 its about 1.65 pixels.
Figure 1
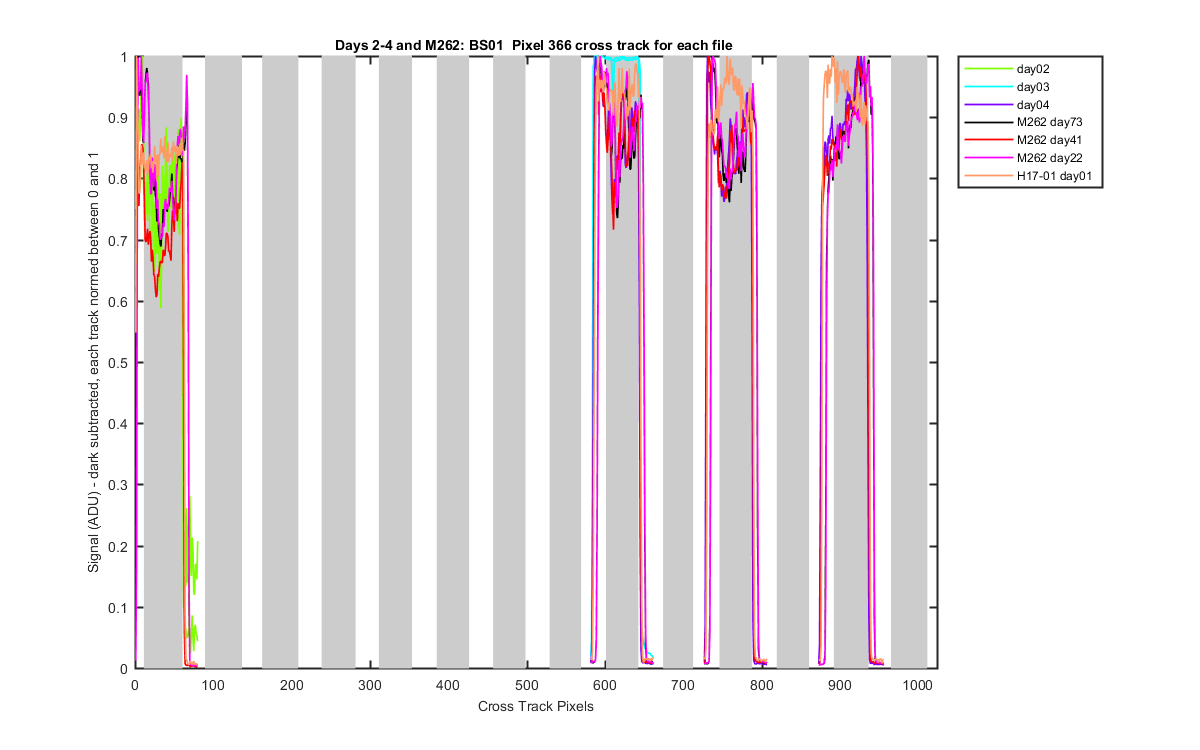
Figure 2
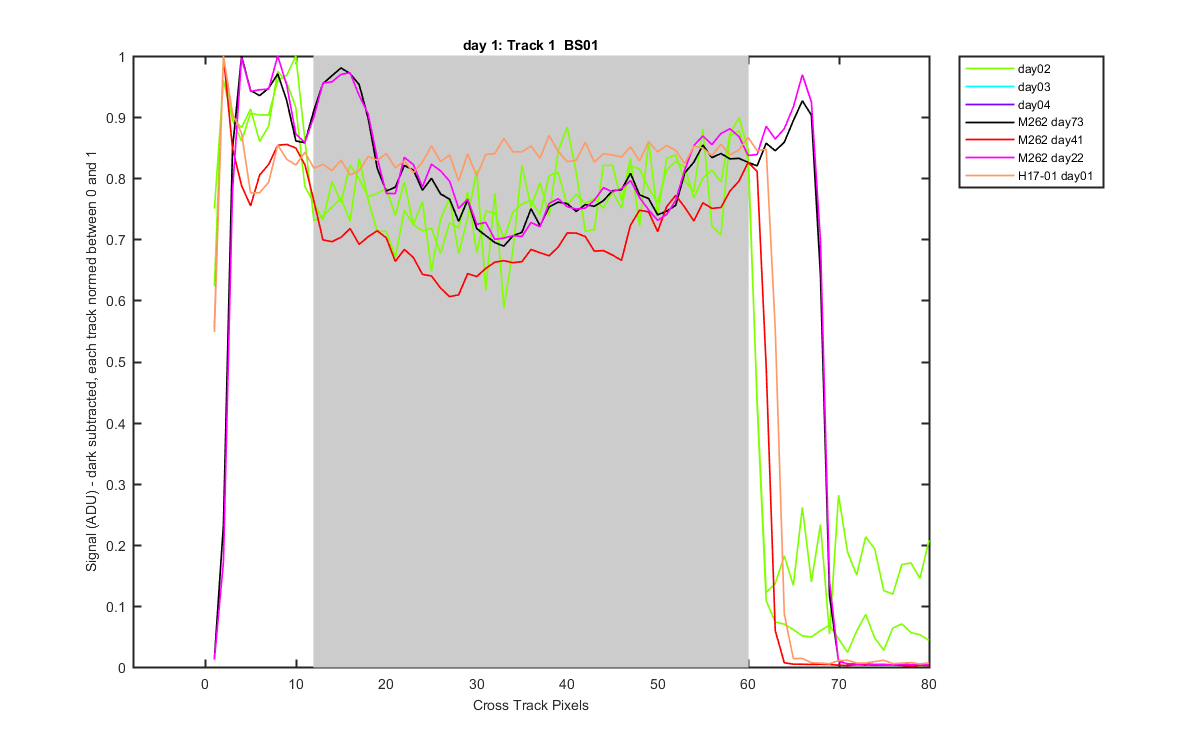
Figure 3
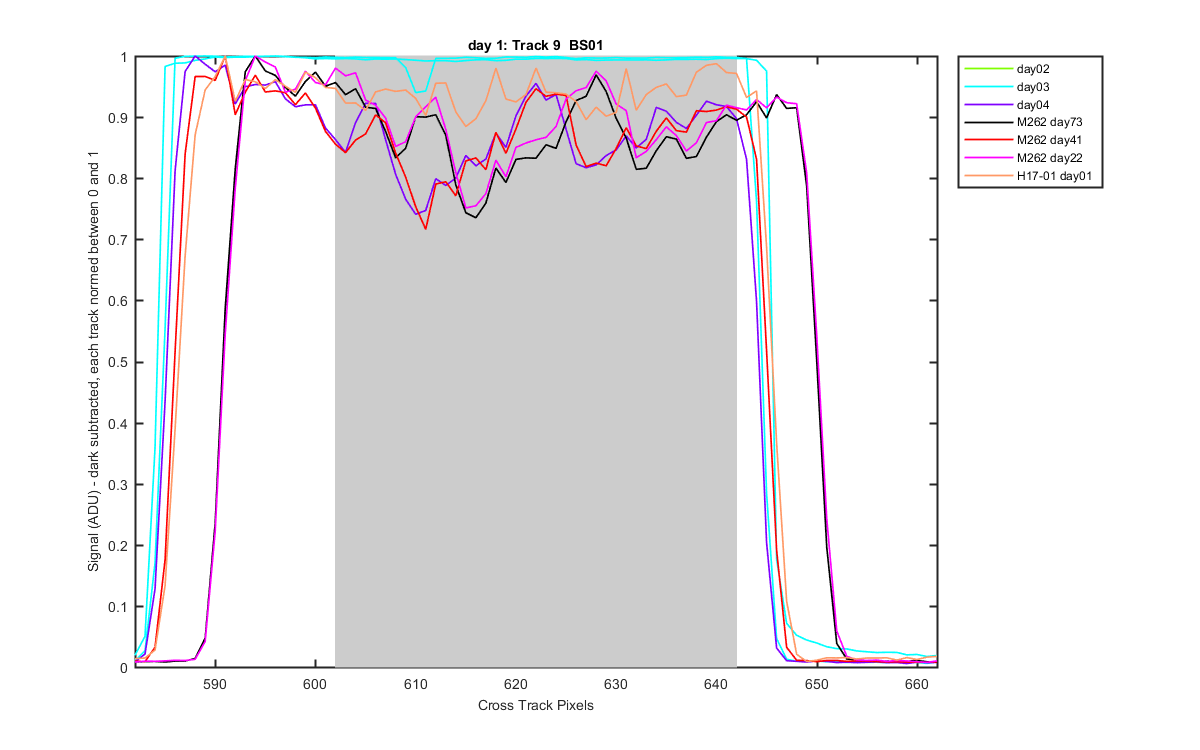
Figure 4
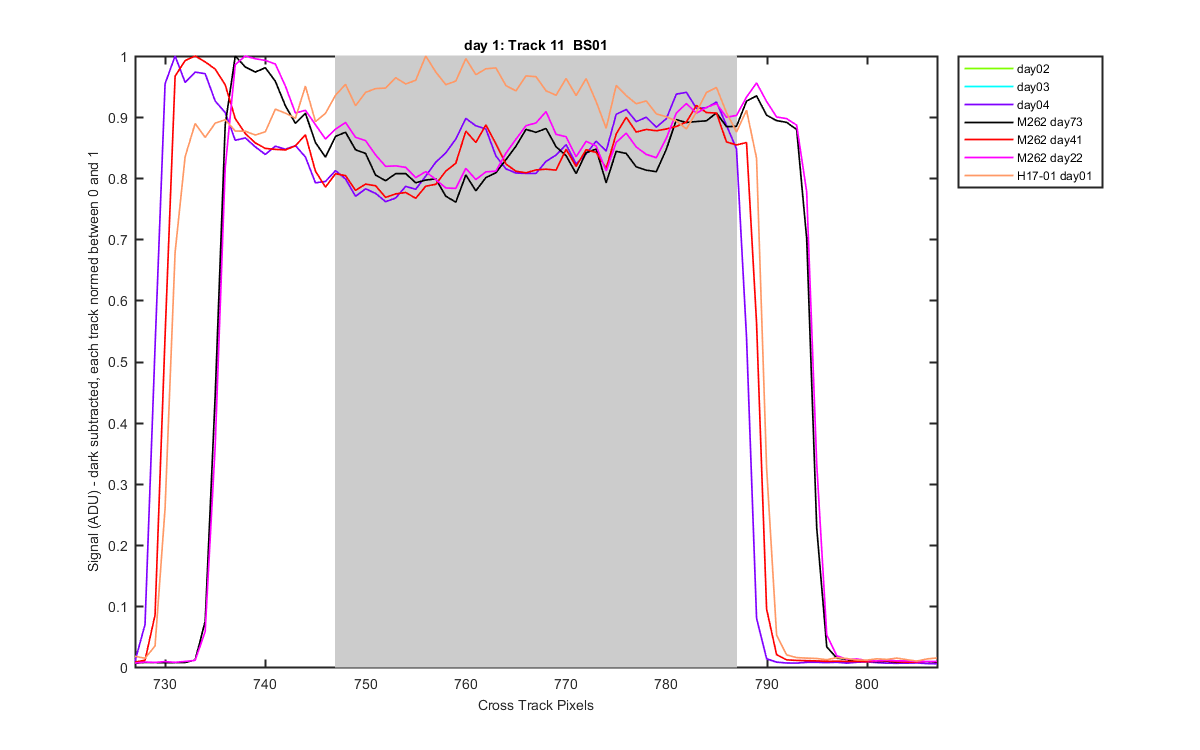
Figure 5