REVISION DATE: 06-Dec-2017 14:05:28
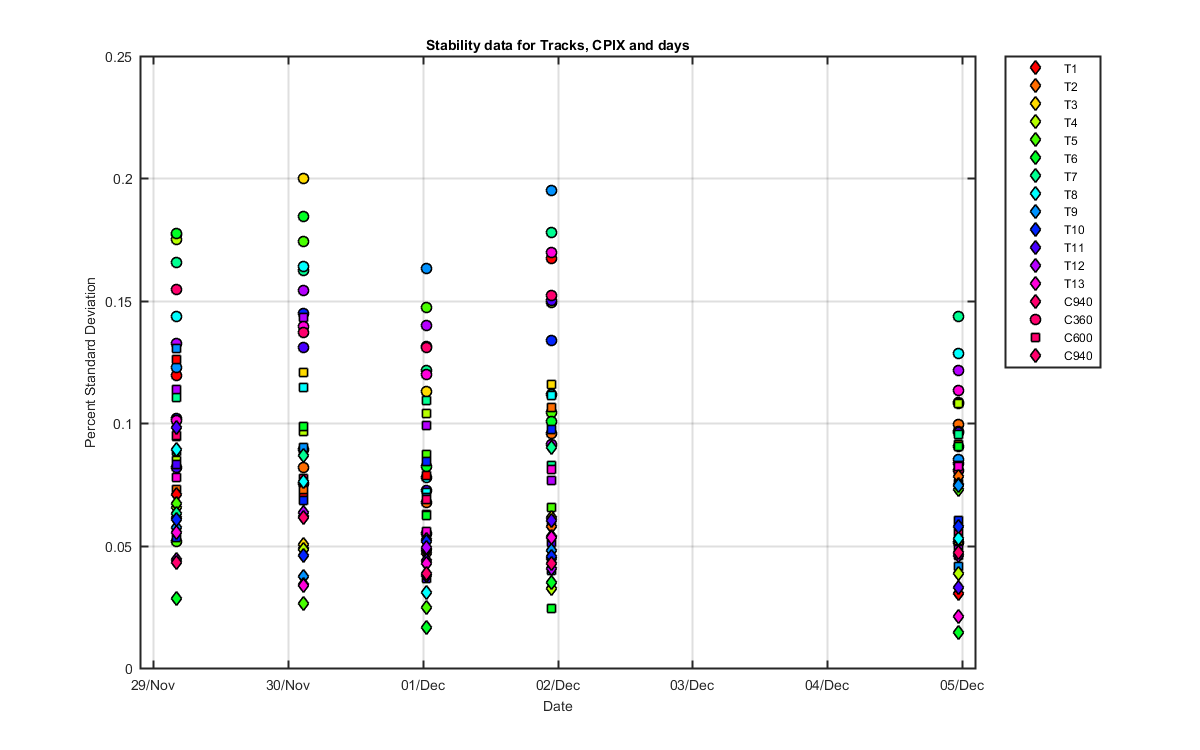
This is looking at the stability of the lamp data Mike is collecting in Hawaii over a number of days.
The table shows the mean of the 5 net lights and there percent standard deviation for each day and track. Nets are lite-dark divided by int time so units are ADU/pix/sec. The data are normalized to the ol455 monitor data by dividing the net signal by the ol455 data/2.391e-08.
| Track | Day | CPIX 360 Mean / %std |
CPIX 600 Mean / %std |
CPIX 940 Mean / %std |
|---|---|---|---|---|
| 1 | 1 | 663.774 / 0.120 | 1977.240 / 0.126 | 4895.827 / 0.071 |
| 1 | 2 | 664.798 / 0.089 | 1978.190 / 0.070 | 4899.020 / 0.062 |
| 1 | 3 | 664.381 / 0.131 | 1976.010 / 0.079 | 4896.077 / 0.047 |
| 1 | 4 | 664.643 / 0.167 | 1976.474 / 0.059 | 4895.690 / 0.041 |
| 1 | 5 | 664.506 / 0.108 | 1976.847 / 0.083 | 4895.187 / 0.030 |
| 2 | 1 | 645.134 / 0.177 | 1926.664 / 0.073 | 4842.265 / 0.062 |
| 2 | 2 | 645.481 / 0.082 | 1928.773 / 0.073 | 4845.050 / 0.049 |
| 2 | 3 | 645.619 / 0.068 | 1927.483 / 0.063 | 4843.485 / 0.047 |
| 2 | 4 | 645.408 / 0.096 | 1927.328 / 0.106 | 4841.620 / 0.058 |
| 2 | 5 | 646.194 / 0.100 | 1927.191 / 0.091 | 4843.948 / 0.078 |
| 3 | 1 | 654.201 / 0.166 | 1939.104 / 0.088 | 4951.893 / 0.067 |
| 3 | 2 | 654.282 / 0.200 | 1938.517 / 0.121 | 4954.025 / 0.051 |
| 3 | 3 | 654.525 / 0.113 | 1938.596 / 0.053 | 4951.565 / 0.048 |
| 3 | 4 | 654.608 / 0.112 | 1937.954 / 0.116 | 4949.726 / 0.062 |
| 3 | 5 | 654.449 / 0.051 | 1937.605 / 0.052 | 4949.281 / 0.039 |
| 4 | 1 | 663.529 / 0.175 | 1973.104 / 0.085 | 5079.270 / 0.066 |
| 4 | 2 | 664.075 / 0.145 | 1972.906 / 0.097 | 5078.684 / 0.049 |
| 4 | 3 | 664.291 / 0.055 | 1973.847 / 0.104 | 5079.465 / 0.038 |
| 4 | 4 | 664.402 / 0.149 | 1971.752 / 0.059 | 5075.271 / 0.033 |
| 4 | 5 | 664.615 / 0.083 | 1972.785 / 0.108 | 5076.850 / 0.038 |
| 5 | 1 | 613.987 / 0.052 | 1858.075 / 0.055 | 4894.779 / 0.067 |
| 5 | 2 | 614.877 / 0.174 | 1857.904 / 0.077 | 4892.712 / 0.026 |
| 5 | 3 | 615.958 / 0.147 | 1859.150 / 0.087 | 4896.205 / 0.025 |
| 5 | 4 | 614.575 / 0.104 | 1857.222 / 0.066 | 4890.663 / 0.045 |
| 5 | 5 | 615.421 / 0.097 | 1858.050 / 0.055 | 4893.071 / 0.073 |
| 6 | 1 | 688.819 / 0.178 | 2048.394 / 0.088 | 5305.882 / 0.028 |
| 6 | 2 | 689.930 / 0.185 | 2049.635 / 0.099 | 5306.765 / 0.037 |
| 6 | 3 | 690.011 / 0.082 | 2050.138 / 0.062 | 5308.724 / 0.017 |
| 6 | 4 | 689.889 / 0.101 | 2048.131 / 0.024 | 5303.999 / 0.035 |
| 6 | 5 | 689.867 / 0.108 | 2049.786 / 0.091 | 5304.422 / 0.014 |
| 7 | 1 | 636.389 / 0.165 | 1877.688 / 0.111 | 4871.100 / 0.063 |
| 7 | 2 | 637.159 / 0.162 | 1878.091 / 0.077 | 4871.899 / 0.087 |
| 7 | 3 | 636.678 / 0.122 | 1877.271 / 0.109 | 4866.866 / 0.053 |
| 7 | 4 | 636.789 / 0.178 | 1876.416 / 0.083 | 4866.073 / 0.090 |
| 7 | 5 | 637.391 / 0.143 | 1875.319 / 0.095 | 4864.415 / 0.075 |
| 8 | 1 | 673.903 / 0.144 | 1991.496 / 0.094 | 5148.877 / 0.089 |
| 8 | 2 | 673.897 / 0.164 | 1992.688 / 0.115 | 5150.387 / 0.076 |
| 8 | 3 | 674.662 / 0.078 | 1992.192 / 0.072 | 5146.708 / 0.031 |
| 8 | 4 | 674.228 / 0.112 | 1991.253 / 0.111 | 5145.814 / 0.054 |
| 8 | 5 | 674.707 / 0.129 | 1991.780 / 0.075 | 5145.375 / 0.053 |
| 9 | 1 | 684.310 / 0.123 | 2027.014 / 0.130 | 5227.548 / 0.057 |
| 9 | 2 | 684.827 / 0.075 | 2027.145 / 0.090 | 5226.294 / 0.037 |
| 9 | 3 | 685.100 / 0.163 | 2027.712 / 0.070 | 5228.697 / 0.048 |
| 9 | 4 | 685.198 / 0.195 | 2025.736 / 0.040 | 5225.341 / 0.048 |
| 9 | 5 | 685.582 / 0.085 | 2026.158 / 0.041 | 5227.017 / 0.074 |
| 10 | 1 | 742.181 / 0.102 | 2210.775 / 0.053 | 5713.131 / 0.061 |
| 10 | 2 | 742.089 / 0.145 | 2210.265 / 0.069 | 5713.468 / 0.046 |
| 10 | 3 | 742.695 / 0.131 | 2211.750 / 0.084 | 5716.106 / 0.052 |
| 10 | 4 | 742.072 / 0.134 | 2209.415 / 0.097 | 5709.468 / 0.045 |
| 10 | 5 | 742.764 / 0.090 | 2209.562 / 0.060 | 5713.127 / 0.058 |
| 11 | 1 | 803.470 / 0.082 | 2402.856 / 0.083 | 6182.422 / 0.098 |
| 11 | 2 | 803.575 / 0.131 | 2403.149 / 0.076 | 6187.415 / 0.034 |
| 11 | 3 | 804.477 / 0.073 | 2404.230 / 0.036 | 6184.572 / 0.044 |
| 11 | 4 | 803.950 / 0.150 | 2402.751 / 0.051 | 6183.354 / 0.060 |
| 11 | 5 | 804.429 / 0.096 | 2403.333 / 0.046 | 6185.304 / 0.033 |
| 12 | 1 | 751.344 / 0.133 | 2240.563 / 0.114 | 5647.223 / 0.044 |
| 12 | 2 | 752.693 / 0.154 | 2241.854 / 0.143 | 5651.440 / 0.064 |
| 12 | 3 | 751.875 / 0.140 | 2240.207 / 0.099 | 5646.706 / 0.049 |
| 12 | 4 | 752.192 / 0.091 | 2239.510 / 0.077 | 5645.715 / 0.041 |
| 12 | 5 | 751.874 / 0.121 | 2241.038 / 0.049 | 5646.492 / 0.046 |
| 13 | 1 | 743.356 / 0.101 | 2232.466 / 0.078 | 5556.232 / 0.055 |
| 13 | 2 | 743.466 / 0.140 | 2232.074 / 0.076 | 5555.429 / 0.034 |
| 13 | 3 | 744.310 / 0.120 | 2234.120 / 0.056 | 5556.751 / 0.043 |
| 13 | 4 | 743.820 / 0.170 | 2231.877 / 0.081 | 5552.724 / 0.053 |
| 13 | 5 | 744.222 / 0.113 | 2232.169 / 0.082 | 5555.778 / 0.021 |
| 14 | 1 | 763.890 / 0.155 | 2281.159 / 0.095 | 5647.216 / 0.043 |
| 14 | 2 | 764.792 / 0.137 | 2282.245 / 0.077 | 5648.051 / 0.062 |
| 14 | 3 | 764.862 / 0.131 | 2282.438 / 0.069 | 5647.450 / 0.039 |
| 14 | 4 | 764.237 / 0.152 | 2280.055 / 0.044 | 5642.964 / 0.043 |
| 14 | 5 | 764.702 / 0.080 | 2282.128 / 0.056 | 5646.554 / 0.047 |
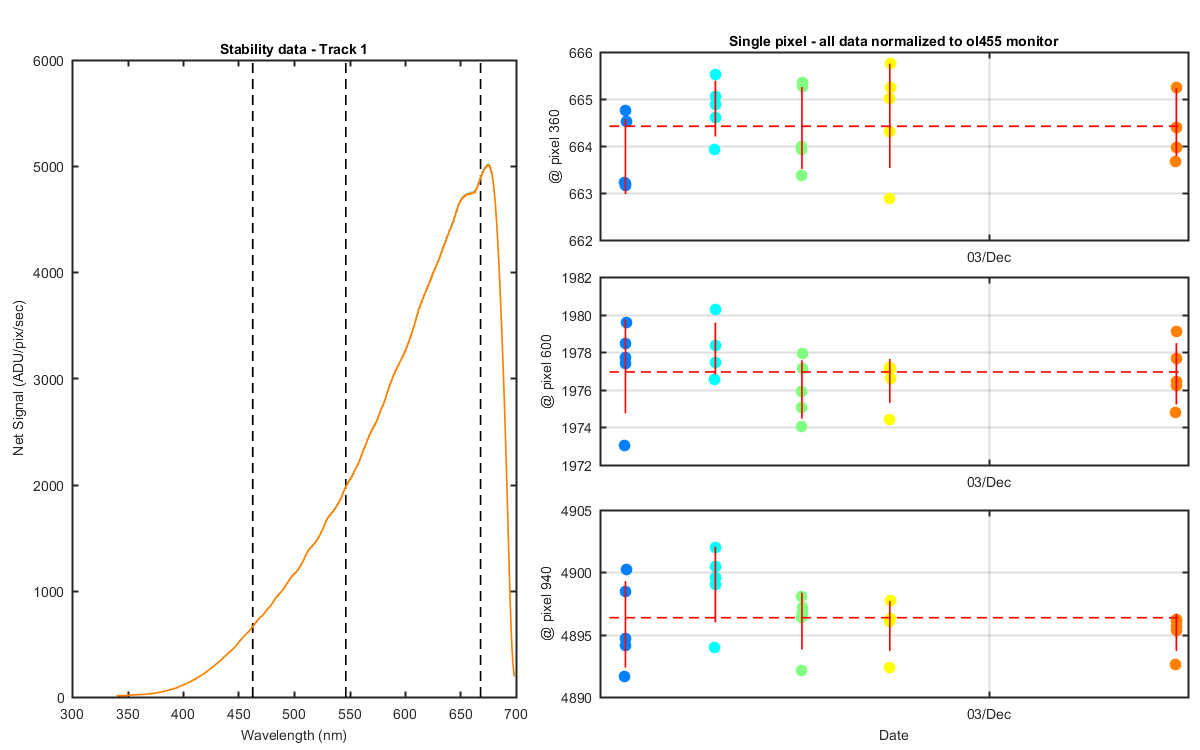
Track 1: showing each of the 5 net light scans for each days data. Nets are lite-dark divided by int time so units are ADU/pix/sec. The data are normalized to the ol455 monitor data by dividing the net signal by the ol455 data/2.391e-08. The black dahsed lines show the pixel locations of the data on the graphs to the right. The right 3 stacked panels shows a single pixel for each dark/day combo. The red line is the standard deviation of the 5 points from each day.
Figure 1
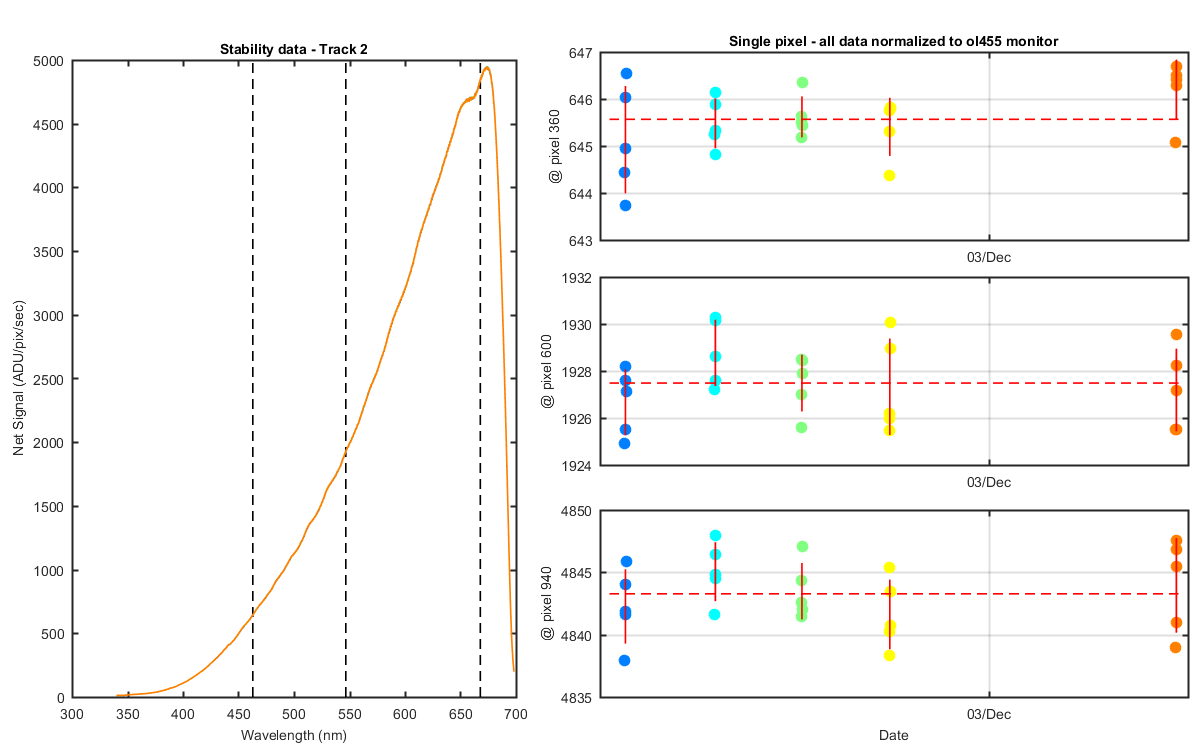
Track 2: showing each of the 5 net light scans for each days data. Nets are lite-dark divided by int time so units are ADU/pix/sec. The data are normalized to the ol455 monitor data by dividing the net signal by the ol455 data/2.391e-08. The black dahsed lines show the pixel locations of the data on the graphs to the right. The right 3 stacked panels shows a single pixel for each dark/day combo. The red line is the standard deviation of the 5 points from each day.
Figure 2
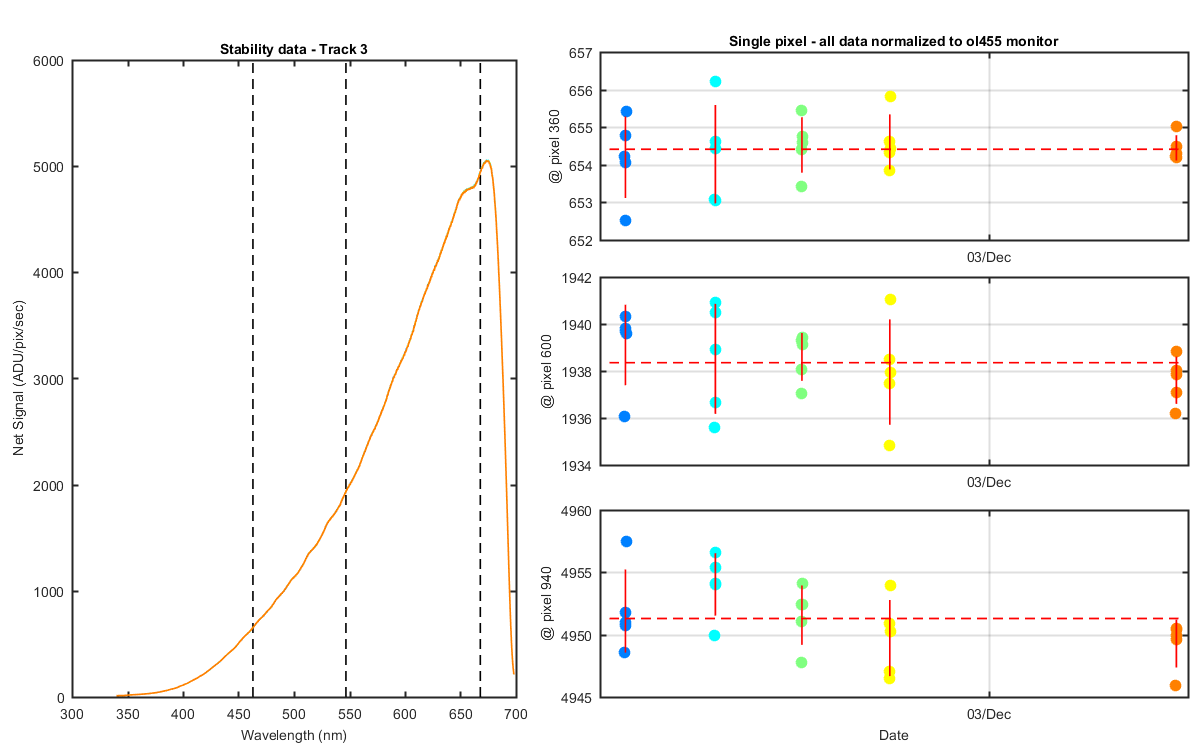
Track 3: showing each of the 5 net light scans for each days data. Nets are lite-dark divided by int time so units are ADU/pix/sec. The data are normalized to the ol455 monitor data by dividing the net signal by the ol455 data/2.391e-08. The black dahsed lines show the pixel locations of the data on the graphs to the right. The right 3 stacked panels shows a single pixel for each dark/day combo. The red line is the standard deviation of the 5 points from each day.
Figure 3
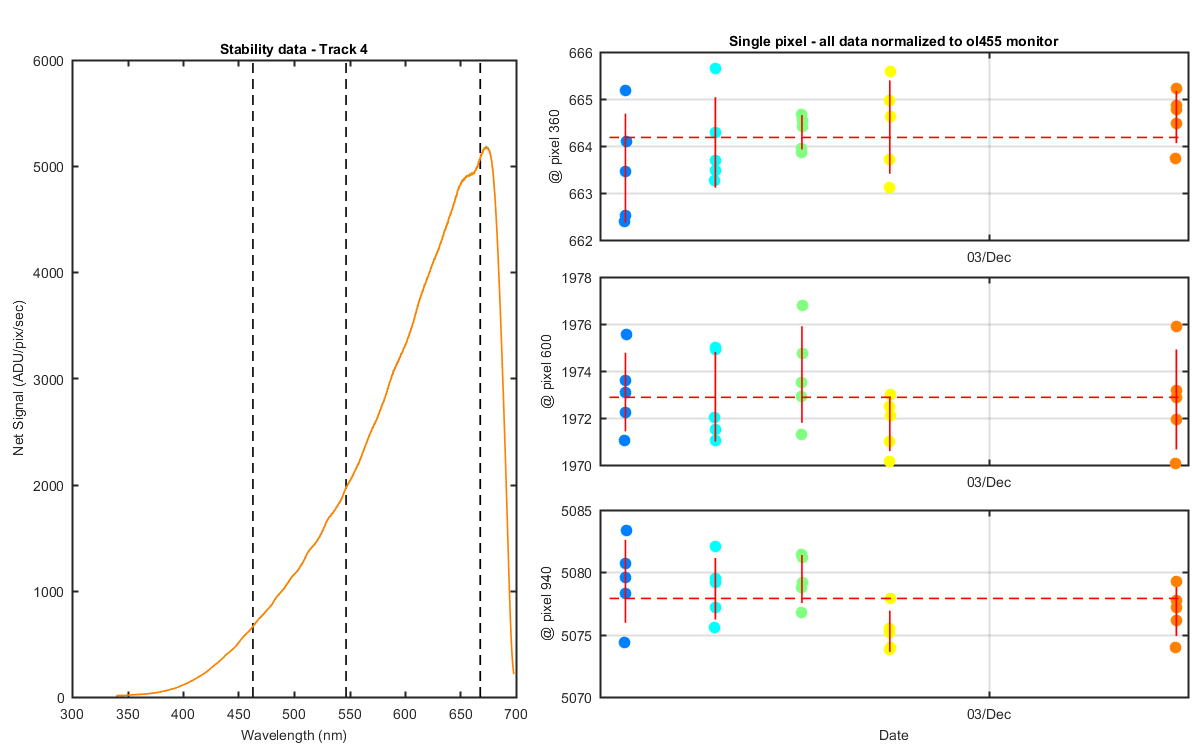
Track 4: showing each of the 5 net light scans for each days data. Nets are lite-dark divided by int time so units are ADU/pix/sec. The data are normalized to the ol455 monitor data by dividing the net signal by the ol455 data/2.391e-08. The black dahsed lines show the pixel locations of the data on the graphs to the right. The right 3 stacked panels shows a single pixel for each dark/day combo. The red line is the standard deviation of the 5 points from each day.
Figure 4
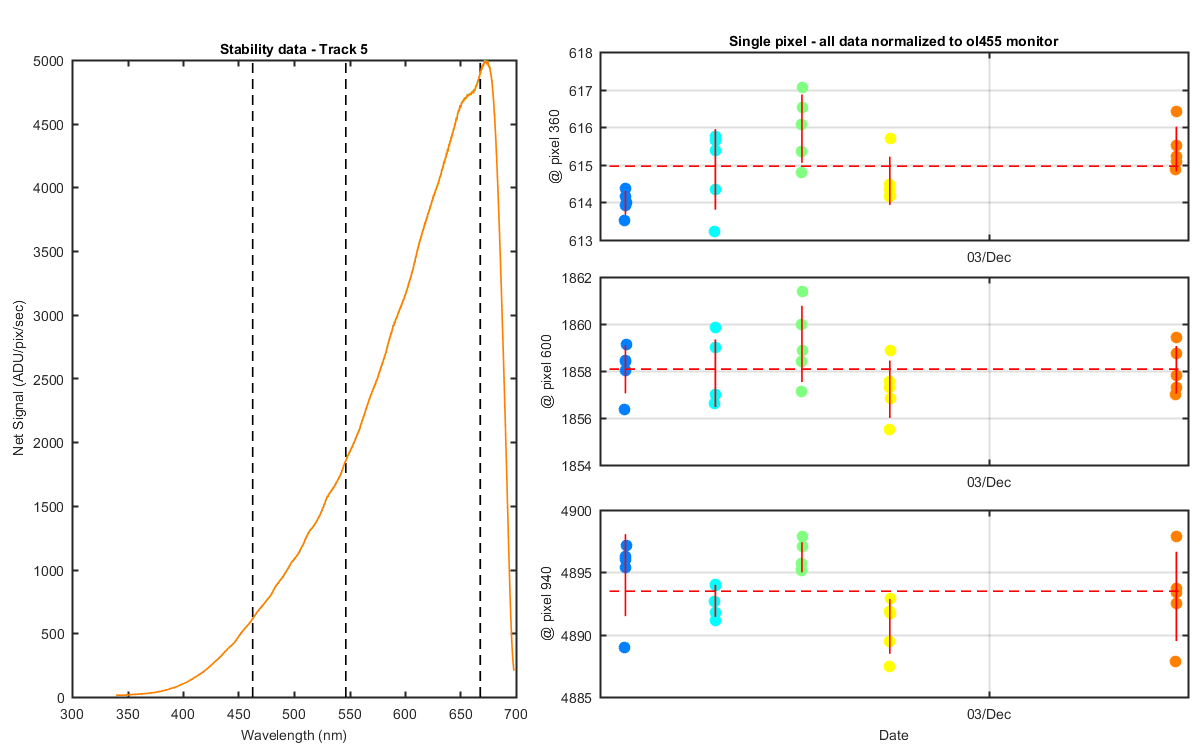
Track 5: showing each of the 5 net light scans for each days data. Nets are lite-dark divided by int time so units are ADU/pix/sec. The data are normalized to the ol455 monitor data by dividing the net signal by the ol455 data/2.391e-08. The black dahsed lines show the pixel locations of the data on the graphs to the right. The right 3 stacked panels shows a single pixel for each dark/day combo. The red line is the standard deviation of the 5 points from each day.
Figure 5
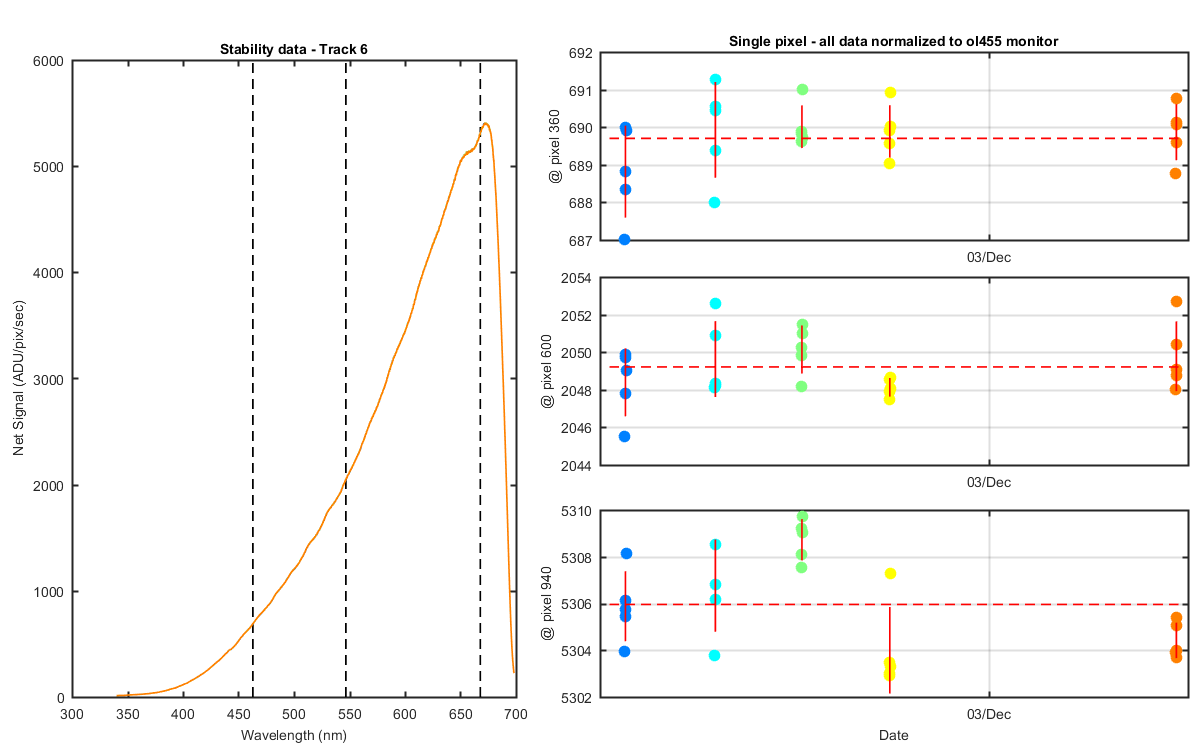
Track 6: showing each of the 5 net light scans for each days data. Nets are lite-dark divided by int time so units are ADU/pix/sec. The data are normalized to the ol455 monitor data by dividing the net signal by the ol455 data/2.391e-08. The black dahsed lines show the pixel locations of the data on the graphs to the right. The right 3 stacked panels shows a single pixel for each dark/day combo. The red line is the standard deviation of the 5 points from each day.
Figure 6
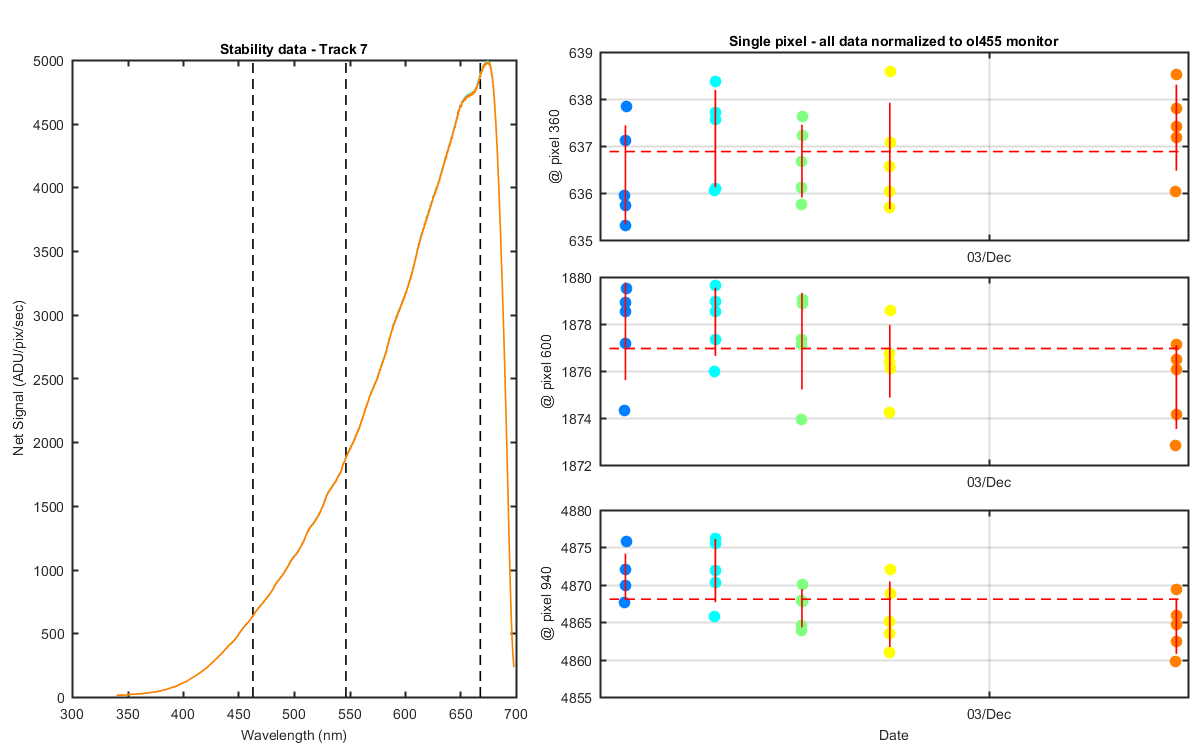
Track 7: showing each of the 5 net light scans for each days data. Nets are lite-dark divided by int time so units are ADU/pix/sec. The data are normalized to the ol455 monitor data by dividing the net signal by the ol455 data/2.391e-08. The black dahsed lines show the pixel locations of the data on the graphs to the right. The right 3 stacked panels shows a single pixel for each dark/day combo. The red line is the standard deviation of the 5 points from each day.
Figure 7
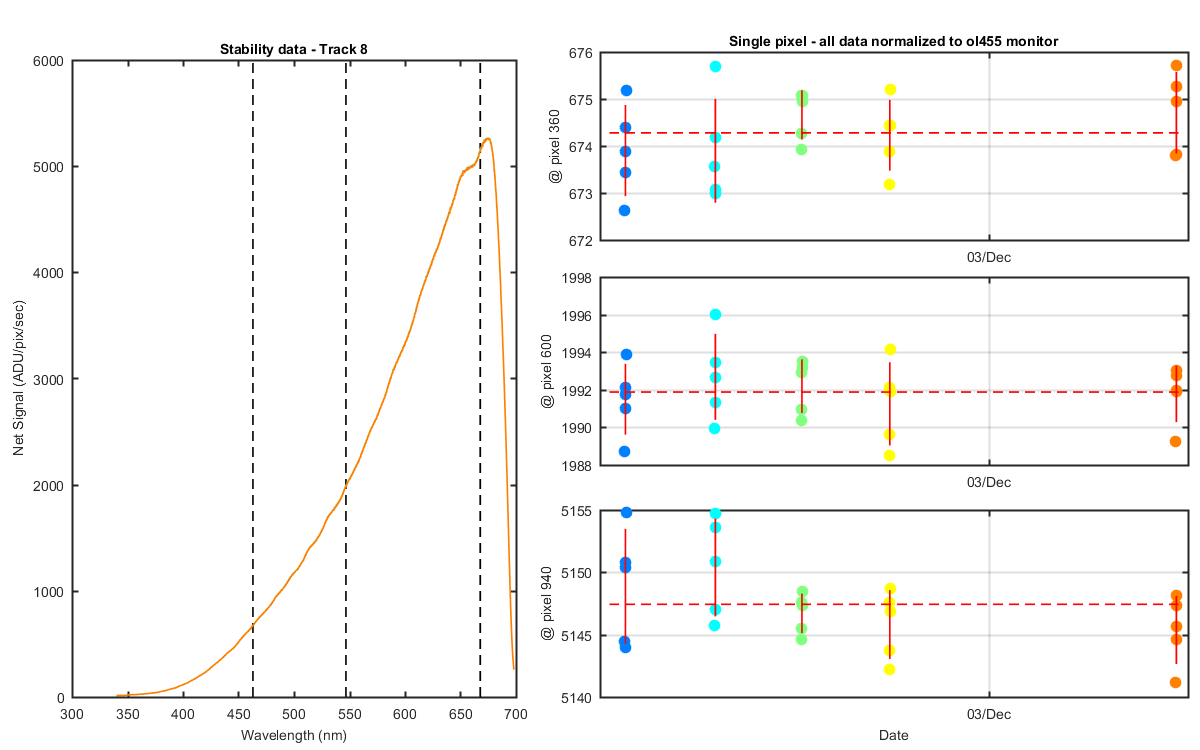
Track 8: showing each of the 5 net light scans for each days data. Nets are lite-dark divided by int time so units are ADU/pix/sec. The data are normalized to the ol455 monitor data by dividing the net signal by the ol455 data/2.391e-08. The black dahsed lines show the pixel locations of the data on the graphs to the right. The right 3 stacked panels shows a single pixel for each dark/day combo. The red line is the standard deviation of the 5 points from each day.
Figure 8
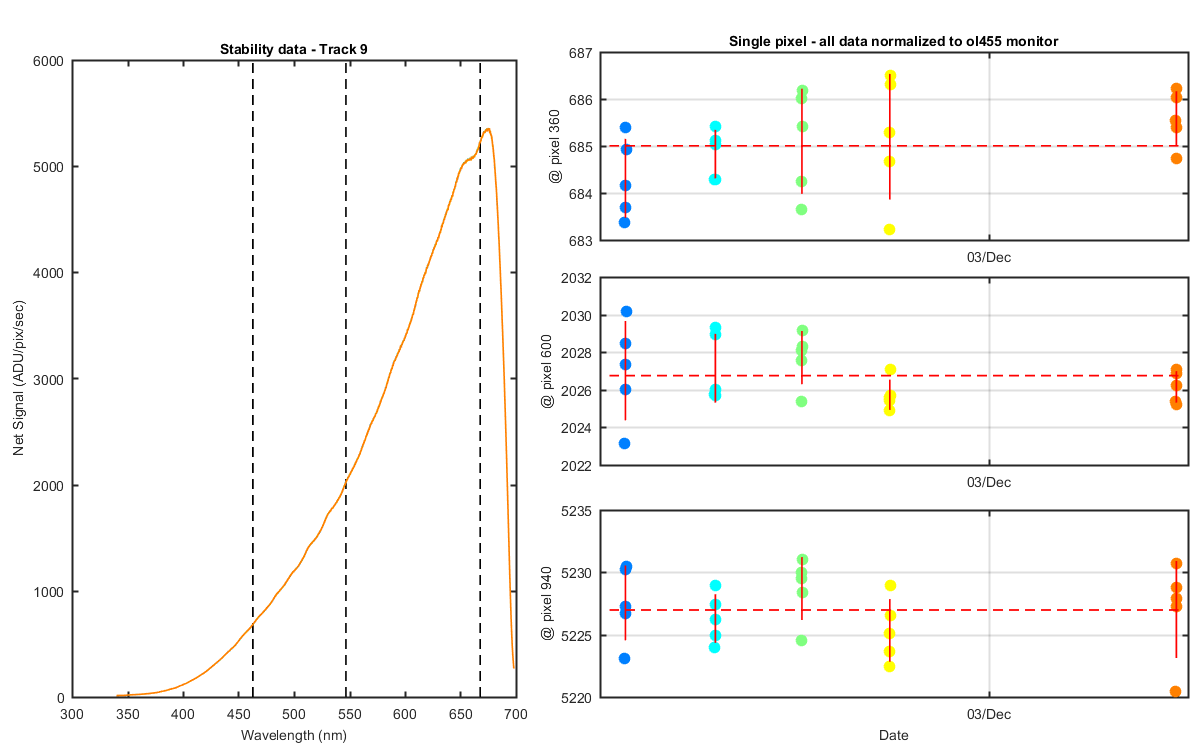
Track 9: showing each of the 5 net light scans for each days data. Nets are lite-dark divided by int time so units are ADU/pix/sec. The data are normalized to the ol455 monitor data by dividing the net signal by the ol455 data/2.391e-08. The black dahsed lines show the pixel locations of the data on the graphs to the right. The right 3 stacked panels shows a single pixel for each dark/day combo. The red line is the standard deviation of the 5 points from each day.
Figure 9
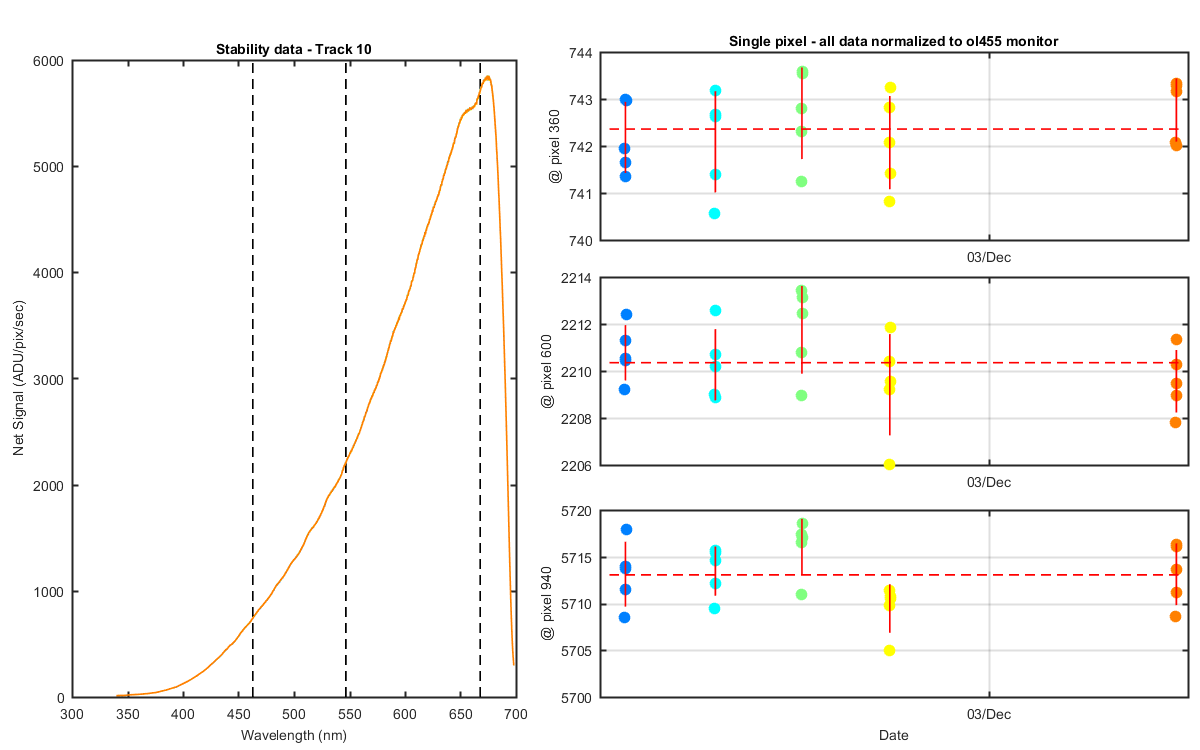
Track 10: showing each of the 5 net light scans for each days data. Nets are lite-dark divided by int time so units are ADU/pix/sec. The data are normalized to the ol455 monitor data by dividing the net signal by the ol455 data/2.391e-08. The black dahsed lines show the pixel locations of the data on the graphs to the right. The right 3 stacked panels shows a single pixel for each dark/day combo. The red line is the standard deviation of the 5 points from each day.
Figure 10
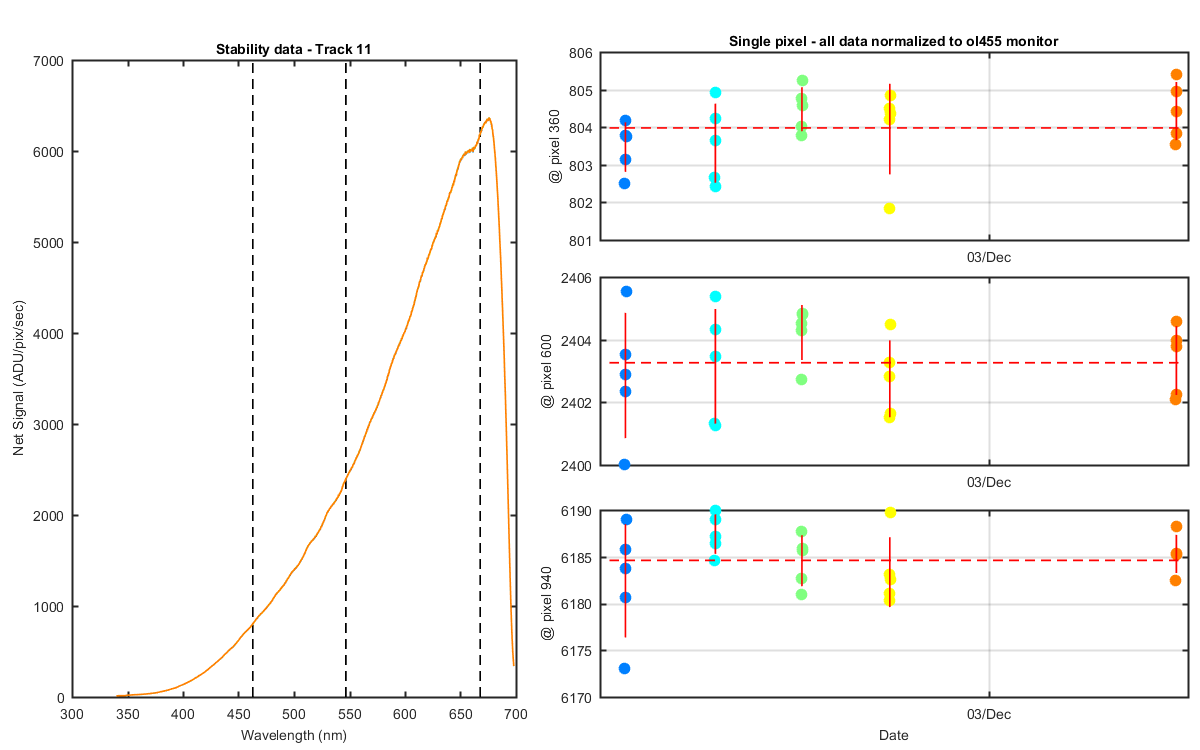
Track 11: showing each of the 5 net light scans for each days data. Nets are lite-dark divided by int time so units are ADU/pix/sec. The data are normalized to the ol455 monitor data by dividing the net signal by the ol455 data/2.391e-08. The black dahsed lines show the pixel locations of the data on the graphs to the right. The right 3 stacked panels shows a single pixel for each dark/day combo. The red line is the standard deviation of the 5 points from each day.
Figure 11
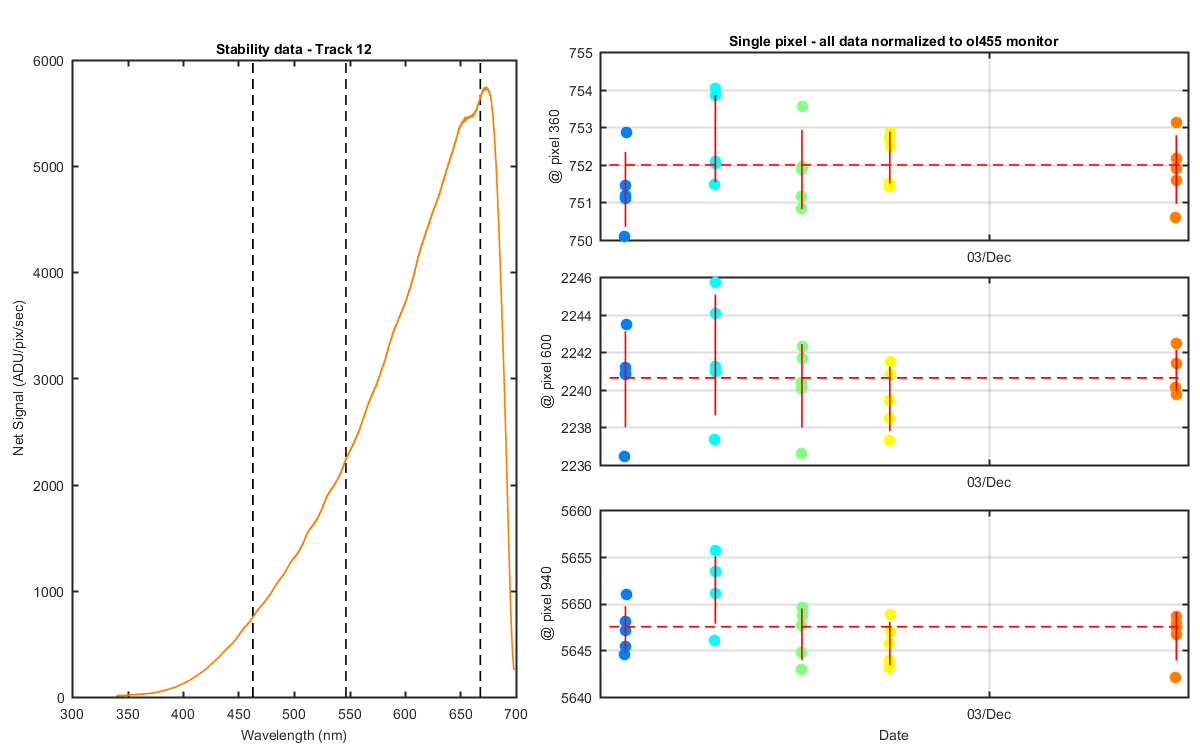
Track 12: showing each of the 5 net light scans for each days data. Nets are lite-dark divided by int time so units are ADU/pix/sec. The data are normalized to the ol455 monitor data by dividing the net signal by the ol455 data/2.391e-08. The black dahsed lines show the pixel locations of the data on the graphs to the right. The right 3 stacked panels shows a single pixel for each dark/day combo. The red line is the standard deviation of the 5 points from each day.
Figure 12
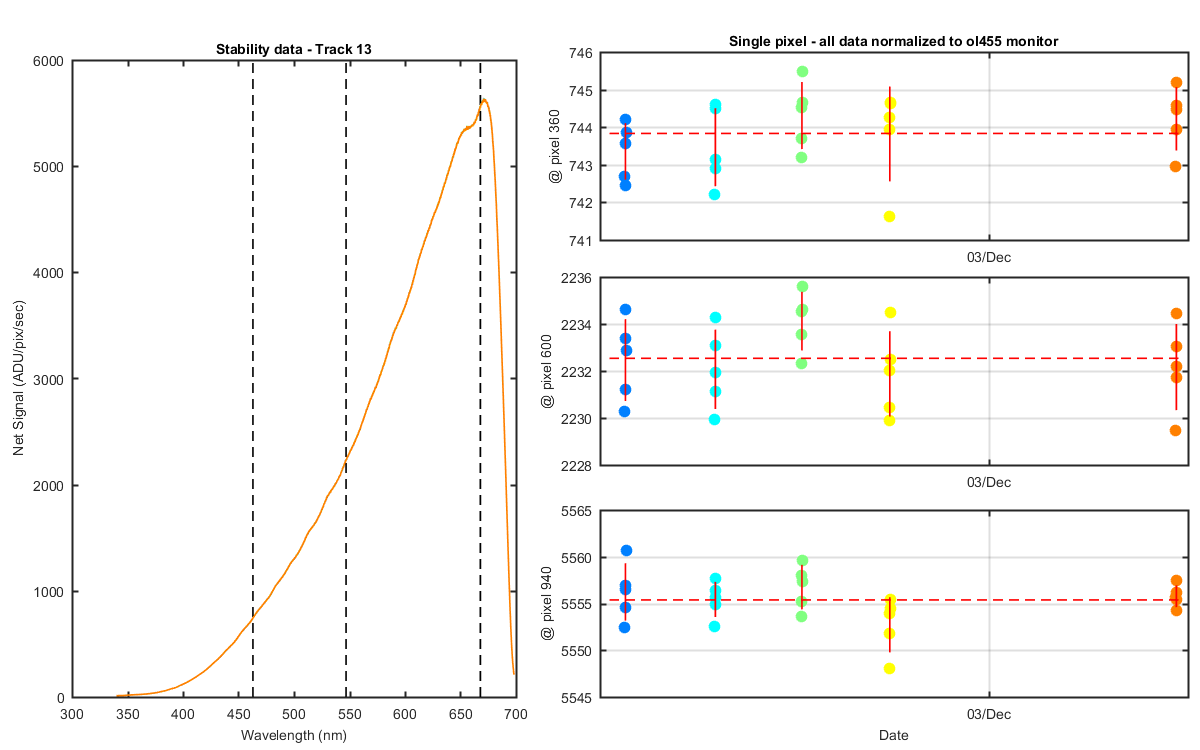
Track 13: showing each of the 5 net light scans for each days data. Nets are lite-dark divided by int time so units are ADU/pix/sec. The data are normalized to the ol455 monitor data by dividing the net signal by the ol455 data/2.391e-08. The black dahsed lines show the pixel locations of the data on the graphs to the right. The right 3 stacked panels shows a single pixel for each dark/day combo. The red line is the standard deviation of the 5 points from each day.
Figure 13
Track 14: showing each of the 5 net light scans for each days data. Nets are lite-dark divided by int time so units are ADU/pix/sec. The data are normalized to the ol455 monitor data by dividing the net signal by the ol455 data/2.391e-08. The black dahsed lines show the pixel locations of the data on the graphs to the right. The right 3 stacked panels shows a single pixel for each dark/day combo. The red line is the standard deviation of the 5 points from each day.
Figure 14
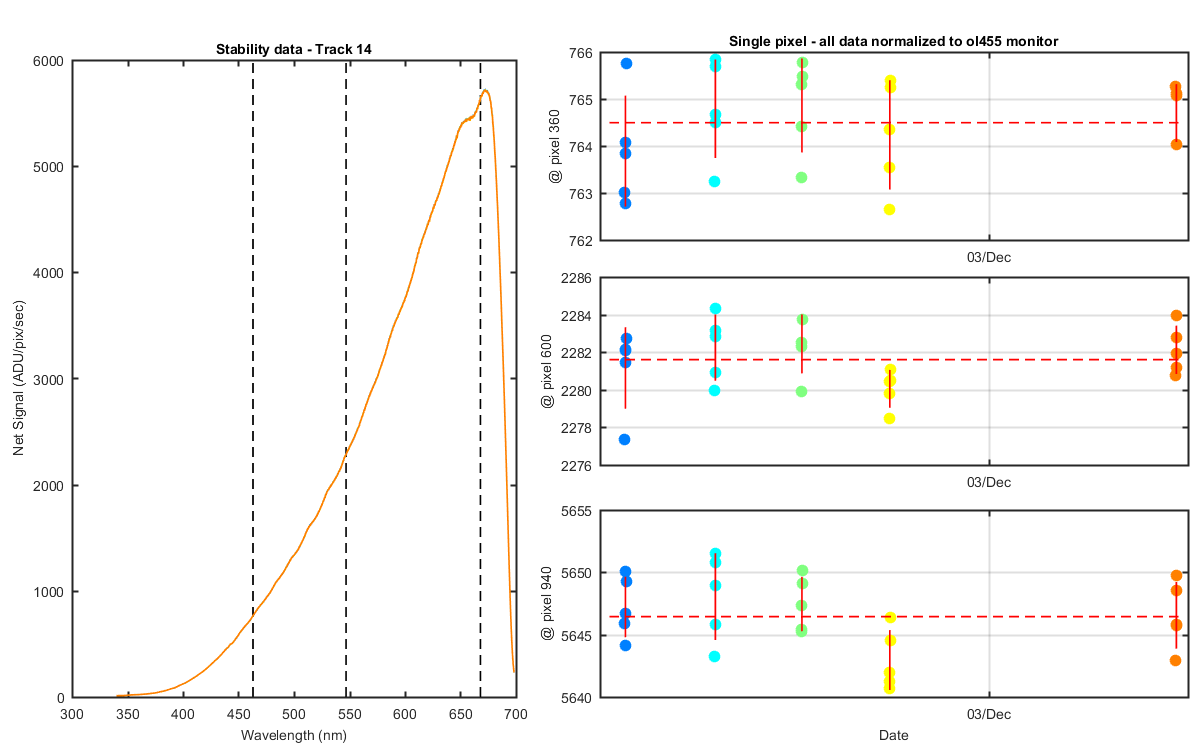
Figure 15