REVISION DATE: 07-Dec-2017 12:55:47
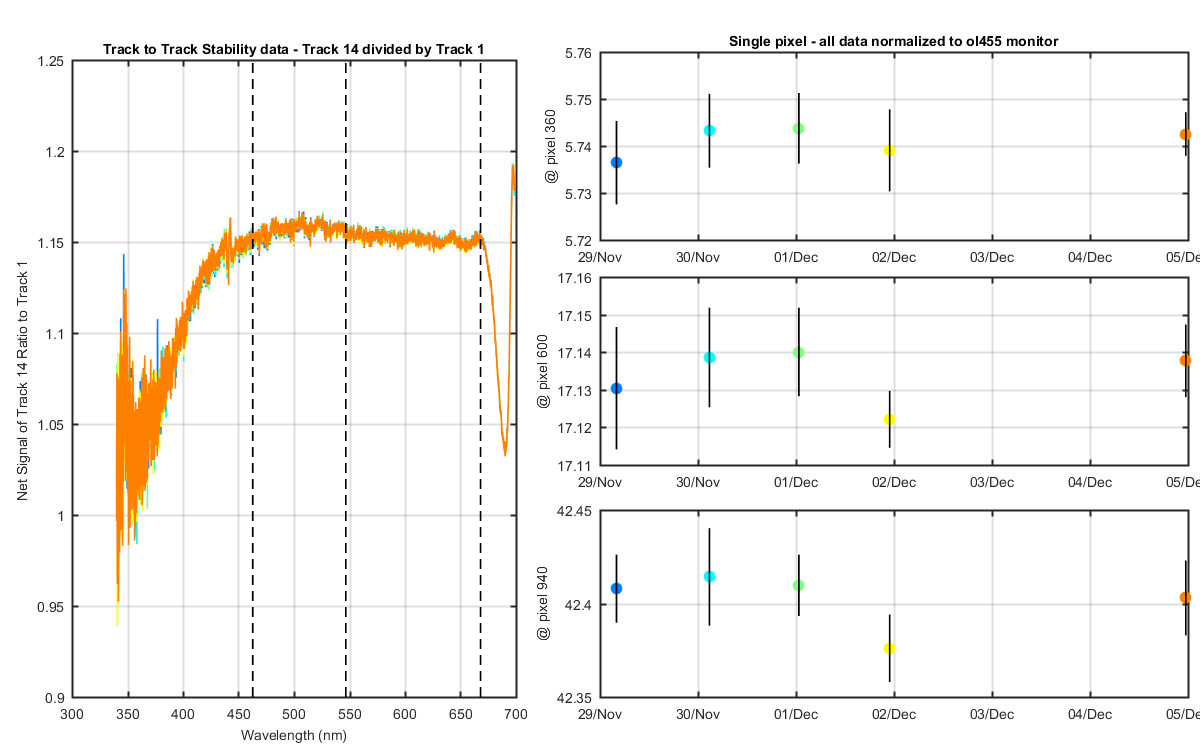
Looking at the track to track stability. How does one track change relative to say track 1. On each day there are 5 net lite signals produced. For each day I take all the track 1-14 data for the first net lite and divide them by track 1. I repeat this for the 2nd Net and so on until all 5 nets and 13 tracks are ratio to track 1. This produces 5 ratios for each track for each day. That is what is plotted below. The std (black veritcal line) on the CPIX graphs are the std of the 5 ratios for that day and track.
Figure 1
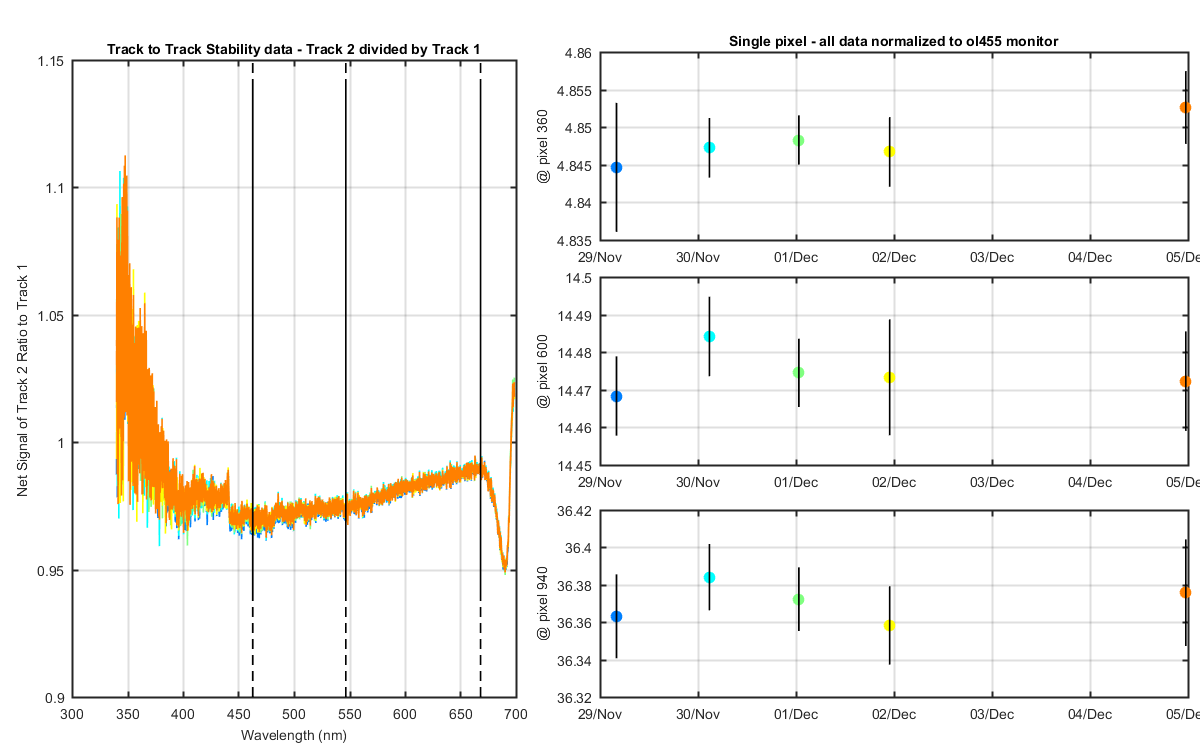
Figure 2
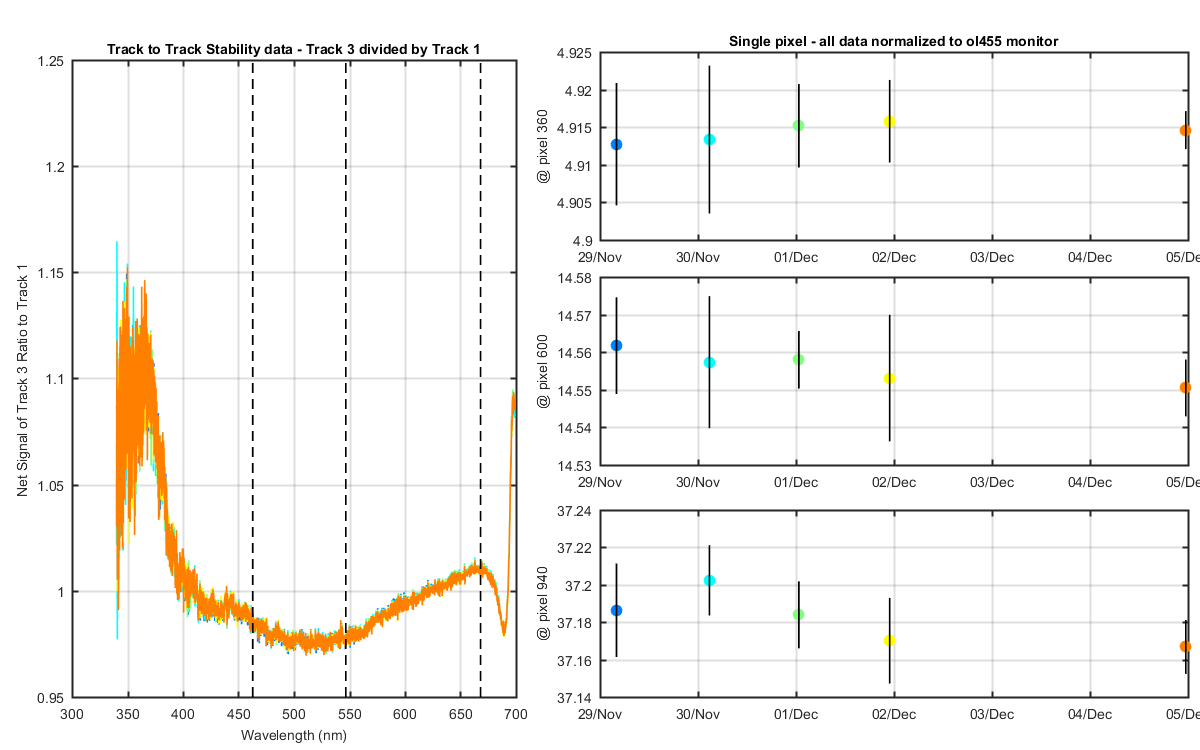
Figure 3
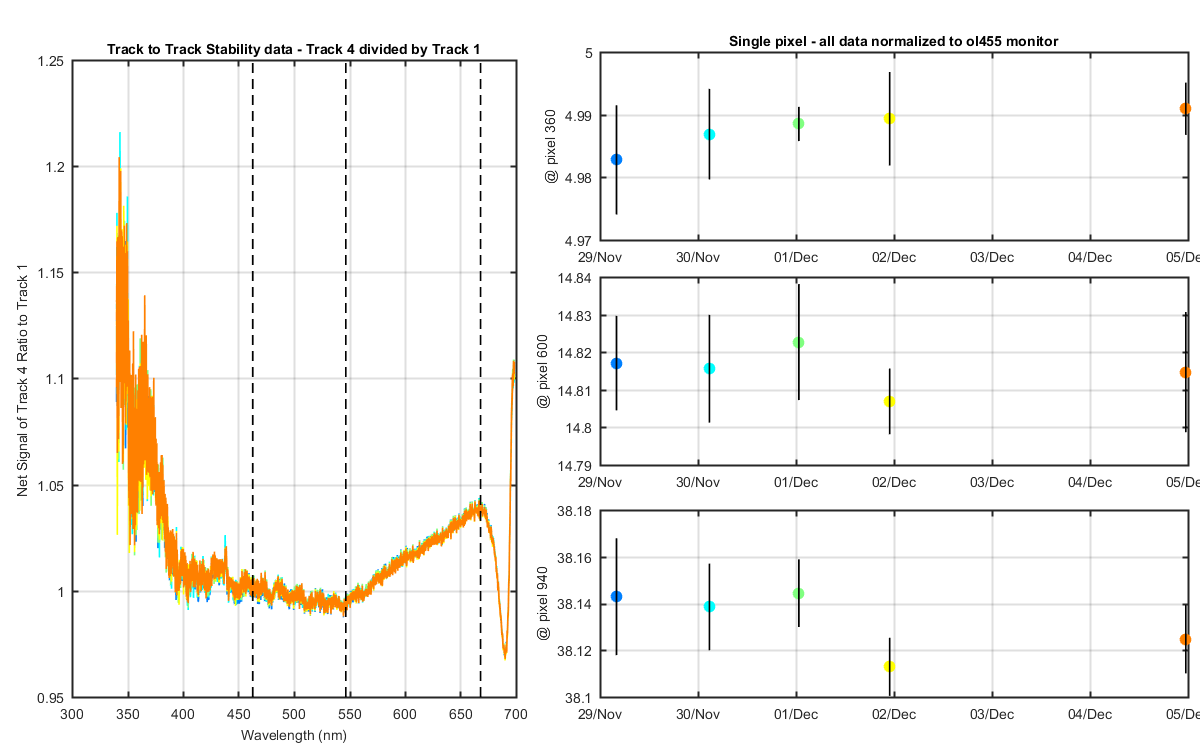
Figure 4
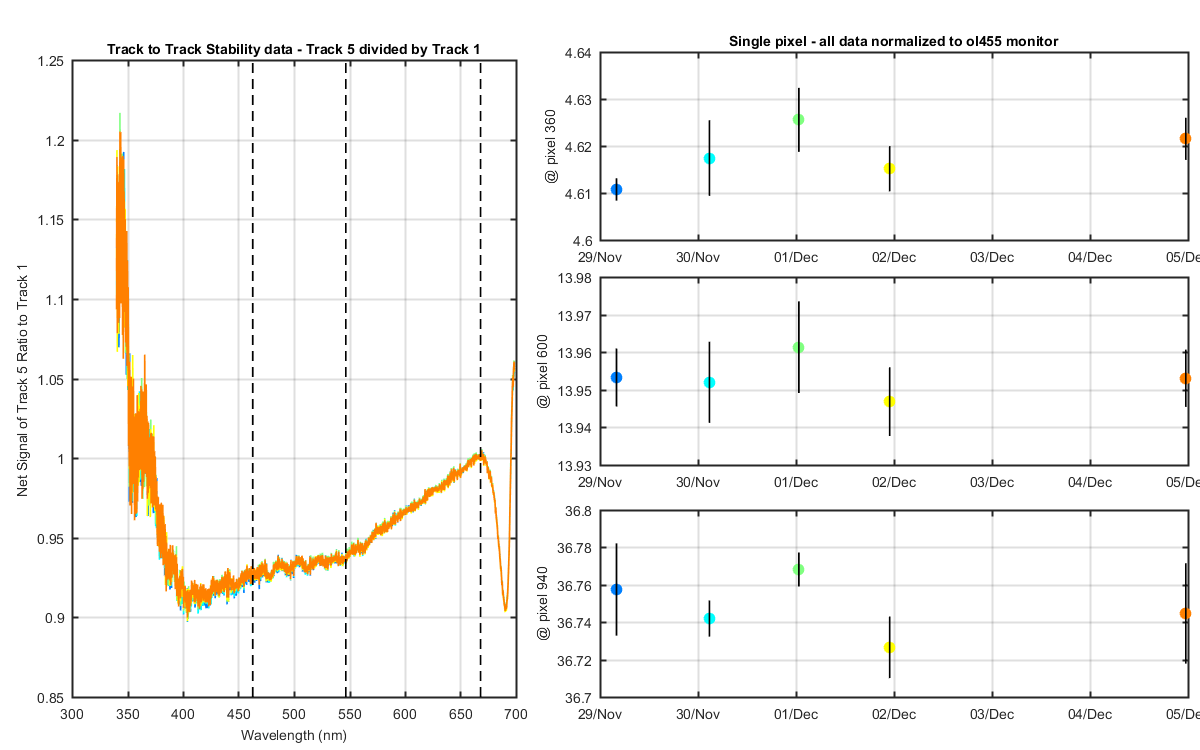
Figure 5
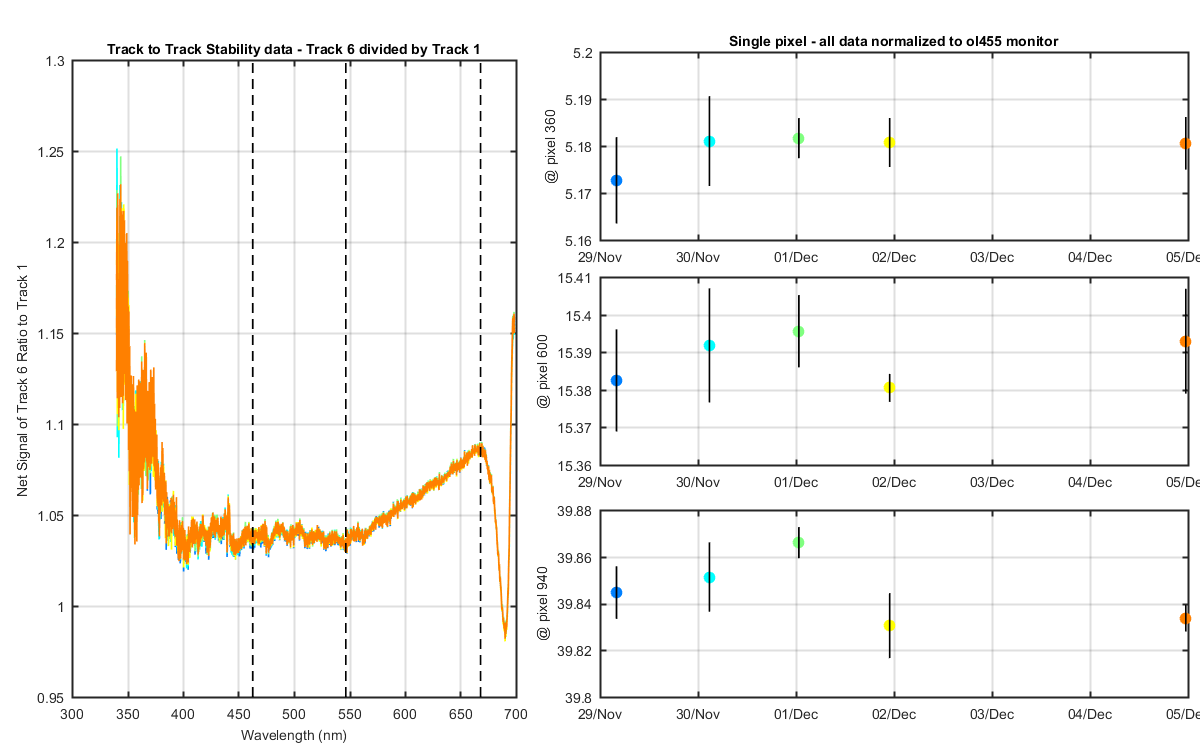
Figure 6
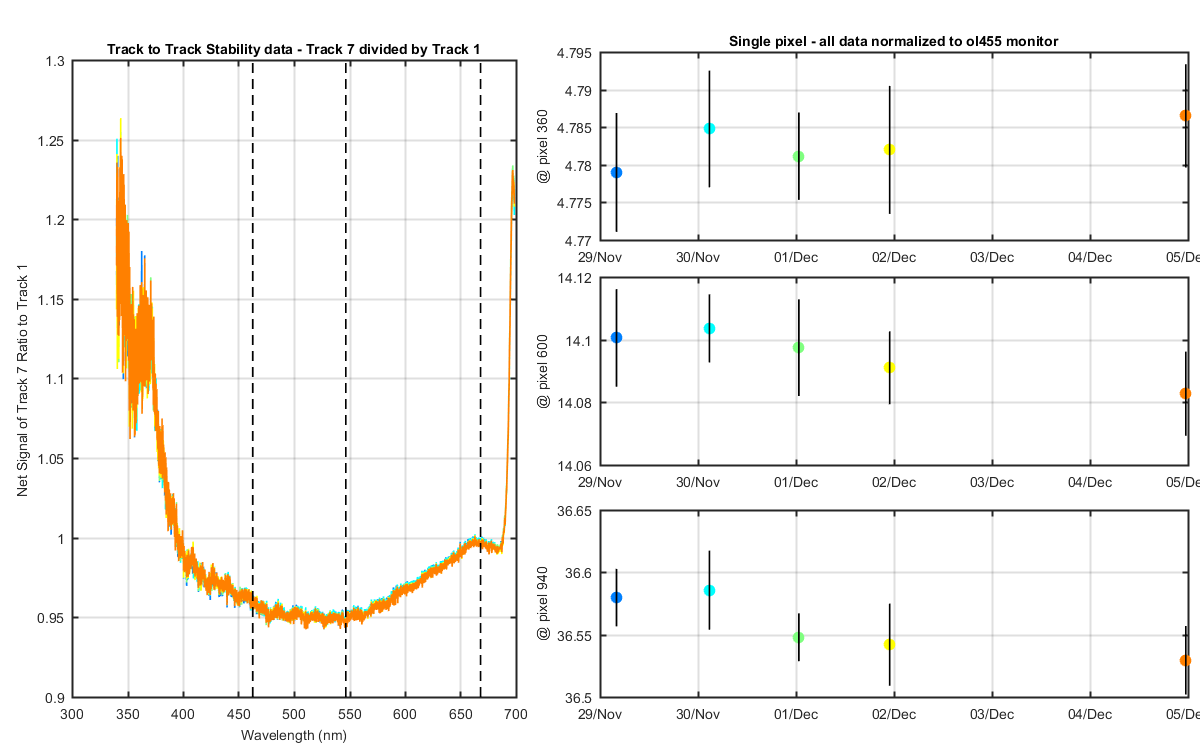
Figure 7
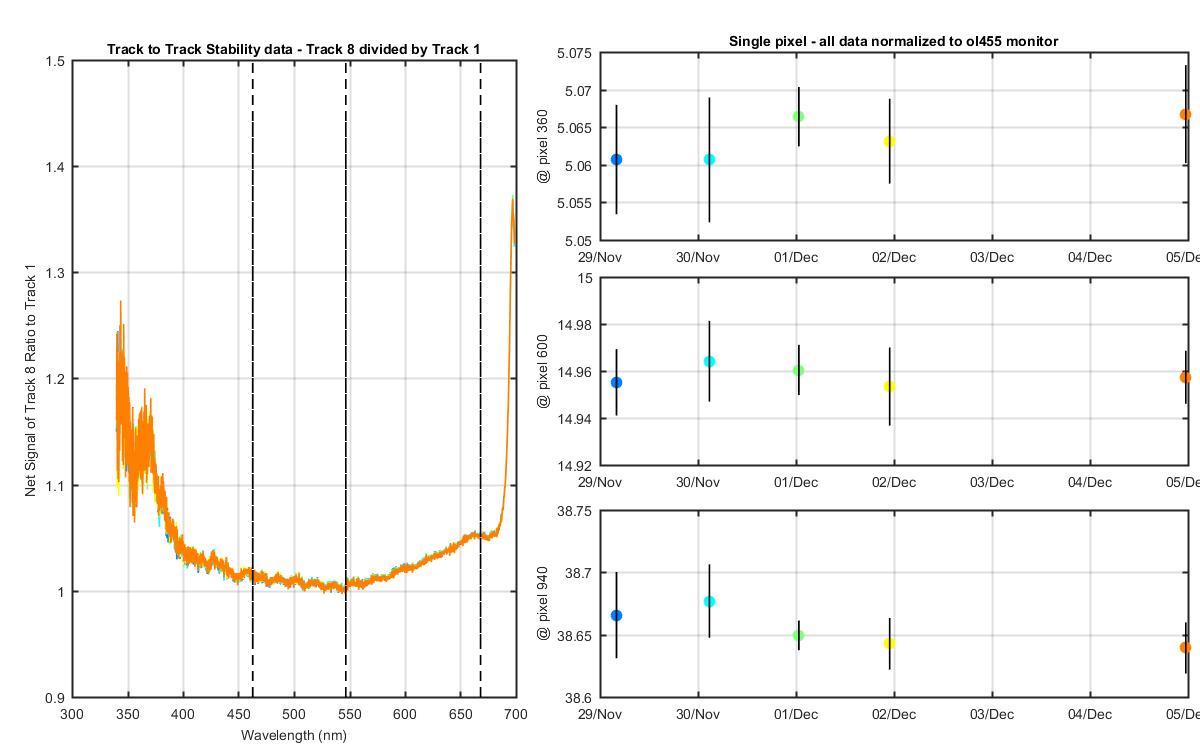
Figure 8
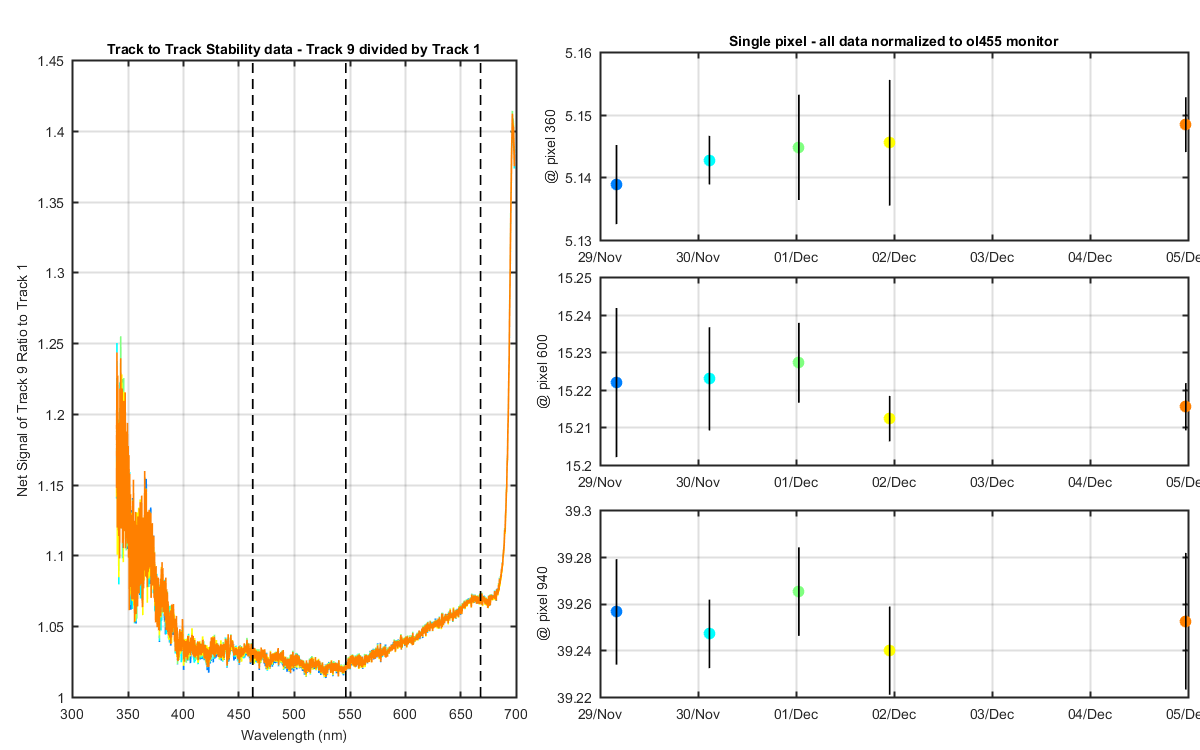
Figure 9
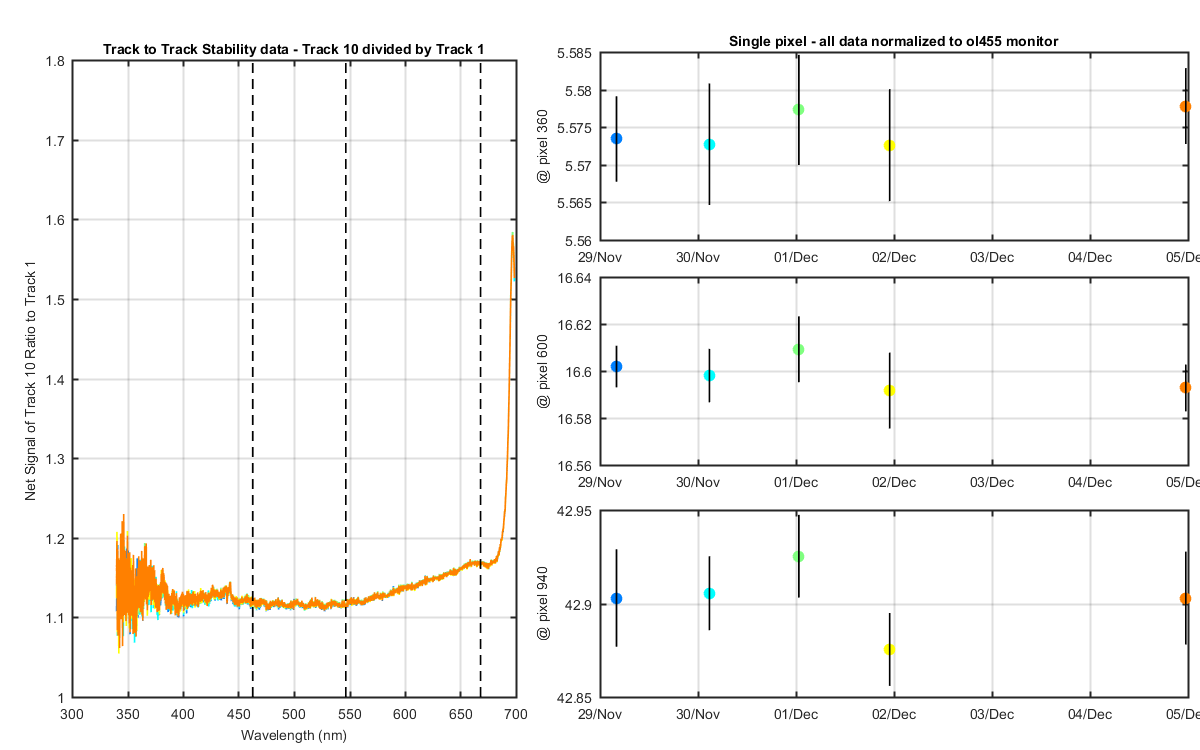
Figure 10
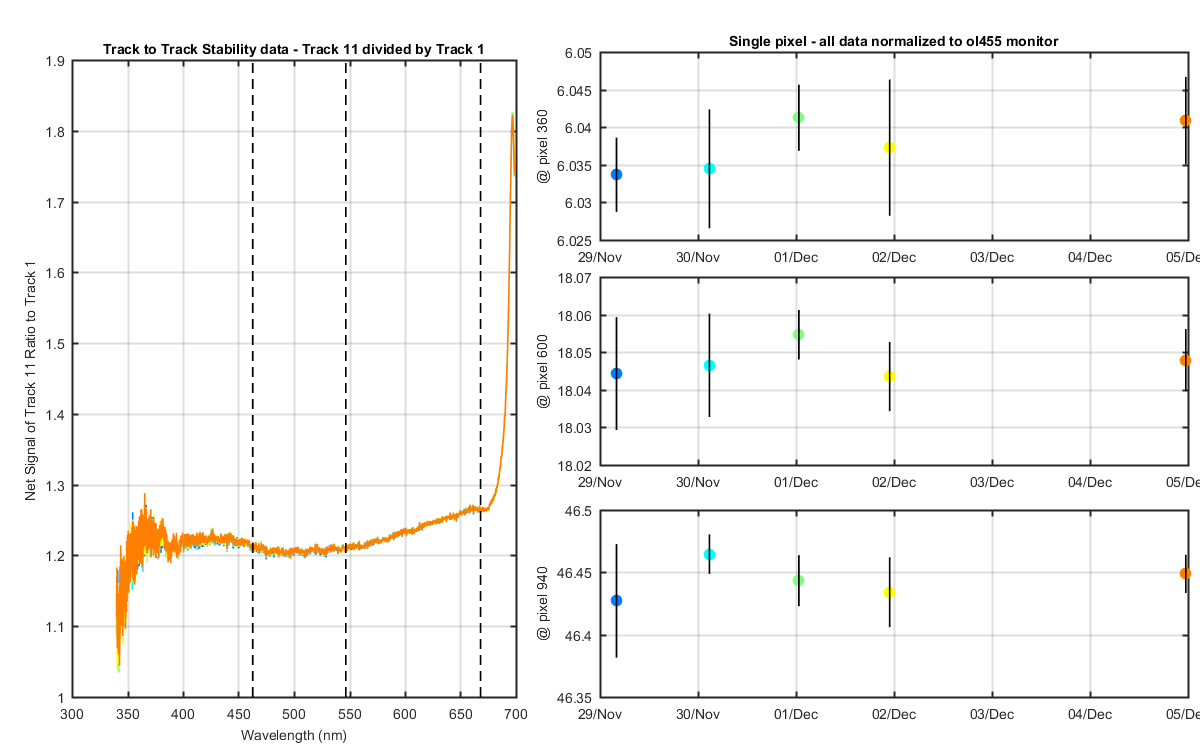
Figure 11
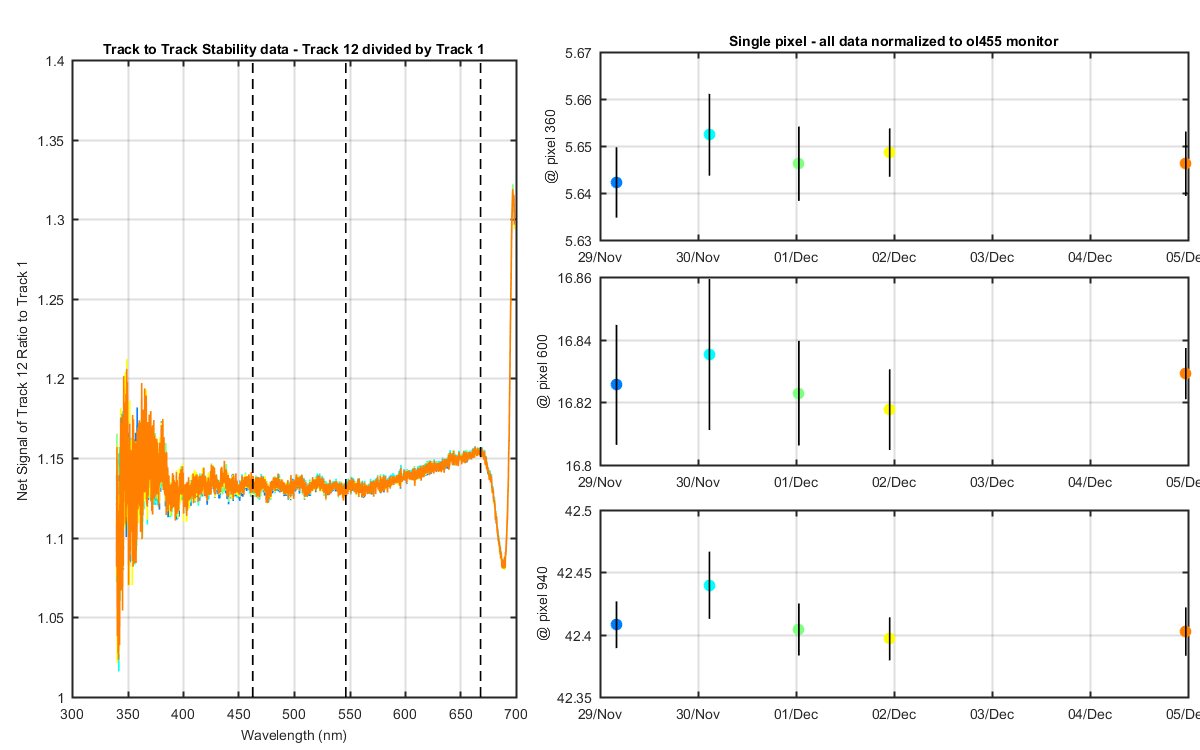
Figure 12
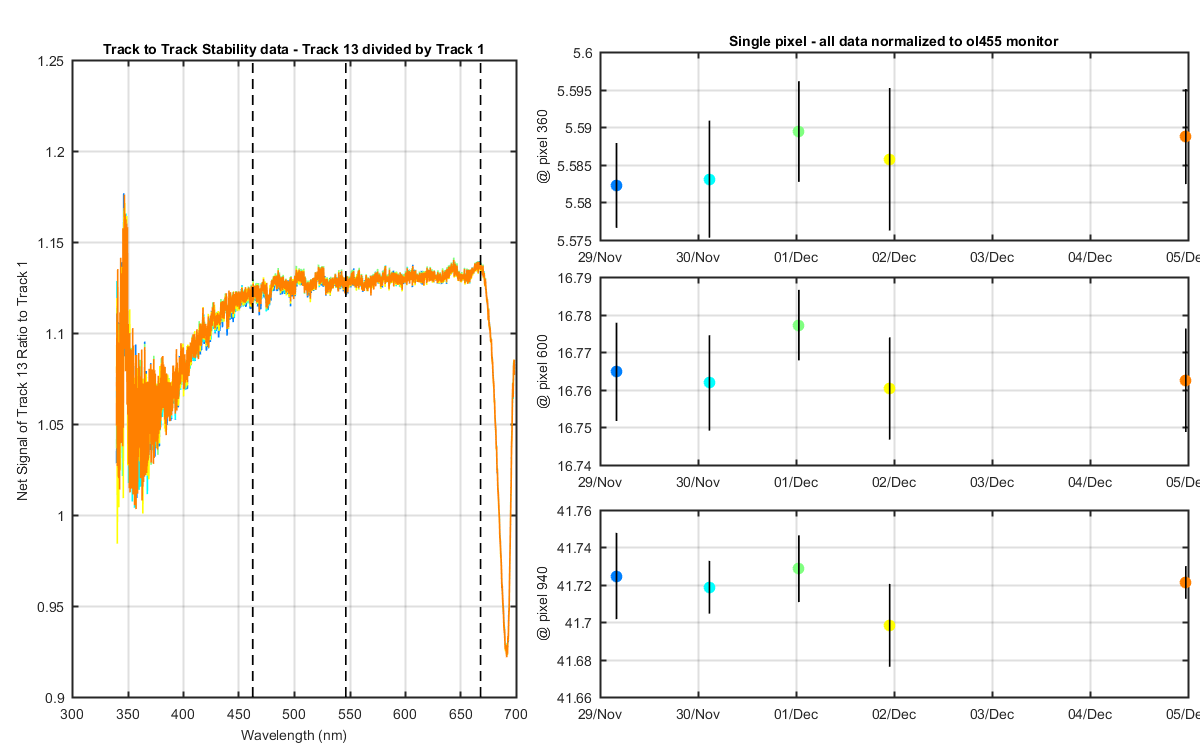
Figure 13