REVISION DATE: 06-Dec-2017 14:06:58
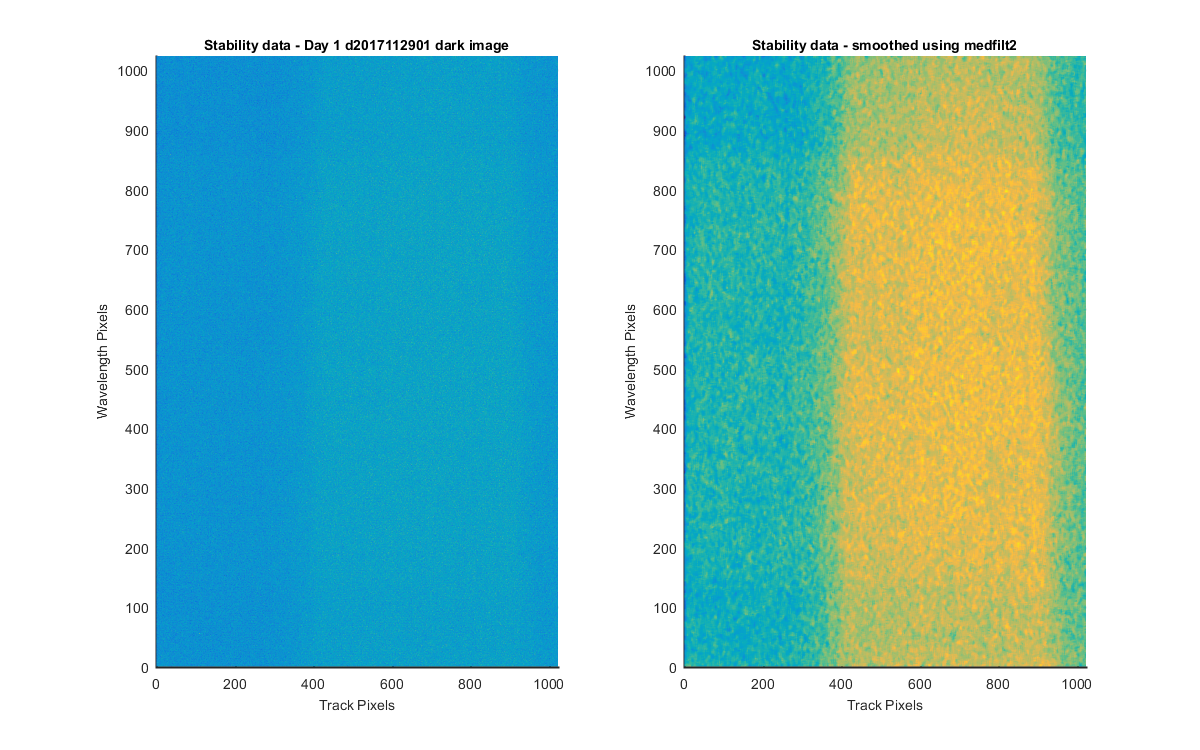
This is looking at the 10 Darks stability of the lamp data Mike is collecting in Hawaii over a number of days.
The table shows the mean of the 10 darks and their percent standard deviation for each day and track. The Darks have units of ADU/pix and so are not divided by integration time. The data are NOT normalized to the ol455 monitor data.
| Track | Day | CPIX 360 Mean / %std |
CPIX 600 Mean / %std |
CPIX 940 Mean / %std |
|---|---|---|---|---|
| 1 | 1 | 3554.61 / 0.0307 | 3554.99 / 0.0505 | 3553.09 / 0.0621 |
| 1 | 2 | 3553.83 / 0.0462 | 3554.10 / 0.0490 | 3553.86 / 0.0445 |
| 1 | 3 | 3547.94 / 0.0577 | 3547.84 / 0.0400 | 3546.82 / 0.0579 |
| 1 | 4 | 3548.38 / 0.0441 | 3548.81 / 0.0281 | 3547.55 / 0.0486 |
| 1 | 5 | 3549.54 / 0.0436 | 3549.65 / 0.0642 | 3548.15 / 0.0308 |
| 2 | 1 | 3555.46 / 0.0355 | 3554.78 / 0.0362 | 3555.51 / 0.0442 |
| 2 | 2 | 3555.47 / 0.0362 | 3555.06 / 0.0414 | 3555.61 / 0.0405 |
| 2 | 3 | 3548.79 / 0.0492 | 3548.49 / 0.0491 | 3547.96 / 0.0552 |
| 2 | 4 | 3549.16 / 0.0481 | 3549.71 / 0.0246 | 3548.70 / 0.0371 |
| 2 | 5 | 3550.61 / 0.0422 | 3550.56 / 0.0470 | 3549.87 / 0.0675 |
| 3 | 1 | 3554.11 / 0.0547 | 3554.94 / 0.0337 | 3554.50 / 0.0485 |
| 3 | 2 | 3554.14 / 0.0401 | 3554.75 / 0.0519 | 3554.71 / 0.0664 |
| 3 | 3 | 3547.65 / 0.0393 | 3548.75 / 0.0457 | 3547.77 / 0.0549 |
| 3 | 4 | 3548.19 / 0.0471 | 3549.40 / 0.0509 | 3548.79 / 0.0473 |
| 3 | 5 | 3549.96 / 0.0479 | 3551.14 / 0.0397 | 3549.07 / 0.0551 |
| 4 | 1 | 3554.47 / 0.0406 | 3555.62 / 0.0398 | 3553.91 / 0.0305 |
| 4 | 2 | 3554.69 / 0.0410 | 3555.59 / 0.0409 | 3554.88 / 0.0626 |
| 4 | 3 | 3548.28 / 0.0514 | 3548.98 / 0.0605 | 3547.14 / 0.0453 |
| 4 | 4 | 3548.56 / 0.0443 | 3548.84 / 0.0291 | 3547.94 / 0.0415 |
| 4 | 5 | 3549.65 / 0.0209 | 3551.02 / 0.0464 | 3549.32 / 0.0685 |
| 5 | 1 | 3557.60 / 0.0454 | 3556.50 / 0.0350 | 3555.11 / 0.0451 |
| 5 | 2 | 3557.49 / 0.0369 | 3557.26 / 0.0308 | 3555.43 / 0.0363 |
| 5 | 3 | 3551.46 / 0.0462 | 3549.60 / 0.0482 | 3549.24 / 0.0508 |
| 5 | 4 | 3551.34 / 0.0270 | 3550.12 / 0.0376 | 3550.24 / 0.0589 |
| 5 | 5 | 3553.46 / 0.0554 | 3552.15 / 0.0432 | 3551.04 / 0.0533 |
| 6 | 1 | 3563.26 / 0.0495 | 3562.69 / 0.0448 | 3560.29 / 0.0585 |
| 6 | 2 | 3562.67 / 0.0552 | 3562.80 / 0.0484 | 3560.30 / 0.0370 |
| 6 | 3 | 3555.87 / 0.0557 | 3555.60 / 0.0428 | 3552.86 / 0.0421 |
| 6 | 4 | 3556.82 / 0.0361 | 3557.07 / 0.0338 | 3554.96 / 0.0389 |
| 6 | 5 | 3558.09 / 0.0574 | 3559.00 / 0.0365 | 3555.40 / 0.0580 |
| 7 | 1 | 3564.95 / 0.0552 | 3563.92 / 0.0395 | 3562.95 / 0.0571 |
| 7 | 2 | 3564.81 / 0.0359 | 3564.98 / 0.0354 | 3563.34 / 0.0461 |
| 7 | 3 | 3558.74 / 0.0413 | 3557.84 / 0.0621 | 3555.83 / 0.0523 |
| 7 | 4 | 3559.60 / 0.0386 | 3559.08 / 0.0377 | 3557.67 / 0.0649 |
| 7 | 5 | 3561.36 / 0.0386 | 3560.33 / 0.0403 | 3559.12 / 0.0804 |
| 8 | 1 | 3565.24 / 0.0551 | 3565.36 / 0.0319 | 3563.53 / 0.0500 |
| 8 | 2 | 3564.88 / 0.0596 | 3564.48 / 0.0273 | 3563.63 / 0.0377 |
| 8 | 3 | 3558.05 / 0.0549 | 3557.53 / 0.0407 | 3556.66 / 0.0455 |
| 8 | 4 | 3559.06 / 0.0236 | 3559.35 / 0.0264 | 3557.85 / 0.0614 |
| 8 | 5 | 3561.22 / 0.0386 | 3561.00 / 0.0554 | 3559.34 / 0.0303 |
| 9 | 1 | 3565.72 / 0.0498 | 3565.89 / 0.0420 | 3565.80 / 0.0497 |
| 9 | 2 | 3564.74 / 0.0374 | 3565.89 / 0.0421 | 3565.91 / 0.0438 |
| 9 | 3 | 3558.62 / 0.0498 | 3558.30 / 0.0586 | 3558.09 / 0.0445 |
| 9 | 4 | 3559.44 / 0.0498 | 3560.13 / 0.0307 | 3559.57 / 0.0655 |
| 9 | 5 | 3560.98 / 0.0319 | 3560.99 / 0.0602 | 3560.90 / 0.0577 |
| 10 | 1 | 3565.51 / 0.0638 | 3565.41 / 0.0423 | 3564.97 / 0.0581 |
| 10 | 2 | 3566.15 / 0.0256 | 3566.00 / 0.0490 | 3564.76 / 0.0316 |
| 10 | 3 | 3559.03 / 0.0578 | 3558.93 / 0.0541 | 3557.58 / 0.0503 |
| 10 | 4 | 3560.21 / 0.0519 | 3559.94 / 0.0436 | 3559.10 / 0.0548 |
| 10 | 5 | 3560.87 / 0.0333 | 3560.46 / 0.0566 | 3560.72 / 0.0526 |
| 11 | 1 | 3564.22 / 0.0548 | 3565.76 / 0.0415 | 3564.54 / 0.0431 |
| 11 | 2 | 3564.88 / 0.0456 | 3567.36 / 0.0392 | 3565.78 / 0.0609 |
| 11 | 3 | 3557.98 / 0.0371 | 3559.37 / 0.0401 | 3558.16 / 0.0597 |
| 11 | 4 | 3559.53 / 0.0451 | 3561.49 / 0.0324 | 3559.32 / 0.0427 |
| 11 | 5 | 3560.26 / 0.0592 | 3562.22 / 0.0571 | 3560.69 / 0.0554 |
| 12 | 1 | 3565.33 / 0.0417 | 3565.24 / 0.0453 | 3563.99 / 0.0478 |
| 12 | 2 | 3565.16 / 0.0412 | 3565.12 / 0.0299 | 3564.44 / 0.0511 |
| 12 | 3 | 3558.64 / 0.0515 | 3558.82 / 0.0506 | 3558.17 / 0.0511 |
| 12 | 4 | 3559.95 / 0.0278 | 3560.38 / 0.0340 | 3559.13 / 0.0428 |
| 12 | 5 | 3560.93 / 0.0475 | 3561.09 / 0.0360 | 3560.39 / 0.0433 |
| 13 | 1 | 3565.36 / 0.0311 | 3563.35 / 0.0387 | 3561.49 / 0.0228 |
| 13 | 2 | 3565.35 / 0.0468 | 3562.95 / 0.0490 | 3561.80 / 0.0366 |
| 13 | 3 | 3558.16 / 0.0520 | 3556.63 / 0.0544 | 3554.35 / 0.0667 |
| 13 | 4 | 3559.56 / 0.0405 | 3558.00 / 0.0362 | 3555.86 / 0.0430 |
| 13 | 5 | 3561.40 / 0.0698 | 3559.06 / 0.0598 | 3557.47 / 0.0603 |
| 14 | 1 | 3559.94 / 0.0404 | 3558.64 / 0.0285 | 3557.57 / 0.0459 |
| 14 | 2 | 3559.74 / 0.0430 | 3559.05 / 0.0294 | 3557.15 / 0.0317 |
| 14 | 3 | 3553.38 / 0.0400 | 3552.18 / 0.0542 | 3550.68 / 0.0621 |
| 14 | 4 | 3553.69 / 0.0321 | 3552.42 / 0.0461 | 3551.76 / 0.0507 |
| 14 | 5 | 3555.04 / 0.0533 | 3554.35 / 0.0529 | 3552.69 / 0.0537 |
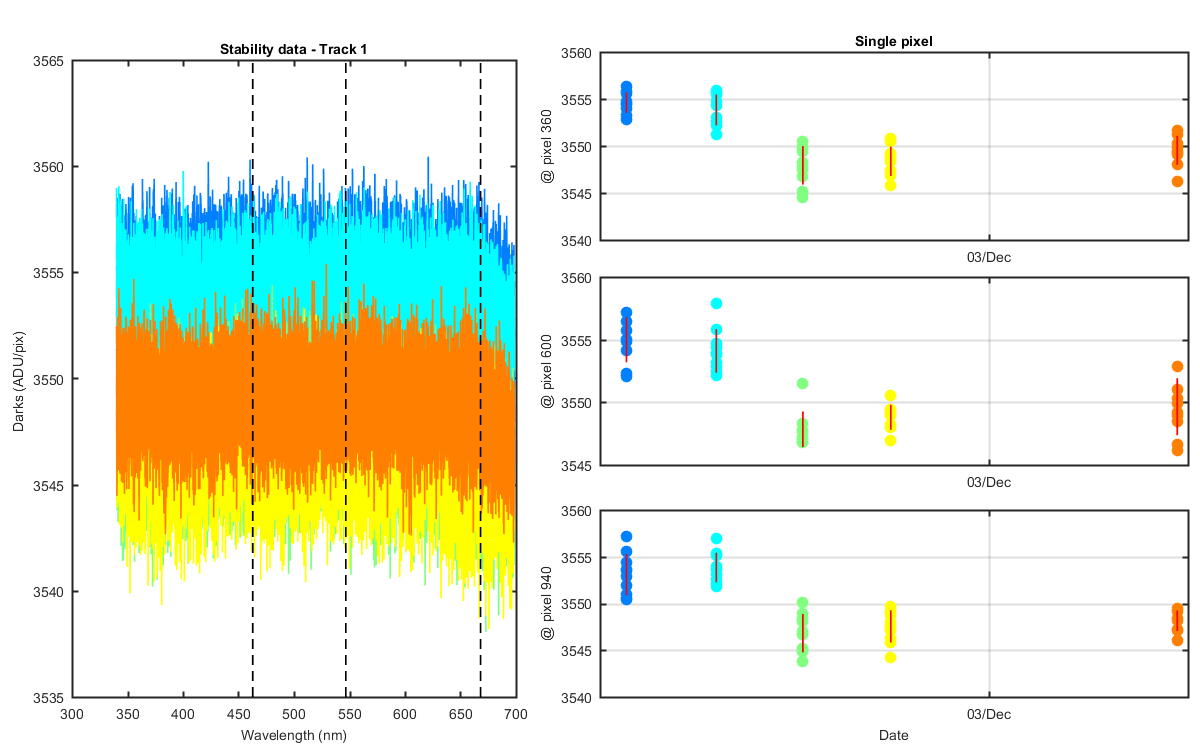
Track 1: showing each of the 10 dark scans for each days data. The Darks have units of ADU/pix and so are not divided by integration time. The data are NOT normalized to the ol455 monitor data. The black dashed lines show the pixel locations of the data on the graphs to the right. The right 3 stacked panels shows a single pixel for each dark/day combo. The red line is the standard deviation of the 8 points from each day.
Figure 1
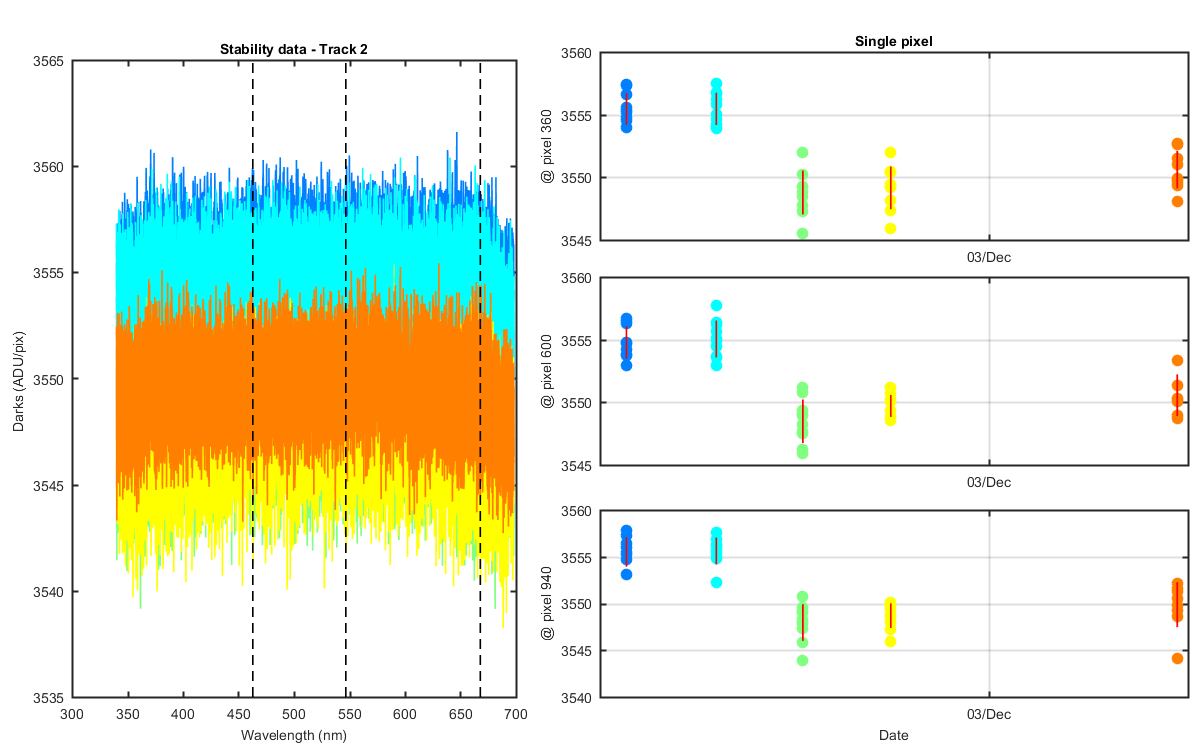
Track 2: showing each of the 10 dark scans for each days data. The Darks have units of ADU/pix and so are not divided by integration time. The data are NOT normalized to the ol455 monitor data. The black dashed lines show the pixel locations of the data on the graphs to the right. The right 3 stacked panels shows a single pixel for each dark/day combo. The red line is the standard deviation of the 8 points from each day.
Figure 2
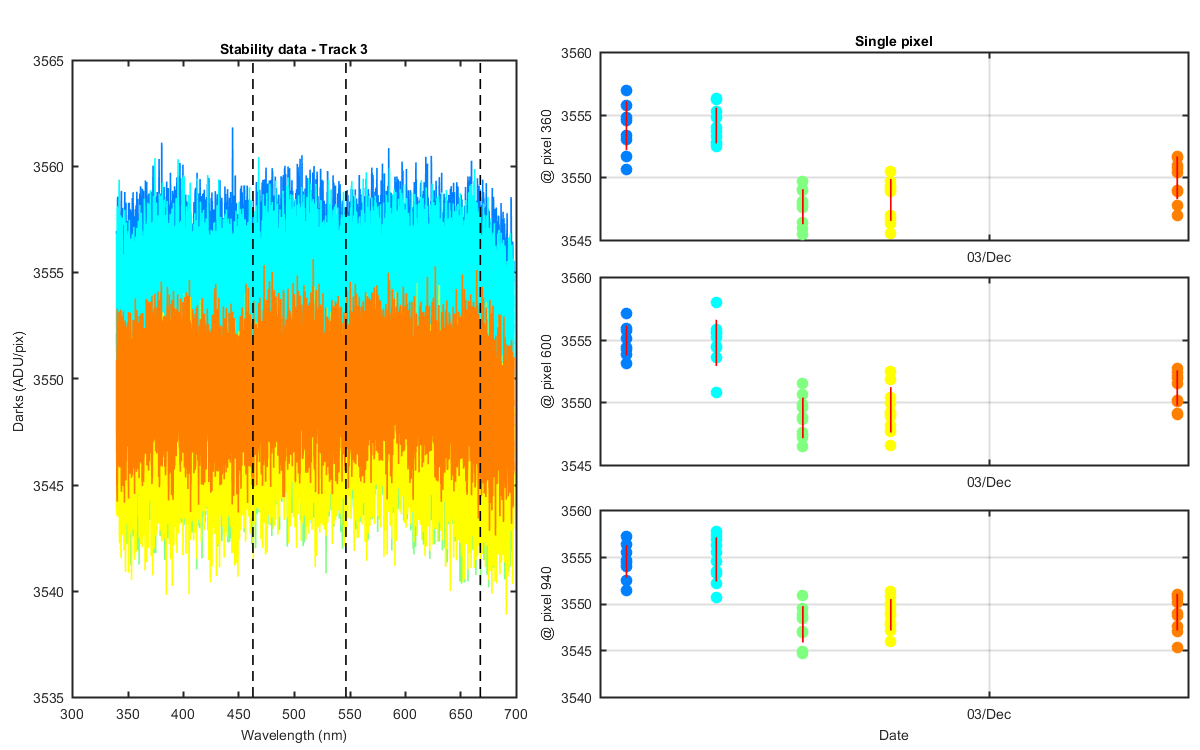
Track 3: showing each of the 10 dark scans for each days data. The Darks have units of ADU/pix and so are not divided by integration time. The data are NOT normalized to the ol455 monitor data. The black dashed lines show the pixel locations of the data on the graphs to the right. The right 3 stacked panels shows a single pixel for each dark/day combo. The red line is the standard deviation of the 8 points from each day.
Figure 3
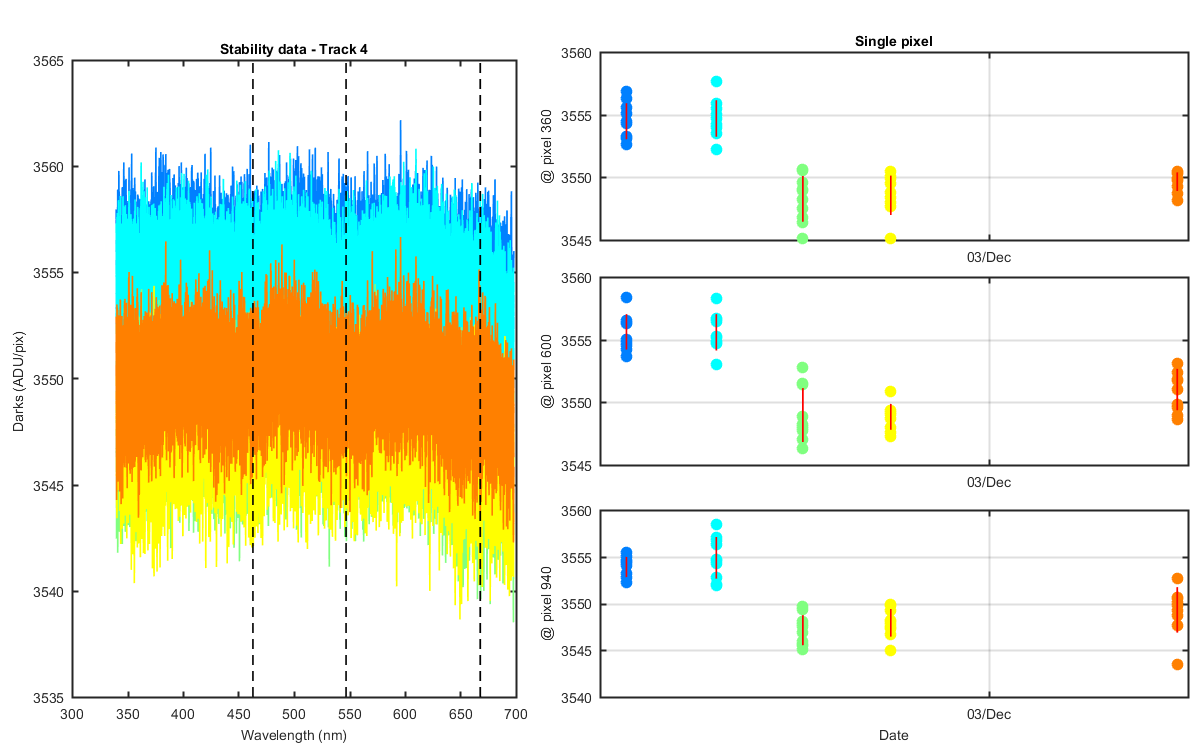
Track 4: showing each of the 10 dark scans for each days data. The Darks have units of ADU/pix and so are not divided by integration time. The data are NOT normalized to the ol455 monitor data. The black dashed lines show the pixel locations of the data on the graphs to the right. The right 3 stacked panels shows a single pixel for each dark/day combo. The red line is the standard deviation of the 8 points from each day.
Figure 4
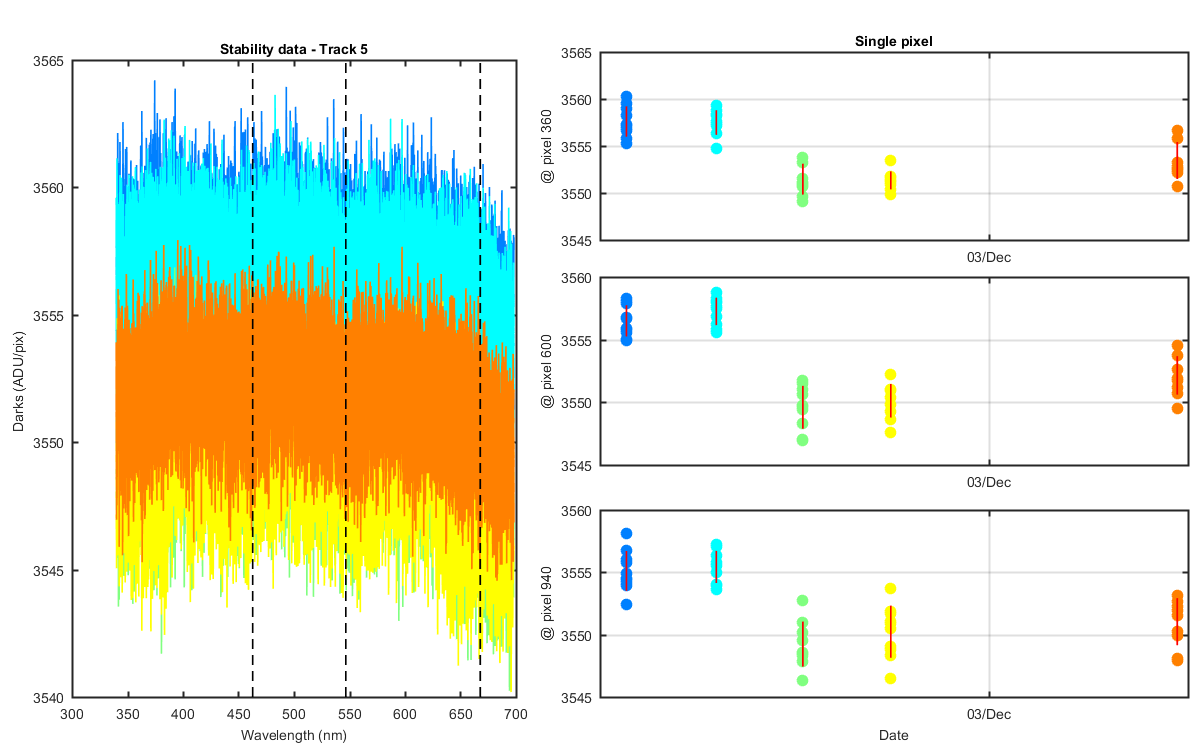
Track 5: showing each of the 10 dark scans for each days data. The Darks have units of ADU/pix and so are not divided by integration time. The data are NOT normalized to the ol455 monitor data. The black dashed lines show the pixel locations of the data on the graphs to the right. The right 3 stacked panels shows a single pixel for each dark/day combo. The red line is the standard deviation of the 8 points from each day.
Figure 5
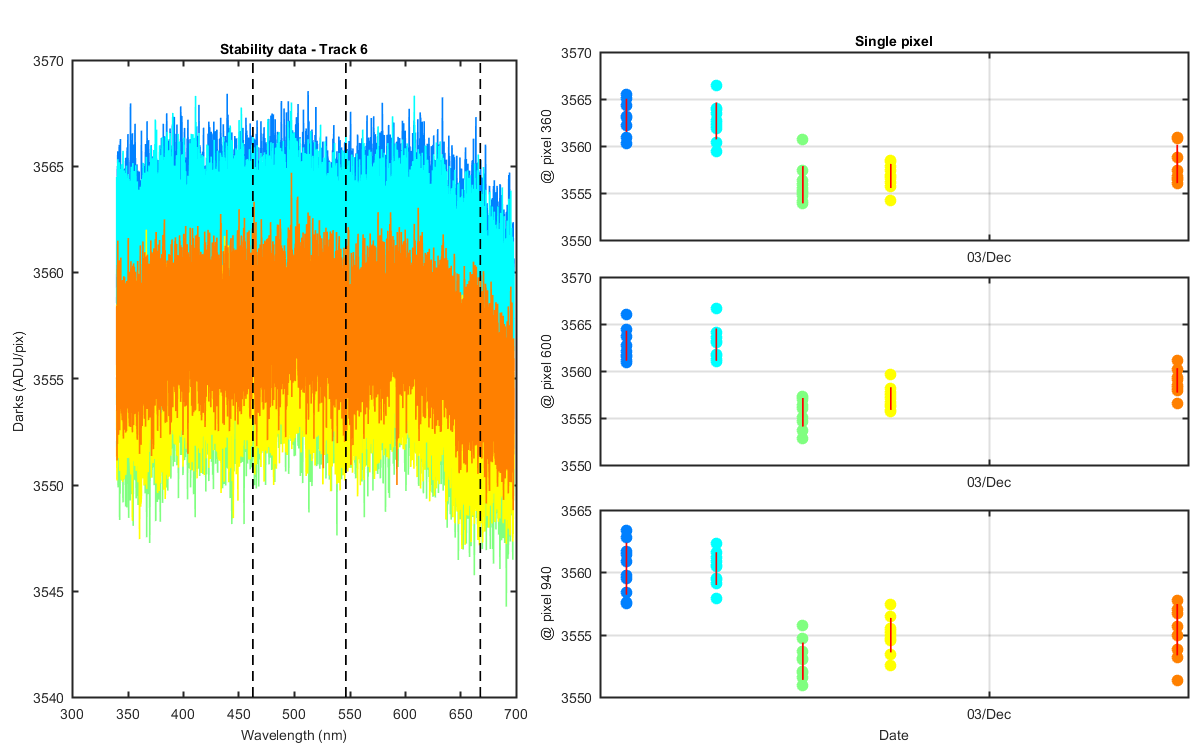
Track 6: showing each of the 10 dark scans for each days data. The Darks have units of ADU/pix and so are not divided by integration time. The data are NOT normalized to the ol455 monitor data. The black dashed lines show the pixel locations of the data on the graphs to the right. The right 3 stacked panels shows a single pixel for each dark/day combo. The red line is the standard deviation of the 8 points from each day.
Figure 6
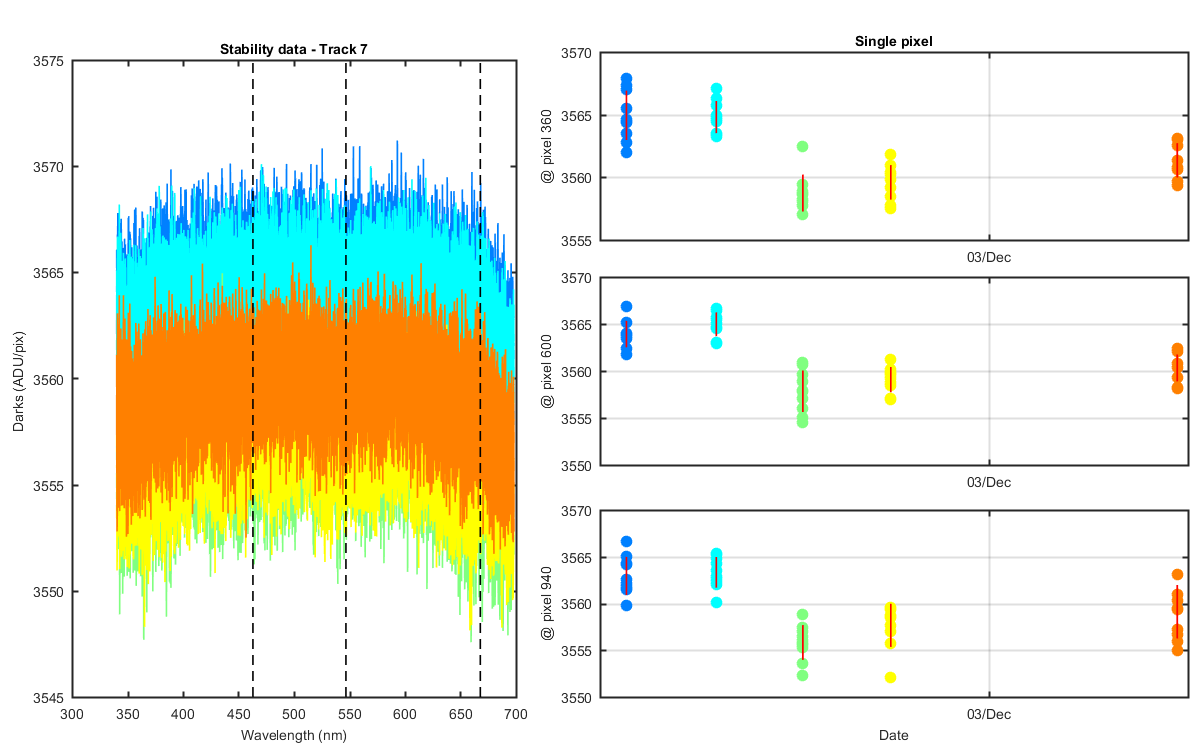
Track 7: showing each of the 10 dark scans for each days data. The Darks have units of ADU/pix and so are not divided by integration time. The data are NOT normalized to the ol455 monitor data. The black dashed lines show the pixel locations of the data on the graphs to the right. The right 3 stacked panels shows a single pixel for each dark/day combo. The red line is the standard deviation of the 8 points from each day.
Figure 7
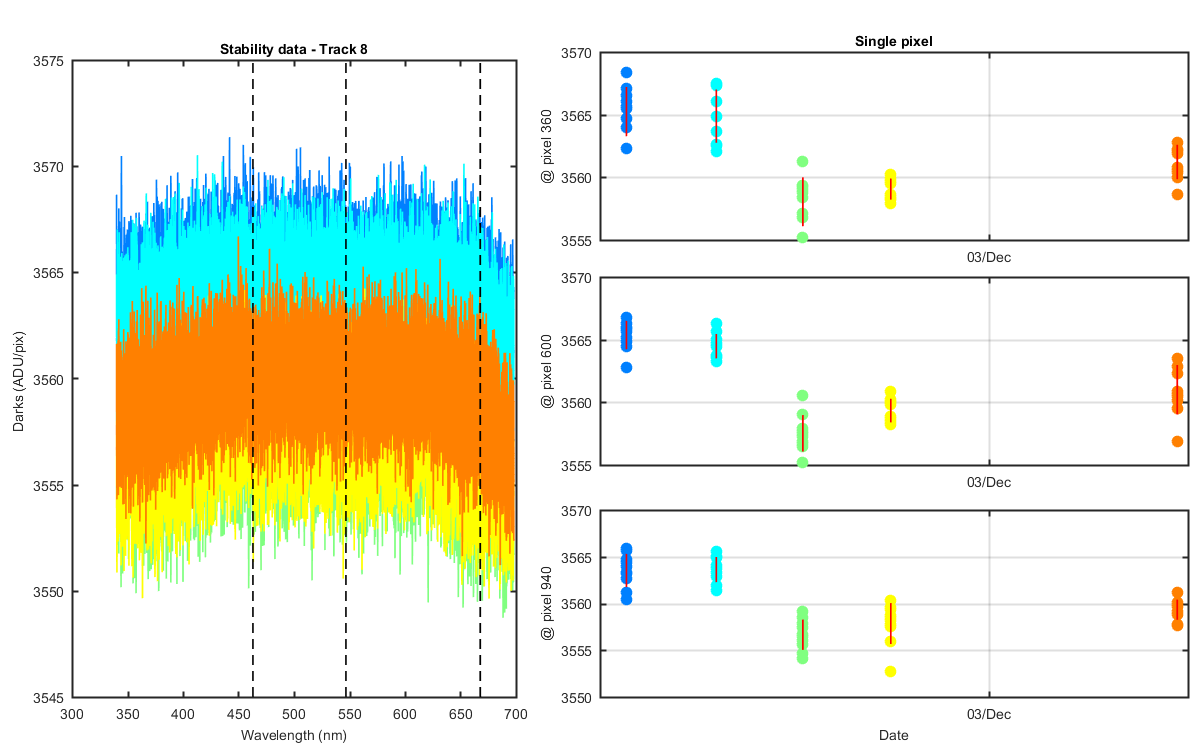
Track 8: showing each of the 10 dark scans for each days data. The Darks have units of ADU/pix and so are not divided by integration time. The data are NOT normalized to the ol455 monitor data. The black dashed lines show the pixel locations of the data on the graphs to the right. The right 3 stacked panels shows a single pixel for each dark/day combo. The red line is the standard deviation of the 8 points from each day.
Figure 8
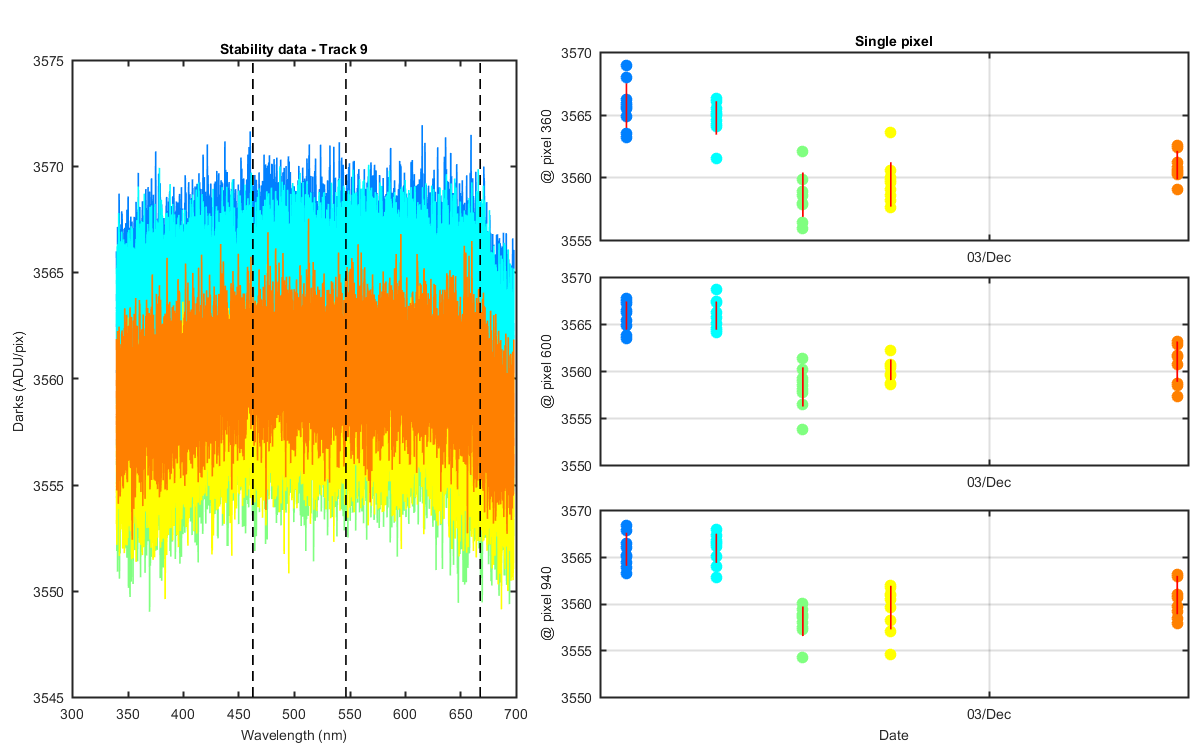
Track 9: showing each of the 10 dark scans for each days data. The Darks have units of ADU/pix and so are not divided by integration time. The data are NOT normalized to the ol455 monitor data. The black dashed lines show the pixel locations of the data on the graphs to the right. The right 3 stacked panels shows a single pixel for each dark/day combo. The red line is the standard deviation of the 8 points from each day.
Figure 9
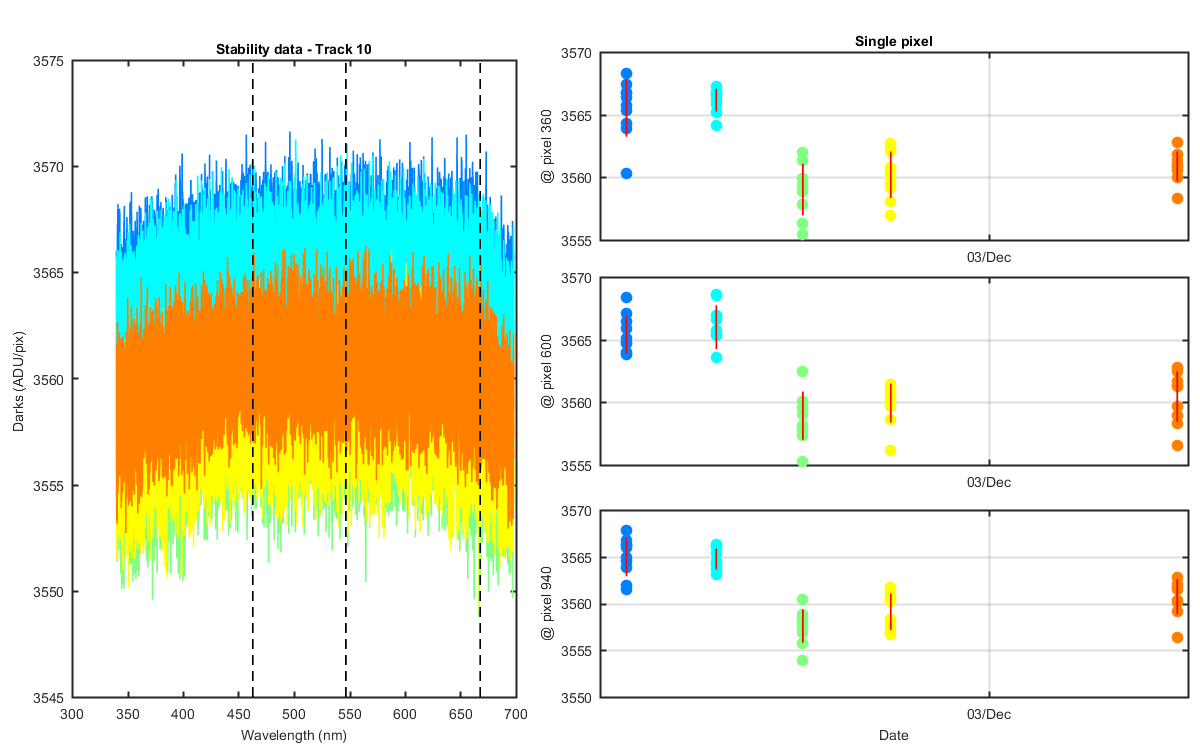
Track 10: showing each of the 10 dark scans for each days data. The Darks have units of ADU/pix and so are not divided by integration time. The data are NOT normalized to the ol455 monitor data. The black dashed lines show the pixel locations of the data on the graphs to the right. The right 3 stacked panels shows a single pixel for each dark/day combo. The red line is the standard deviation of the 8 points from each day.
Figure 10
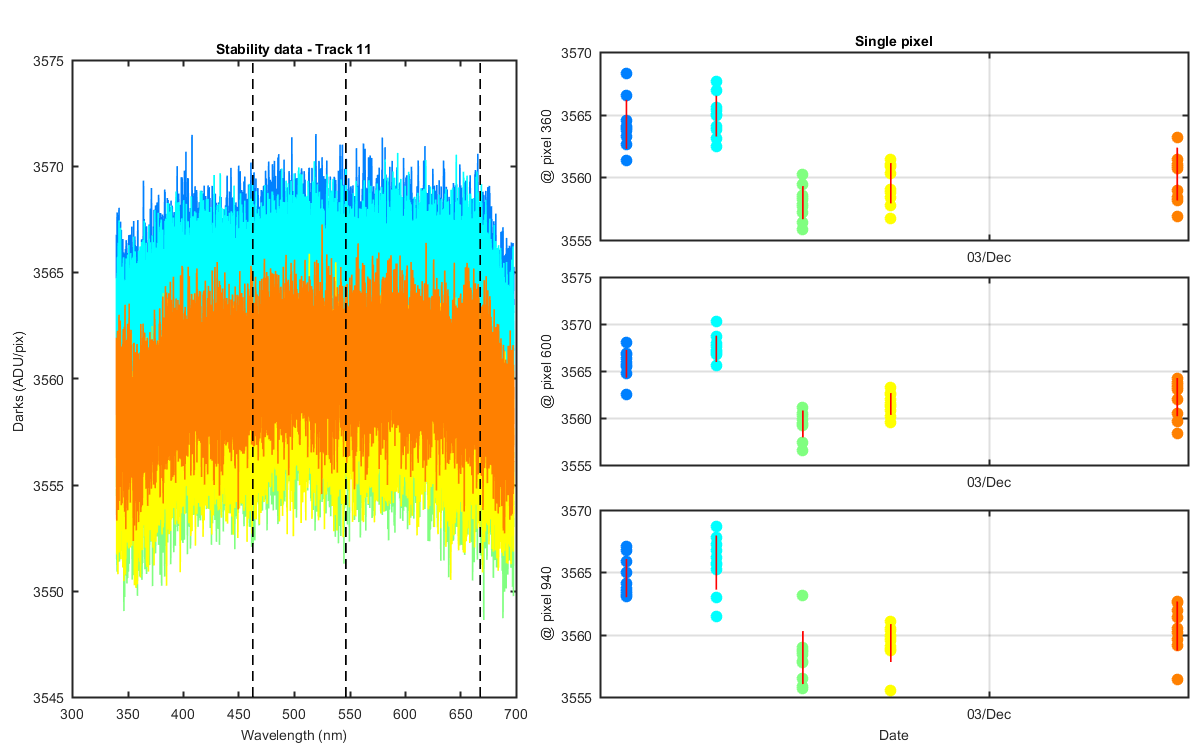
Track 11: showing each of the 10 dark scans for each days data. The Darks have units of ADU/pix and so are not divided by integration time. The data are NOT normalized to the ol455 monitor data. The black dashed lines show the pixel locations of the data on the graphs to the right. The right 3 stacked panels shows a single pixel for each dark/day combo. The red line is the standard deviation of the 8 points from each day.
Figure 11
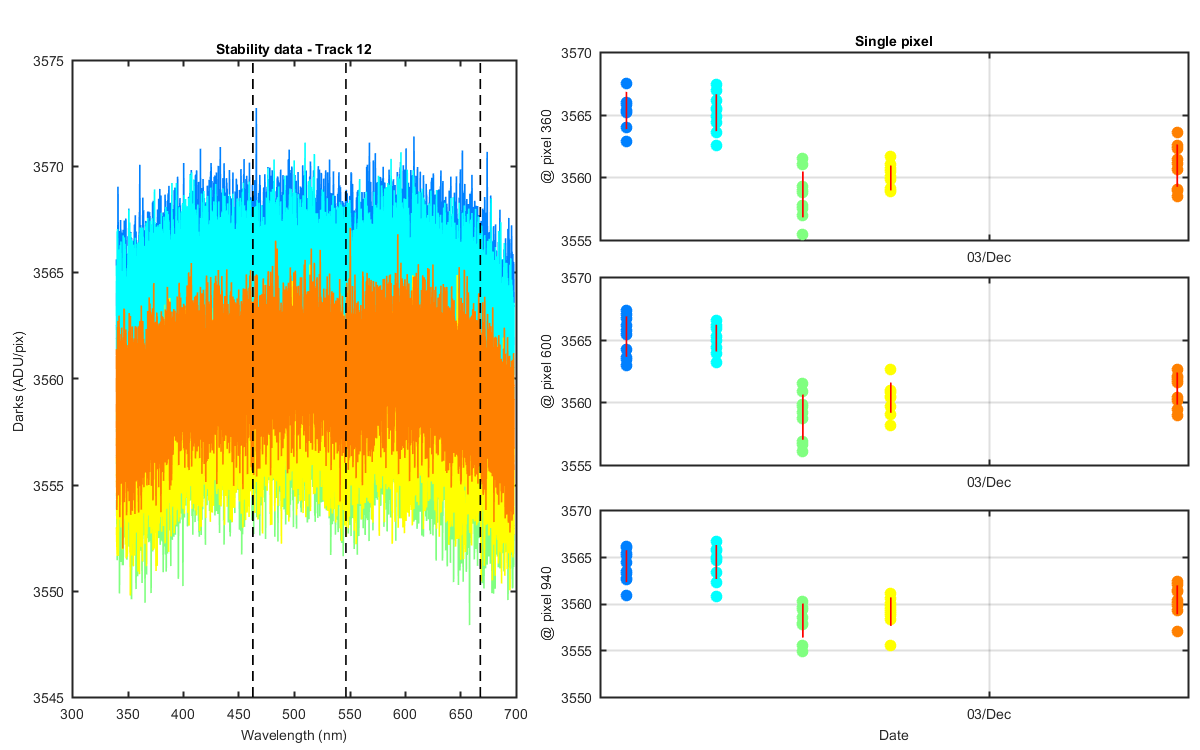
Track 12: showing each of the 10 dark scans for each days data. The Darks have units of ADU/pix and so are not divided by integration time. The data are NOT normalized to the ol455 monitor data. The black dashed lines show the pixel locations of the data on the graphs to the right. The right 3 stacked panels shows a single pixel for each dark/day combo. The red line is the standard deviation of the 8 points from each day.
Figure 12
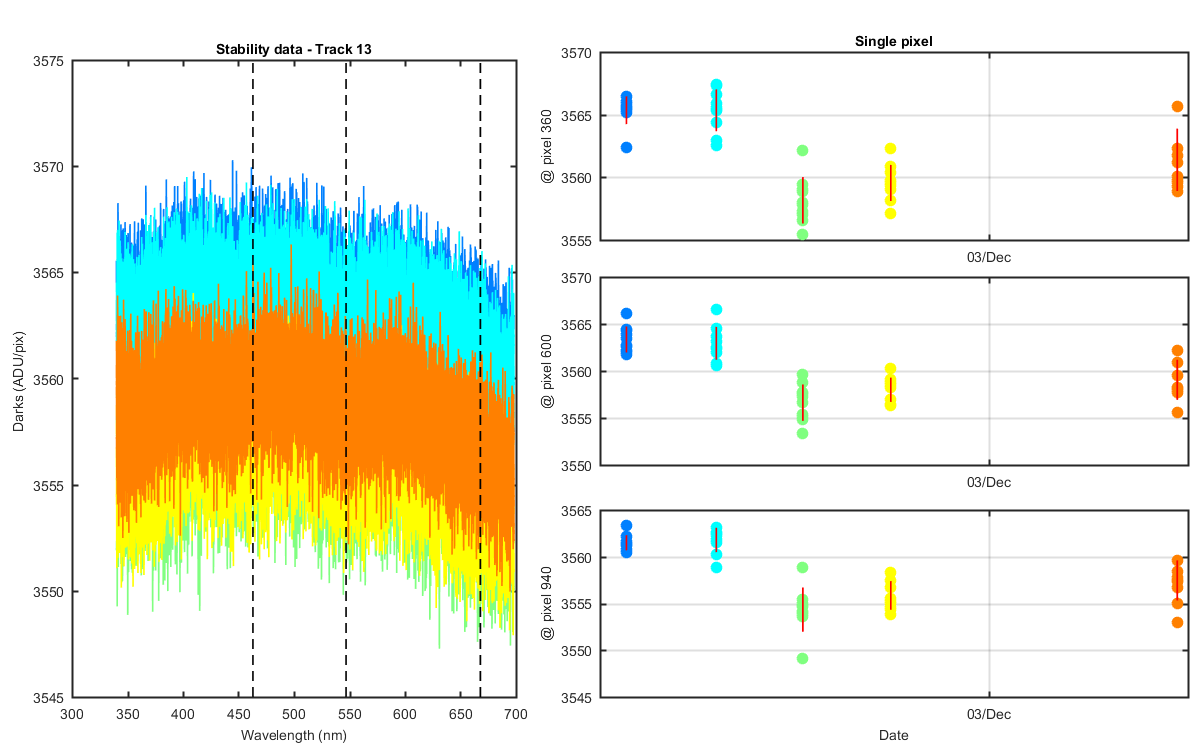
Track 13: showing each of the 10 dark scans for each days data. The Darks have units of ADU/pix and so are not divided by integration time. The data are NOT normalized to the ol455 monitor data. The black dashed lines show the pixel locations of the data on the graphs to the right. The right 3 stacked panels shows a single pixel for each dark/day combo. The red line is the standard deviation of the 8 points from each day.
Figure 13
Track 14: showing each of the 10 dark scans for each days data. The Darks have units of ADU/pix and so are not divided by integration time. The data are NOT normalized to the ol455 monitor data. The black dashed lines show the pixel locations of the data on the graphs to the right. The right 3 stacked panels shows a single pixel for each dark/day combo. The red line is the standard deviation of the 8 points from each day.
Figure 14
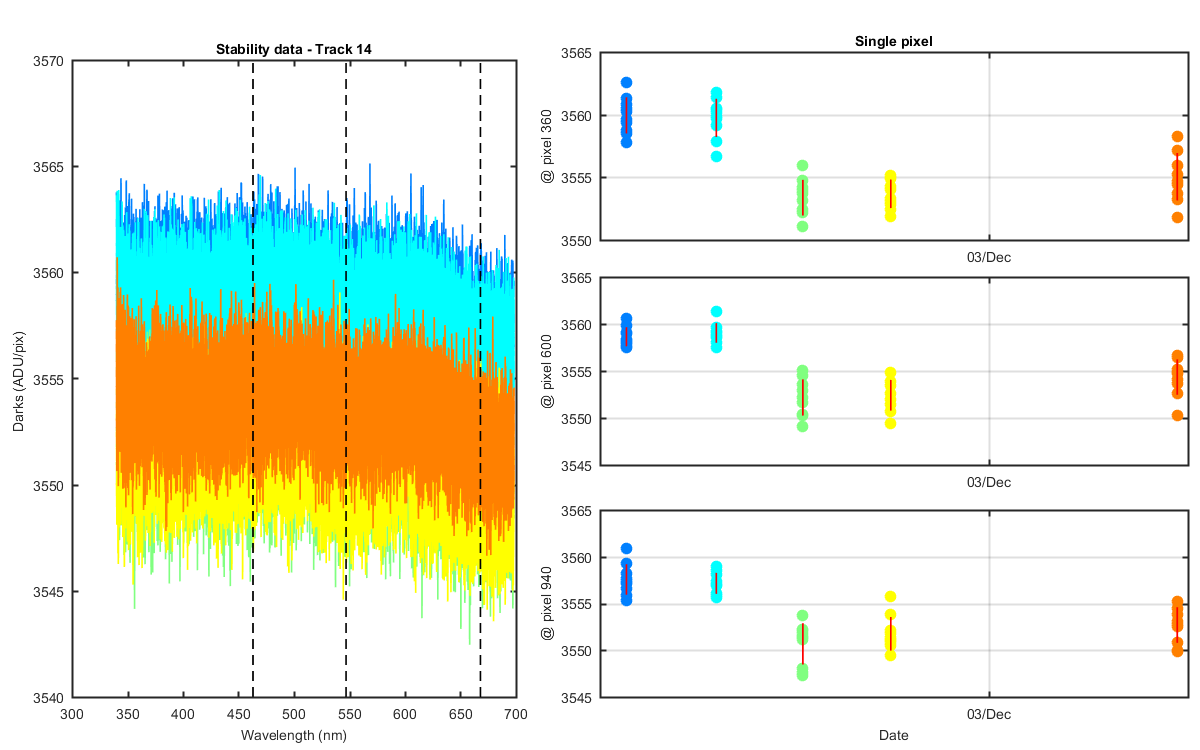
Figure 15
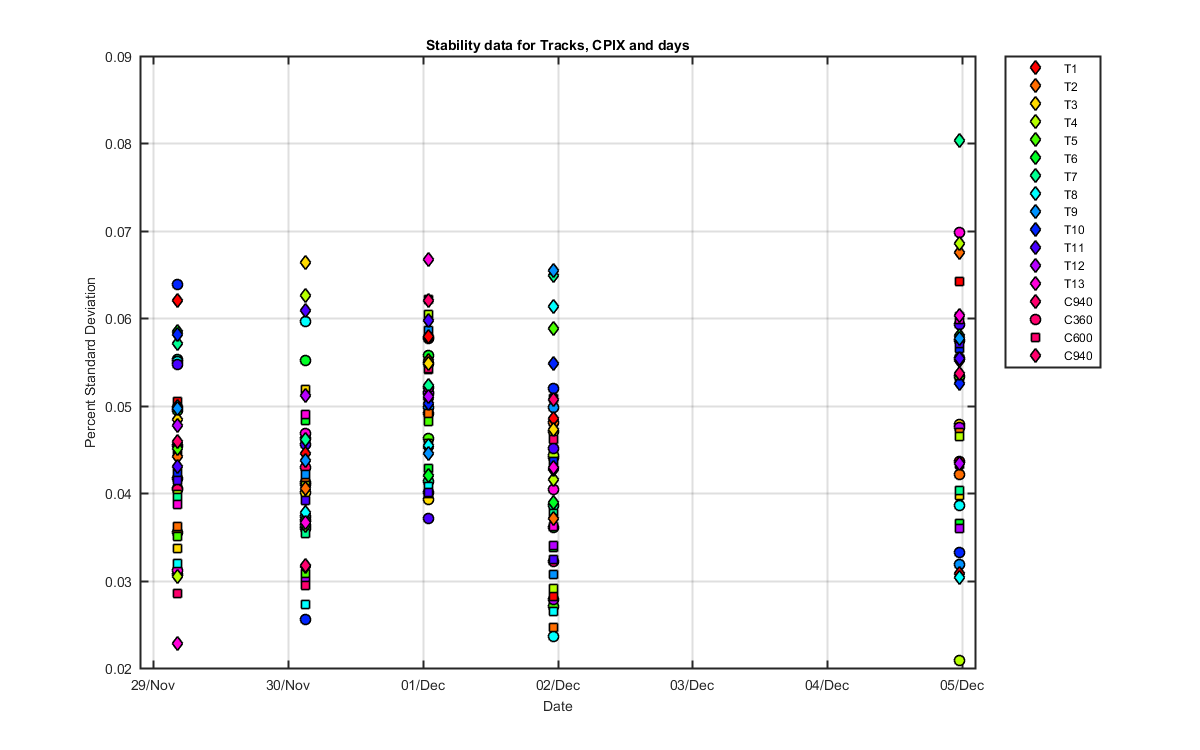
Figure 16
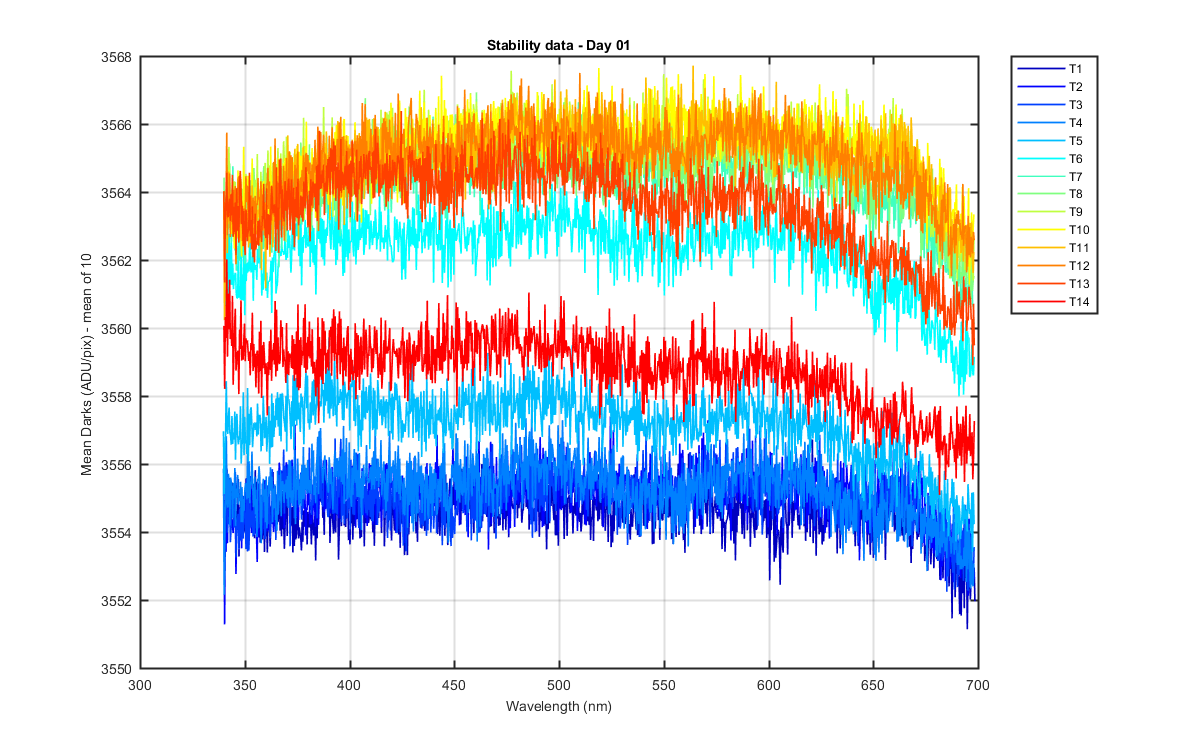
Figure 17
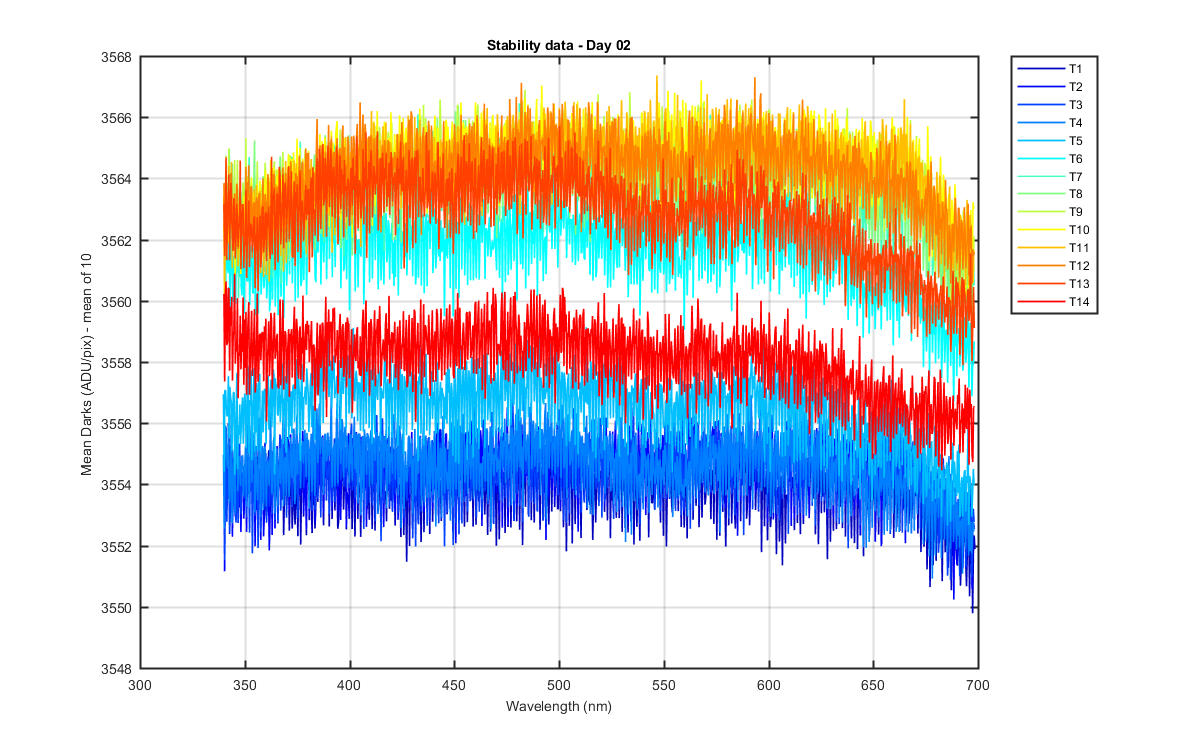
Figure 18
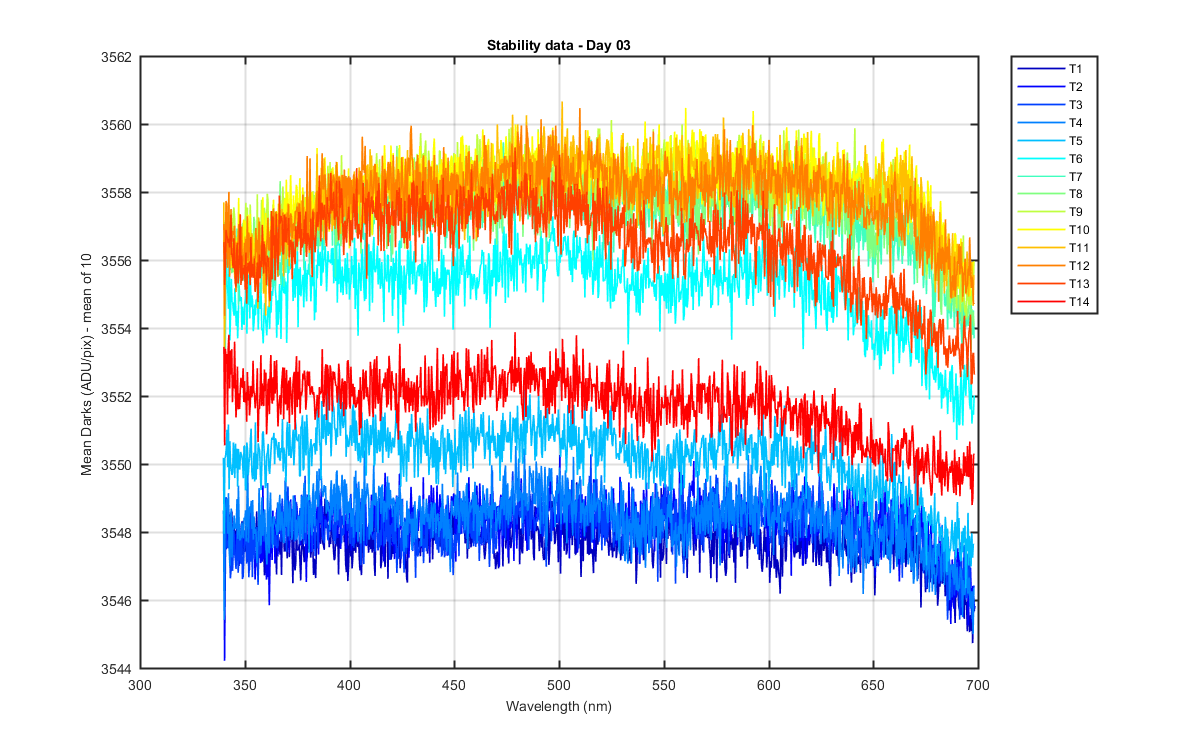
Figure 19
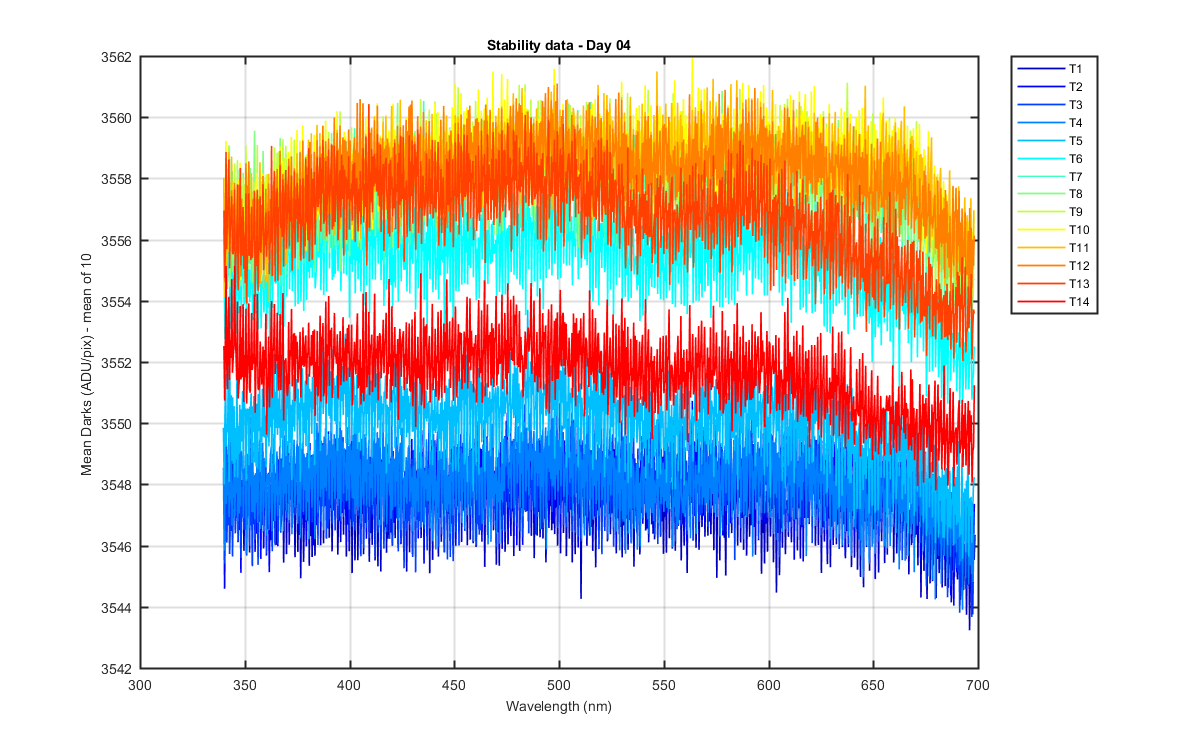
Figure 20
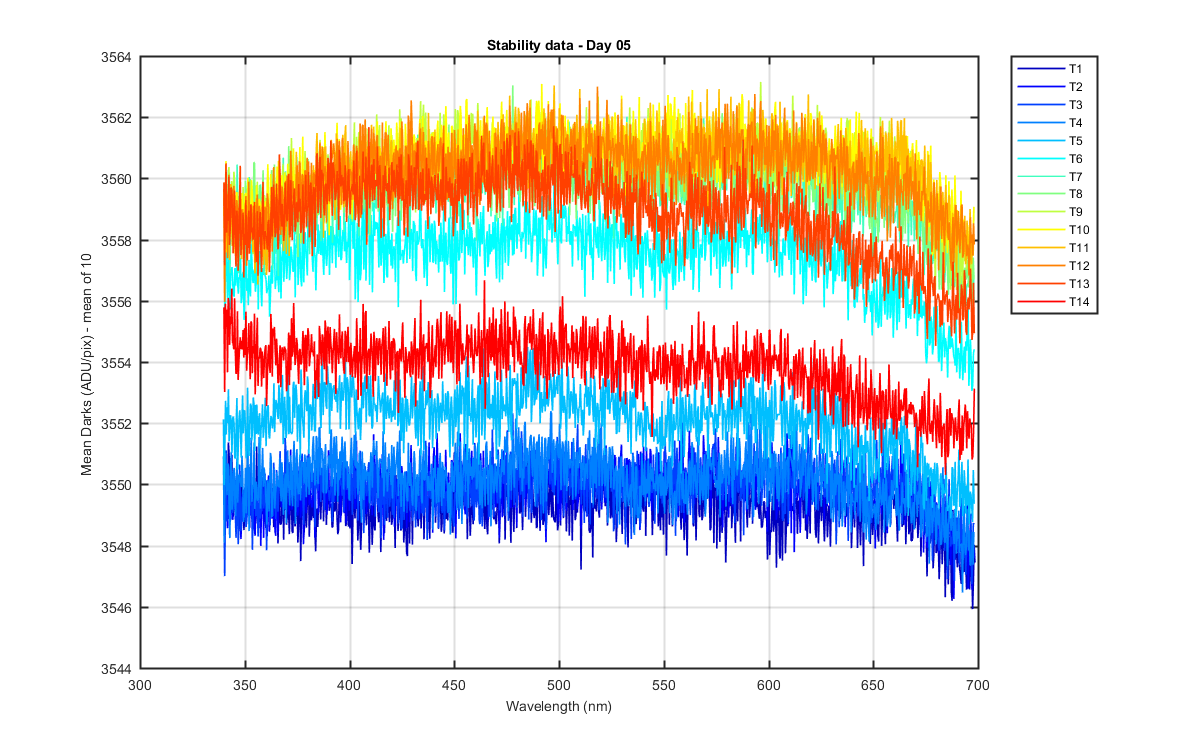
Figure 21

Figure 22