REVISION DATE: 07-Dec-2017 11:39:10
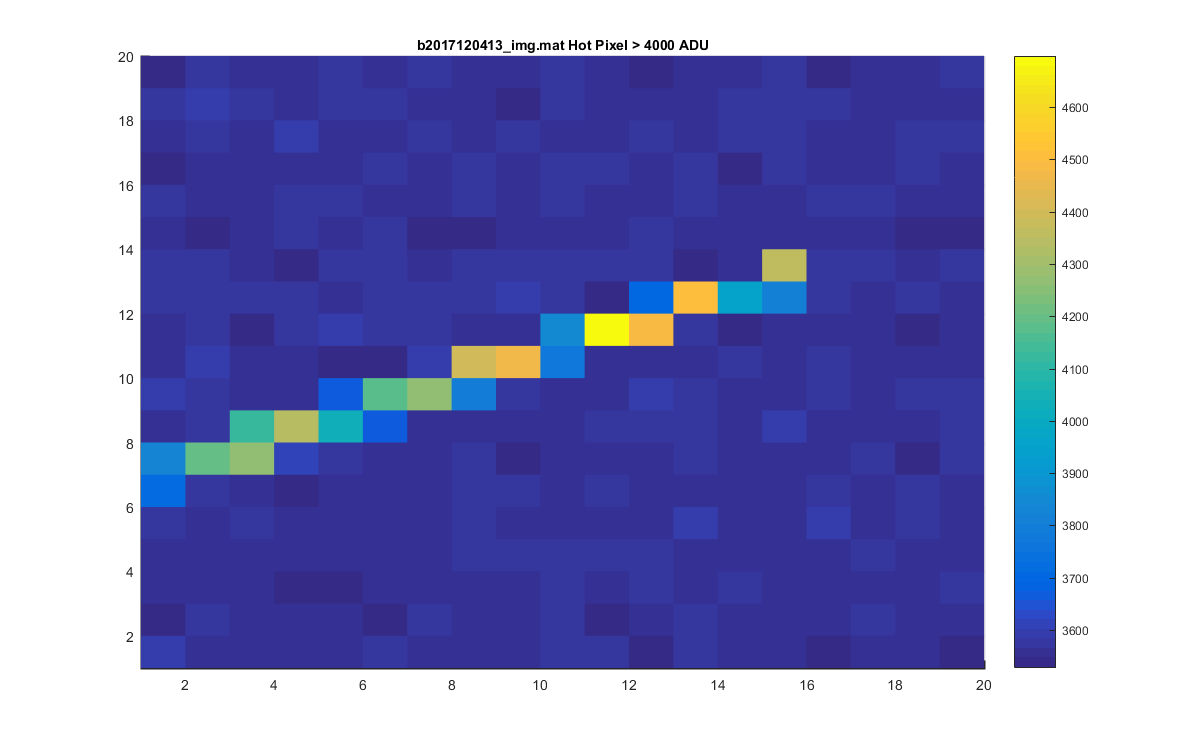
Mike suggested looking at the hot pixel on the CCD to see if it is stable. The Hot pixel is at Row 693 and Column 459. The first graph shows the values at that pixel as colored cirlces. The small blue dots are the surrounding 8 pixels (plotted individdually). I also added a std plot (figure 3). The idea here was to see if, excluding the high values, the std of the hot pixel was the same as the surrounding pixels. I.E. is the hot pixel more variable than the surrounding pixels. To do this math for each day calculated the std of the 24 hot pixels (removing the high values) these are the circles. For the 8 surrounding pixels I repeated this 8 times. So for each surrounding pixel there is a std of the 24 values (high values removed). When the hot pixel is greater than 4000 ADU the surrounding pixels also increase. So for this files I added surface plots of the image plus or minus 10 pixels around the hot pixel. I also did one surface for the case where the hot pixel is less than 4000. See the figures title for which is which.
Figure 1
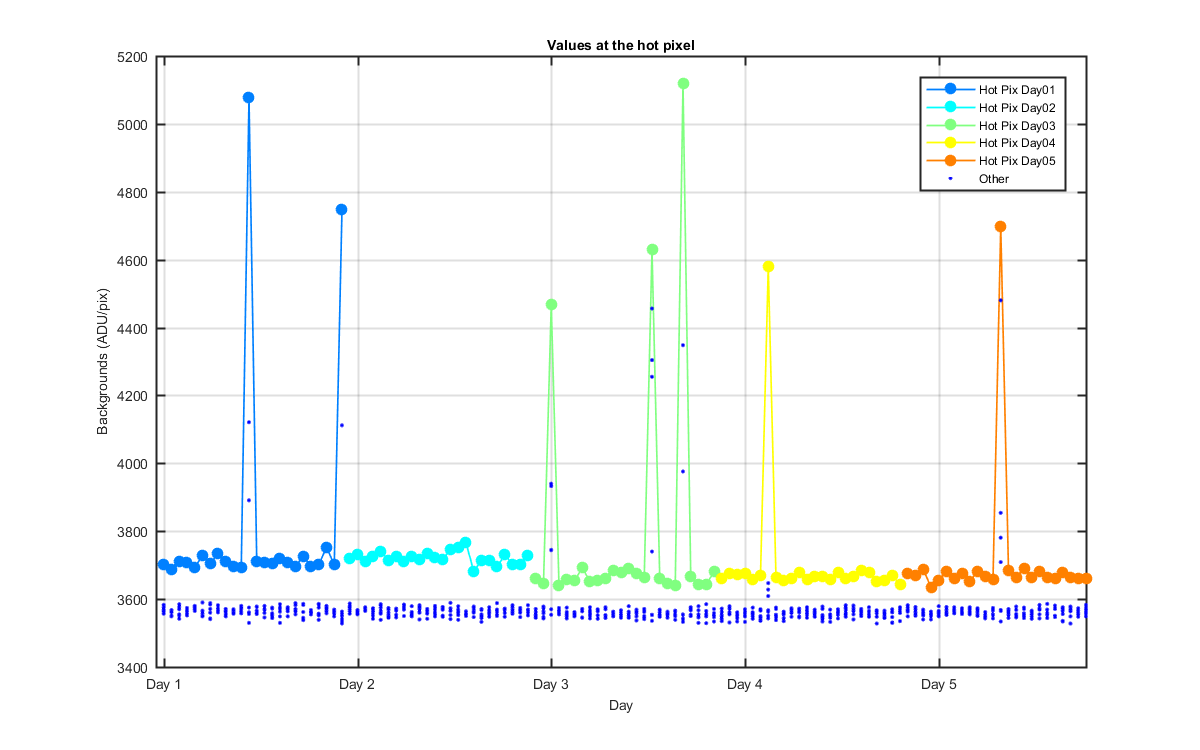
Figure 2
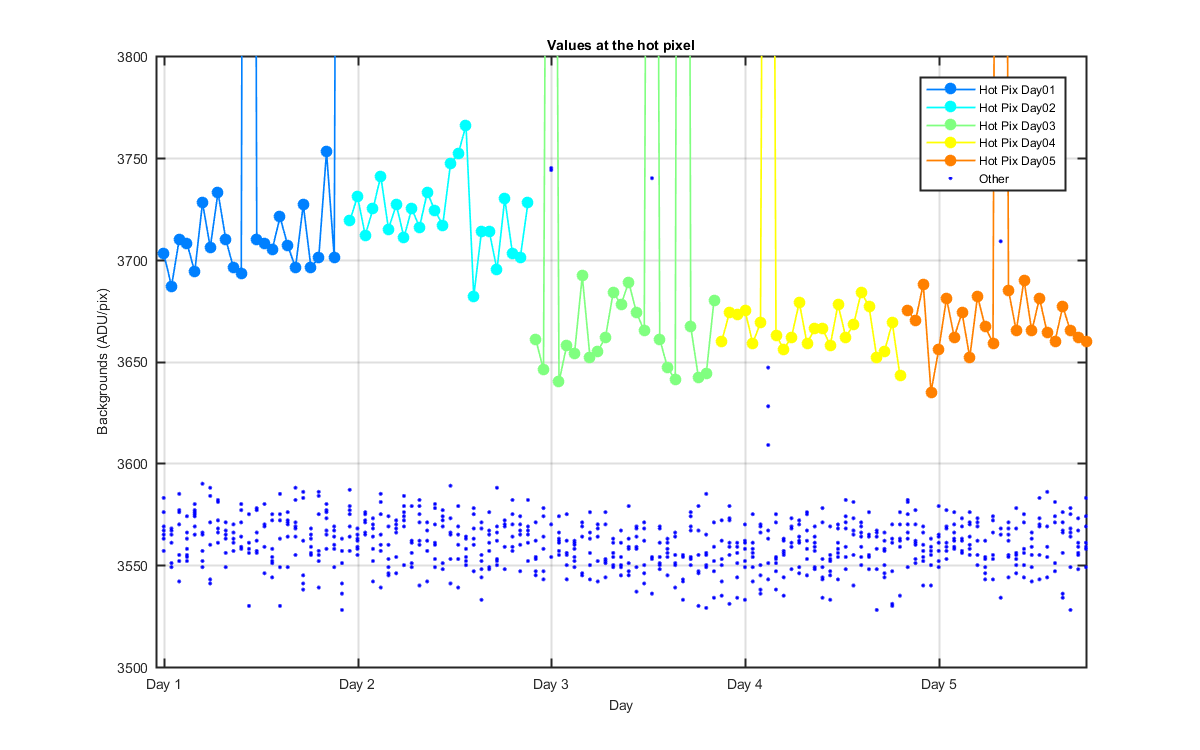
Figure 3
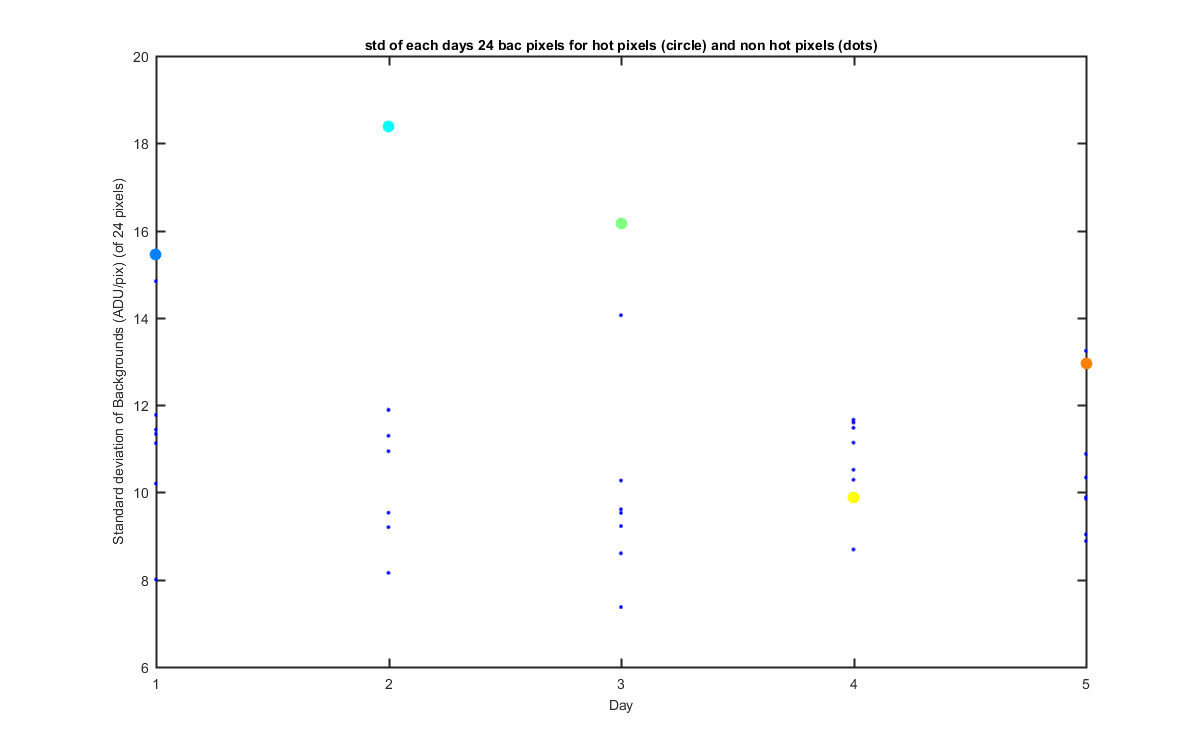
Figure 4
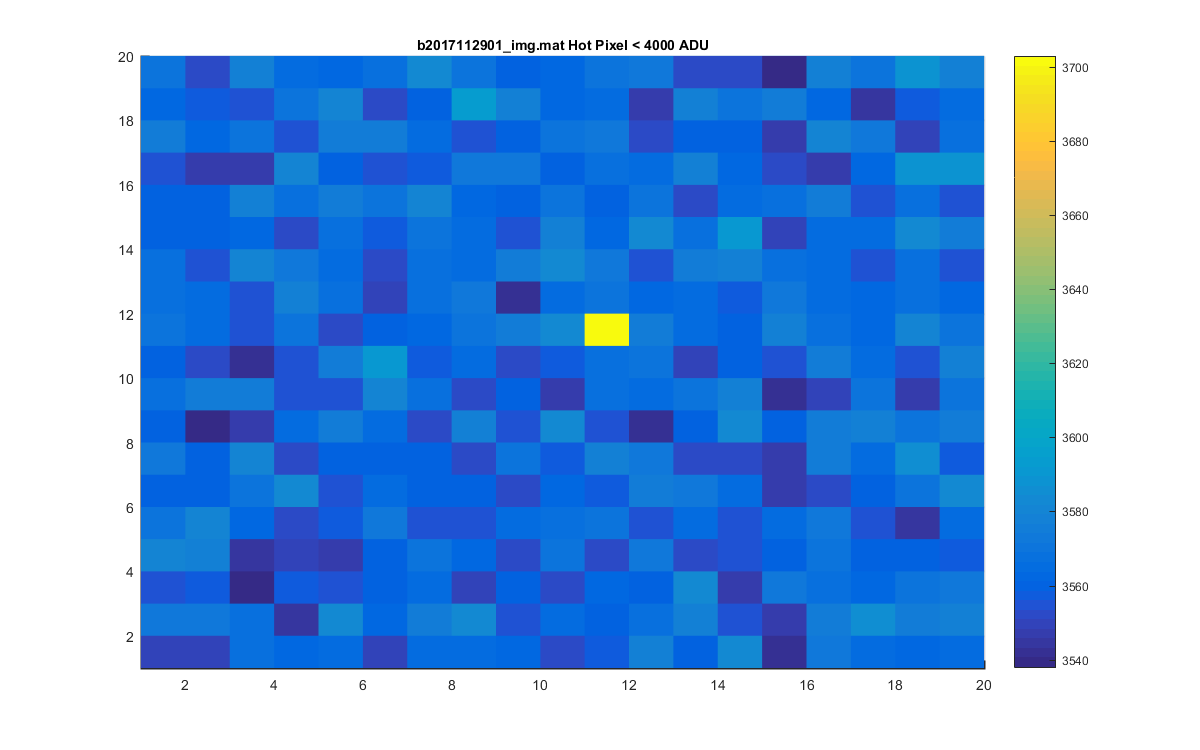
Figure 5
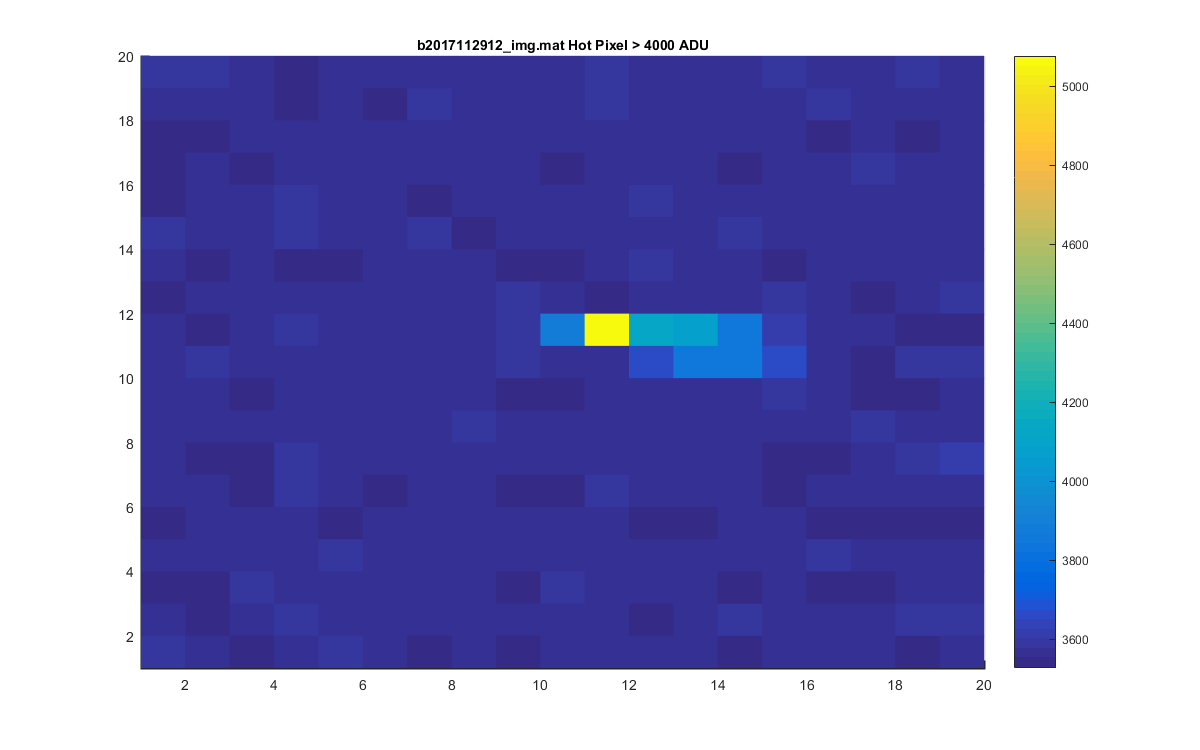
Figure 6
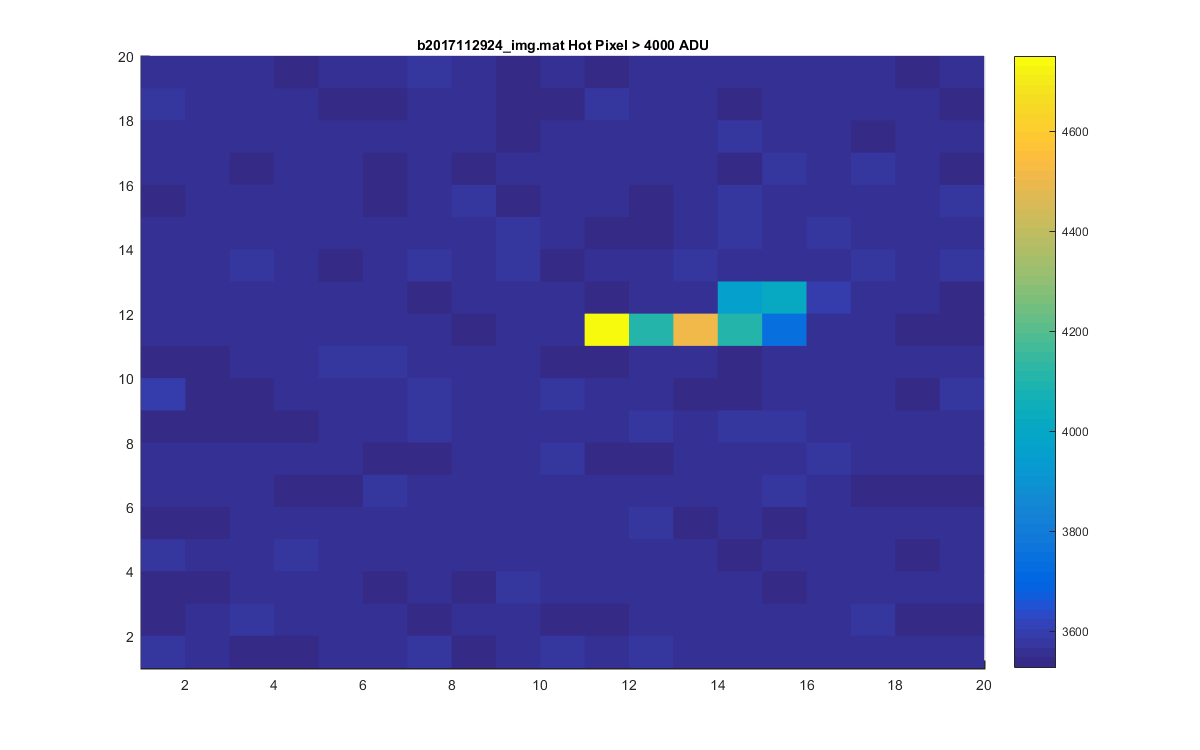
Figure 7
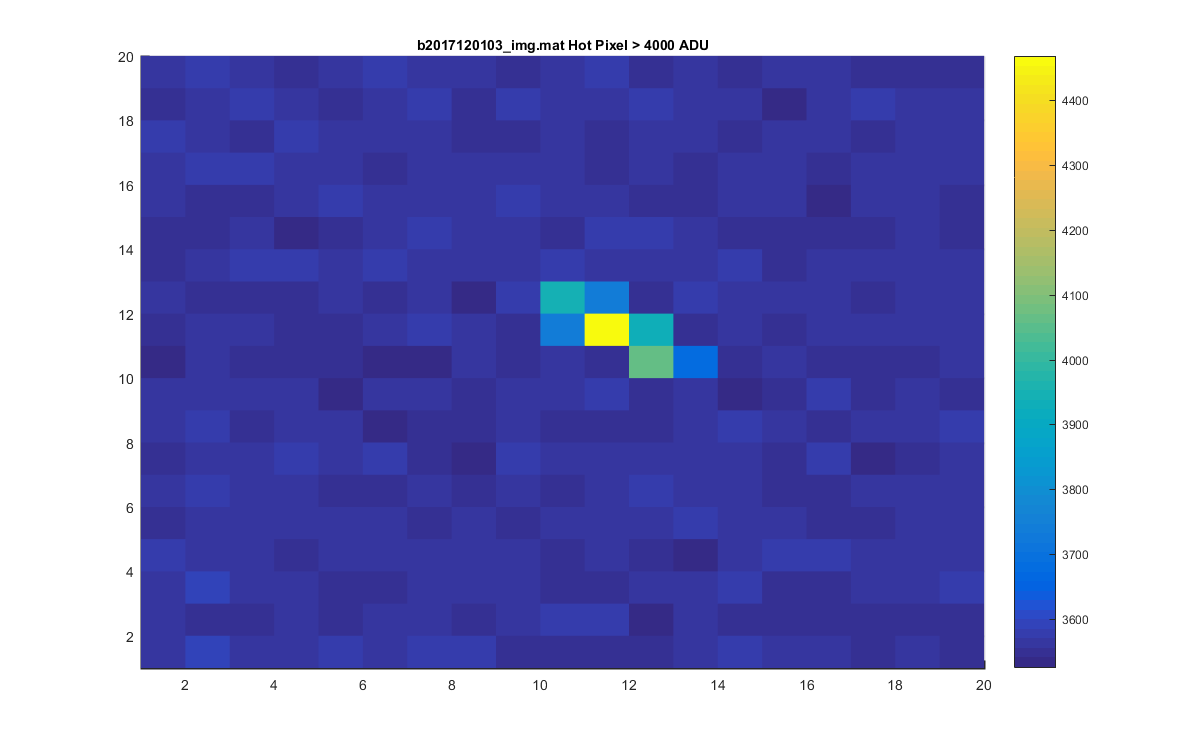
Figure 8
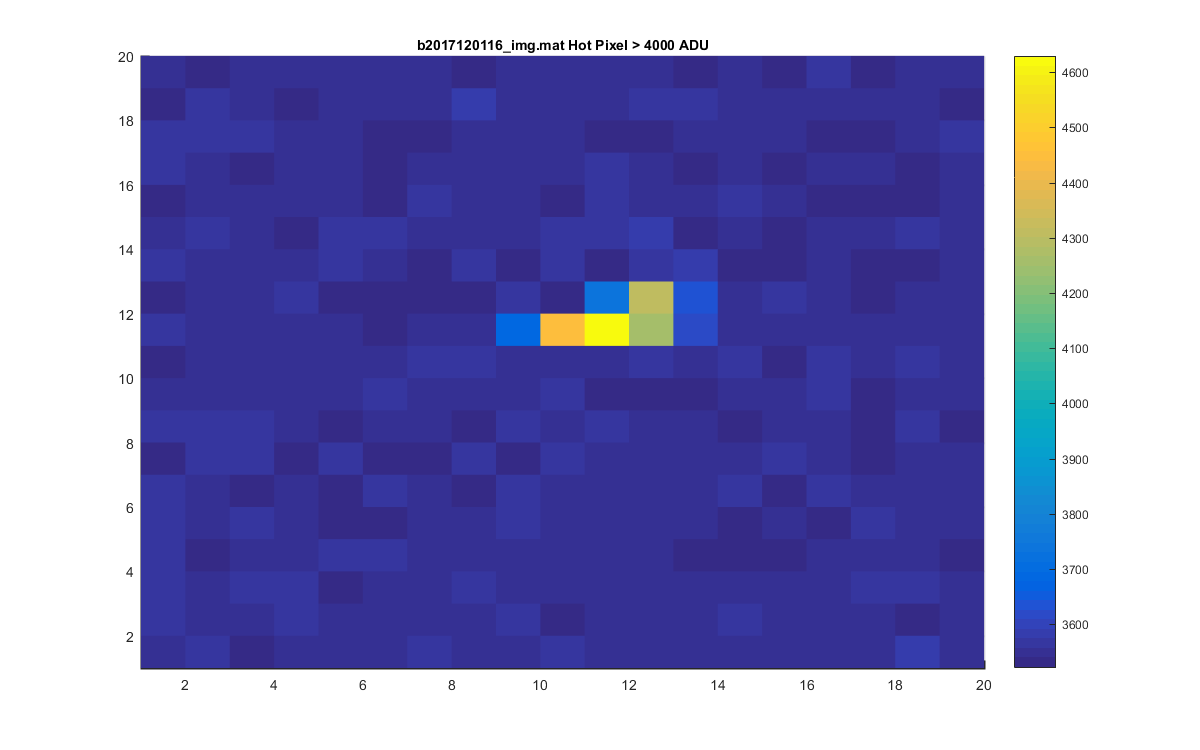
Figure 9
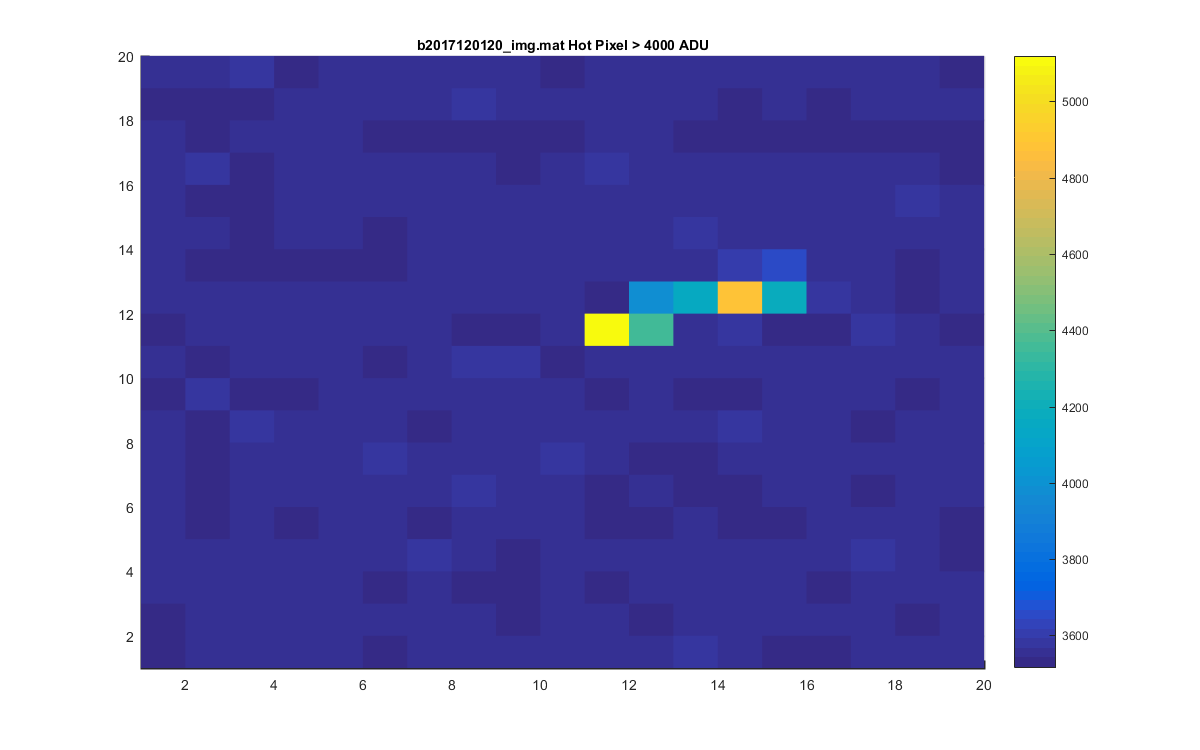
Figure 10
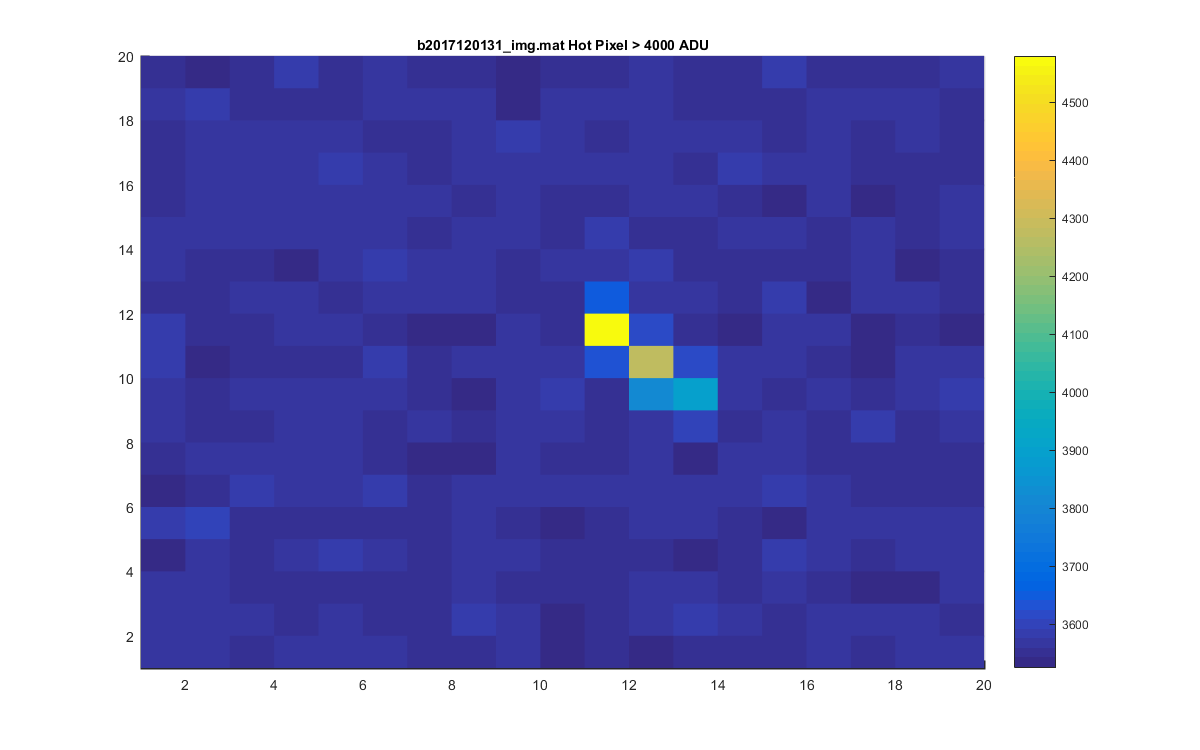
Figure 11