REVISION DATE: 15-Dec-2017 21:17:39
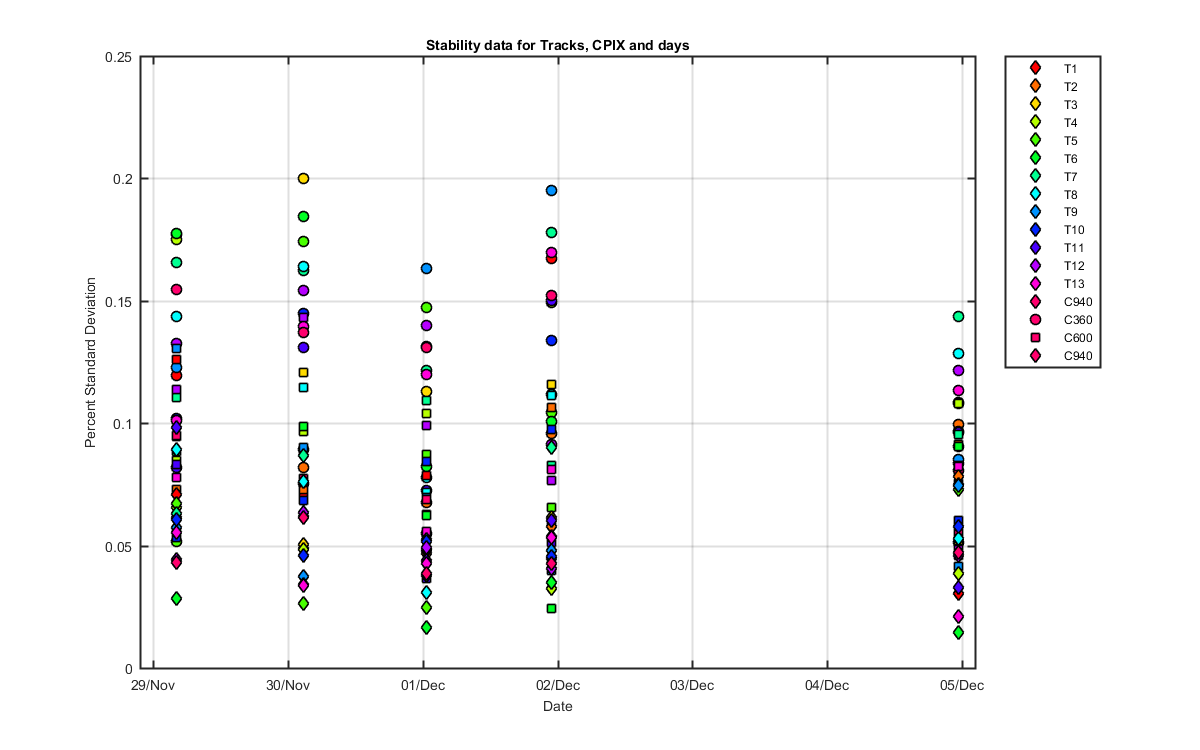
This is looking at the spectal stability of the lamp data Mike is collecting in Hawaii over a number of days. I took the first day first data set and divided all the following data sets but this one data set (for each track)
The table shows the Ratio of the 5 net lights and there percent standard deviation for each day and track. Nets are lite-dark divided by int time so units are ADU/pix/sec. The data are normalized to the ol455 monitor data by dividing the net signal by the ol455 data/2.391e-08. The Ratio is calculated but dividing each of the days 5 net lights by the very fist net light on day 1 (not a mean of the day 1s 5 net lights)
| Track | Day | CPIX 360 Mean / %std |
CPIX 600 Mean / %std |
CPIX 940 Mean / %std |
|---|---|---|---|---|
| 1 | 1 | 1.00082 / 0.1197 | 1.00213 / 0.1261 | 1.00086 / 0.0709 |
| 1 | 2 | 1.00236 / 0.0894 | 1.00261 / 0.0695 | 1.00152 / 0.0619 |
| 1 | 3 | 1.00173 / 0.1314 | 1.00151 / 0.0785 | 1.00091 / 0.0466 |
| 1 | 4 | 1.00213 / 0.1674 | 1.00174 / 0.0591 | 1.00083 / 0.0408 |
| 1 | 5 | 1.00192 / 0.1085 | 1.00193 / 0.0826 | 1.00073 / 0.0305 |
| 2 | 1 | 1.00107 / 0.1772 | 1.00092 / 0.0729 | 1.00089 / 0.0617 |
| 2 | 2 | 1.00161 / 0.0819 | 1.00201 / 0.0730 | 1.00147 / 0.0487 |
| 2 | 3 | 1.00183 / 0.0676 | 1.00134 / 0.0626 | 1.00115 / 0.0468 |
| 2 | 4 | 1.00150 / 0.0956 | 1.00126 / 0.1065 | 1.00076 / 0.0576 |
| 2 | 5 | 1.00272 / 0.0996 | 1.00119 / 0.0914 | 1.00124 / 0.0784 |
| 3 | 1 | 0.99998 / 0.1655 | 1.00156 / 0.0883 | 1.00067 / 0.0673 |
| 3 | 2 | 1.00010 / 0.2001 | 1.00126 / 0.1207 | 1.00110 / 0.0505 |
| 3 | 3 | 1.00047 / 0.1128 | 1.00130 / 0.0526 | 1.00061 / 0.0481 |
| 3 | 4 | 1.00060 / 0.1117 | 1.00097 / 0.1156 | 1.00023 / 0.0616 |
| 3 | 5 | 1.00036 / 0.0513 | 1.00079 / 0.0520 | 1.00014 / 0.0387 |
| 4 | 1 | 1.00173 / 0.1749 | 1.00105 / 0.0849 | 1.00097 / 0.0655 |
| 4 | 2 | 1.00255 / 0.1449 | 1.00095 / 0.0966 | 1.00086 / 0.0486 |
| 4 | 3 | 1.00288 / 0.0549 | 1.00142 / 0.1041 | 1.00101 / 0.0379 |
| 4 | 4 | 1.00305 / 0.1494 | 1.00036 / 0.0590 | 1.00018 / 0.0326 |
| 4 | 5 | 1.00337 / 0.0834 | 1.00088 / 0.1079 | 1.00050 / 0.0385 |
| 5 | 1 | 1.00078 / 0.0516 | 1.00091 / 0.0552 | 1.00118 / 0.0672 |
| 5 | 2 | 1.00223 / 0.1743 | 1.00082 / 0.0773 | 1.00076 / 0.0263 |
| 5 | 3 | 1.00399 / 0.1474 | 1.00149 / 0.0873 | 1.00147 / 0.0247 |
| 5 | 4 | 1.00174 / 0.1044 | 1.00045 / 0.0656 | 1.00034 / 0.0449 |
| 5 | 5 | 1.00312 / 0.0968 | 1.00090 / 0.0545 | 1.00083 / 0.0731 |
| 6 | 1 | 1.00262 / 0.1776 | 1.00141 / 0.0883 | 1.00036 / 0.0283 |
| 6 | 2 | 1.00423 / 0.1845 | 1.00201 / 0.0985 | 1.00053 / 0.0372 |
| 6 | 3 | 1.00435 / 0.0824 | 1.00226 / 0.0624 | 1.00090 / 0.0167 |
| 6 | 4 | 1.00418 / 0.1007 | 1.00128 / 0.0243 | 1.00001 / 0.0349 |
| 6 | 5 | 1.00414 / 0.1080 | 1.00209 / 0.0906 | 1.00009 / 0.0143 |
| 7 | 1 | 1.00068 / 0.1655 | 1.00180 / 0.1106 | 1.00070 / 0.0630 |
| 7 | 2 | 1.00189 / 0.1623 | 1.00202 / 0.0772 | 1.00086 / 0.0868 |
| 7 | 3 | 1.00113 / 0.1215 | 1.00158 / 0.1094 | 0.99983 / 0.0526 |
| 7 | 4 | 1.00131 / 0.1779 | 1.00112 / 0.0825 | 0.99967 / 0.0901 |
| 7 | 5 | 1.00225 / 0.1434 | 1.00054 / 0.0954 | 0.99933 / 0.0751 |
| 8 | 1 | 1.00191 / 0.1437 | 1.00140 / 0.0944 | 1.00086 / 0.0894 |
| 8 | 2 | 1.00190 / 0.1641 | 1.00199 / 0.1148 | 1.00115 / 0.0761 |
| 8 | 3 | 1.00304 / 0.0779 | 1.00175 / 0.0715 | 1.00044 / 0.0307 |
| 8 | 4 | 1.00239 / 0.1116 | 1.00127 / 0.1112 | 1.00026 / 0.0536 |
| 8 | 5 | 1.00311 / 0.1287 | 1.00154 / 0.0754 | 1.00018 / 0.0531 |
| 9 | 1 | 1.00138 / 0.1228 | 1.00191 / 0.1304 | 1.00085 / 0.0575 |
| 9 | 2 | 1.00213 / 0.0754 | 1.00198 / 0.0903 | 1.00061 / 0.0373 |
| 9 | 3 | 1.00253 / 0.1632 | 1.00226 / 0.0698 | 1.00107 / 0.0482 |
| 9 | 4 | 1.00268 / 0.1950 | 1.00128 / 0.0398 | 1.00042 / 0.0481 |
| 9 | 5 | 1.00324 / 0.0851 | 1.00149 / 0.0414 | 1.00075 / 0.0745 |
| 10 | 1 | 1.00033 / 0.1019 | 1.00071 / 0.0532 | 1.00082 / 0.0607 |
| 10 | 2 | 1.00020 / 0.1450 | 1.00047 / 0.0686 | 1.00088 / 0.0461 |
| 10 | 3 | 1.00102 / 0.1313 | 1.00115 / 0.0844 | 1.00134 / 0.0516 |
| 10 | 4 | 1.00018 / 0.1336 | 1.00009 / 0.0974 | 1.00018 / 0.0454 |
| 10 | 5 | 1.00111 / 0.0904 | 1.00016 / 0.0602 | 1.00082 / 0.0578 |
| 11 | 1 | 1.00121 / 0.0819 | 1.00119 / 0.0832 | 1.00152 / 0.0980 |
| 11 | 2 | 1.00134 / 0.1311 | 1.00131 / 0.0762 | 1.00233 / 0.0341 |
| 11 | 3 | 1.00246 / 0.0727 | 1.00176 / 0.0365 | 1.00187 / 0.0440 |
| 11 | 4 | 1.00181 / 0.1500 | 1.00114 / 0.0511 | 1.00167 / 0.0604 |
| 11 | 5 | 1.00240 / 0.0961 | 1.00139 / 0.0458 | 1.00199 / 0.0330 |
| 12 | 1 | 1.00166 / 0.1326 | 1.00184 / 0.1138 | 1.00047 / 0.0442 |
| 12 | 2 | 1.00346 / 0.1541 | 1.00241 / 0.1431 | 1.00122 / 0.0636 |
| 12 | 3 | 1.00236 / 0.1400 | 1.00168 / 0.0992 | 1.00038 / 0.0492 |
| 12 | 4 | 1.00279 / 0.0911 | 1.00137 / 0.0766 | 1.00020 / 0.0408 |
| 12 | 5 | 1.00236 / 0.1214 | 1.00205 / 0.0486 | 1.00034 / 0.0458 |
| 13 | 1 | 1.00089 / 0.1010 | 1.00099 / 0.0780 | 1.00069 / 0.0552 |
| 13 | 2 | 1.00104 / 0.1395 | 1.00082 / 0.0756 | 1.00054 / 0.0338 |
| 13 | 3 | 1.00217 / 0.1198 | 1.00173 / 0.0559 | 1.00078 / 0.0428 |
| 13 | 4 | 1.00151 / 0.1697 | 1.00073 / 0.0812 | 1.00006 / 0.0532 |
| 13 | 5 | 1.00205 / 0.1132 | 1.00086 / 0.0822 | 1.00061 / 0.0209 |
| 14 | 1 | 1.00115 / 0.1547 | 1.00166 / 0.0950 | 1.00024 / 0.0430 |
| 14 | 2 | 1.00233 / 0.1370 | 1.00214 / 0.0772 | 1.00038 / 0.0616 |
| 14 | 3 | 1.00242 / 0.1308 | 1.00223 / 0.0686 | 1.00028 / 0.0386 |
| 14 | 4 | 1.00161 / 0.1520 | 1.00118 / 0.0442 | 0.99948 / 0.0425 |
| 14 | 5 | 1.00221 / 0.0805 | 1.00209 / 0.0563 | 1.00012 / 0.0473 |
Track 1: showing each of the 5 net light scans ratio (to the day 1 net 1 light) for each days data. Nets are lite-dark divided by int time so units are ADU/pix/sec. The data are normalized to the ol455 monitor data by dividing the net signal by the ol455 data/2.391e-08. The black dashed lines show the pixel locations of the data on the graphs to the right. The right 3 stacked panels shows a single pixel for each dark/day combo. The red line is the standard deviation of the 5 points from each day.
Figure 1

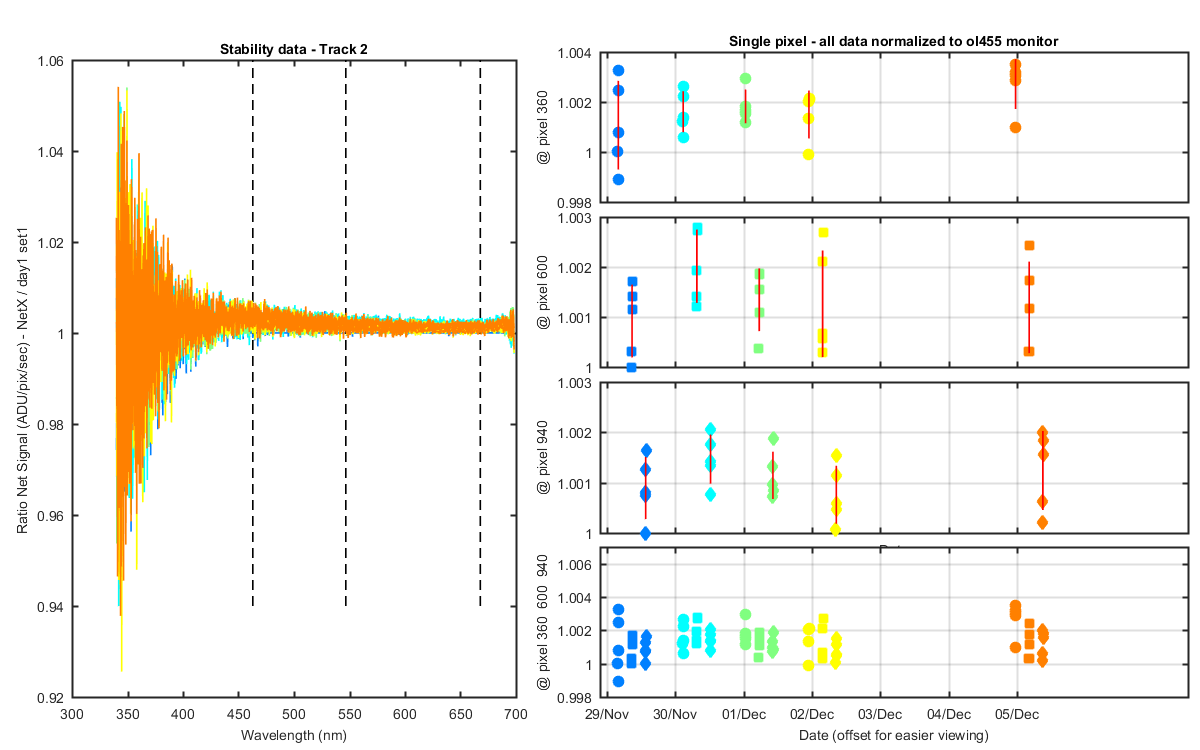
Track 2: showing each of the 5 net light scans ratio (to the day 1 net 1 light) for each days data. Nets are lite-dark divided by int time so units are ADU/pix/sec. The data are normalized to the ol455 monitor data by dividing the net signal by the ol455 data/2.391e-08. The black dashed lines show the pixel locations of the data on the graphs to the right. The right 3 stacked panels shows a single pixel for each dark/day combo. The red line is the standard deviation of the 5 points from each day.
Figure 2
Track 3: showing each of the 5 net light scans ratio (to the day 1 net 1 light) for each days data. Nets are lite-dark divided by int time so units are ADU/pix/sec. The data are normalized to the ol455 monitor data by dividing the net signal by the ol455 data/2.391e-08. The black dashed lines show the pixel locations of the data on the graphs to the right. The right 3 stacked panels shows a single pixel for each dark/day combo. The red line is the standard deviation of the 5 points from each day.
Figure 3

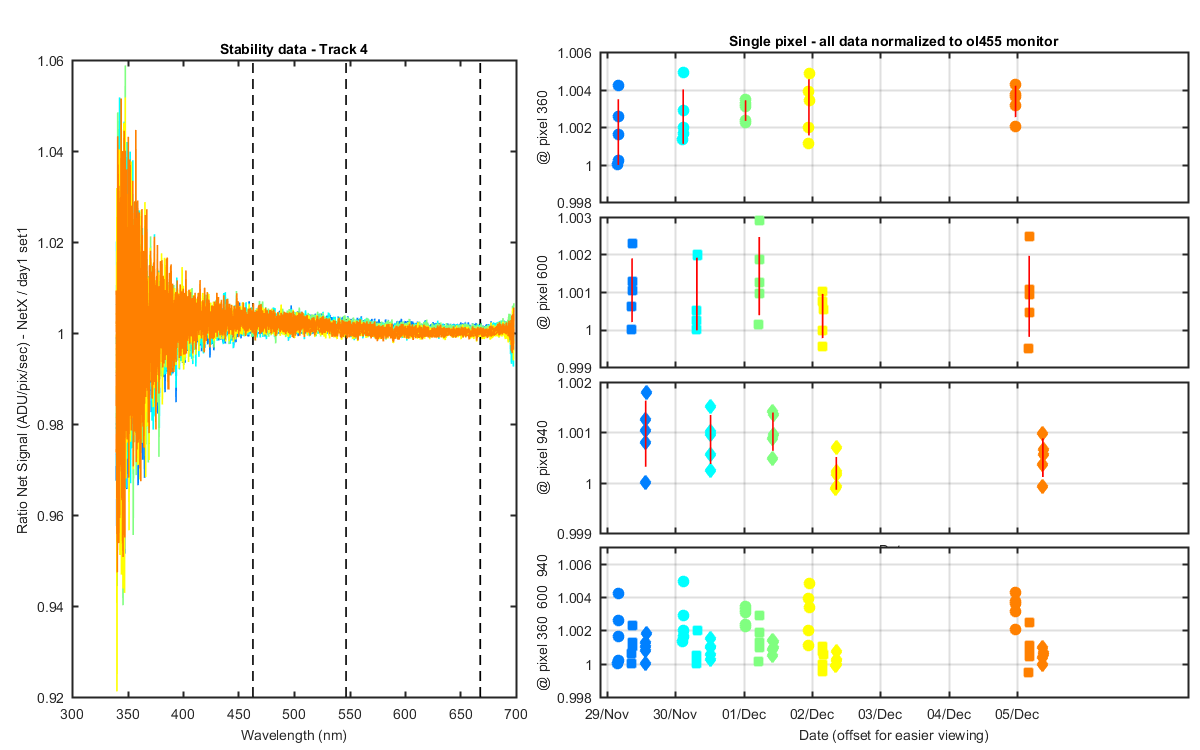
Track 4: showing each of the 5 net light scans ratio (to the day 1 net 1 light) for each days data. Nets are lite-dark divided by int time so units are ADU/pix/sec. The data are normalized to the ol455 monitor data by dividing the net signal by the ol455 data/2.391e-08. The black dashed lines show the pixel locations of the data on the graphs to the right. The right 3 stacked panels shows a single pixel for each dark/day combo. The red line is the standard deviation of the 5 points from each day.
Figure 4
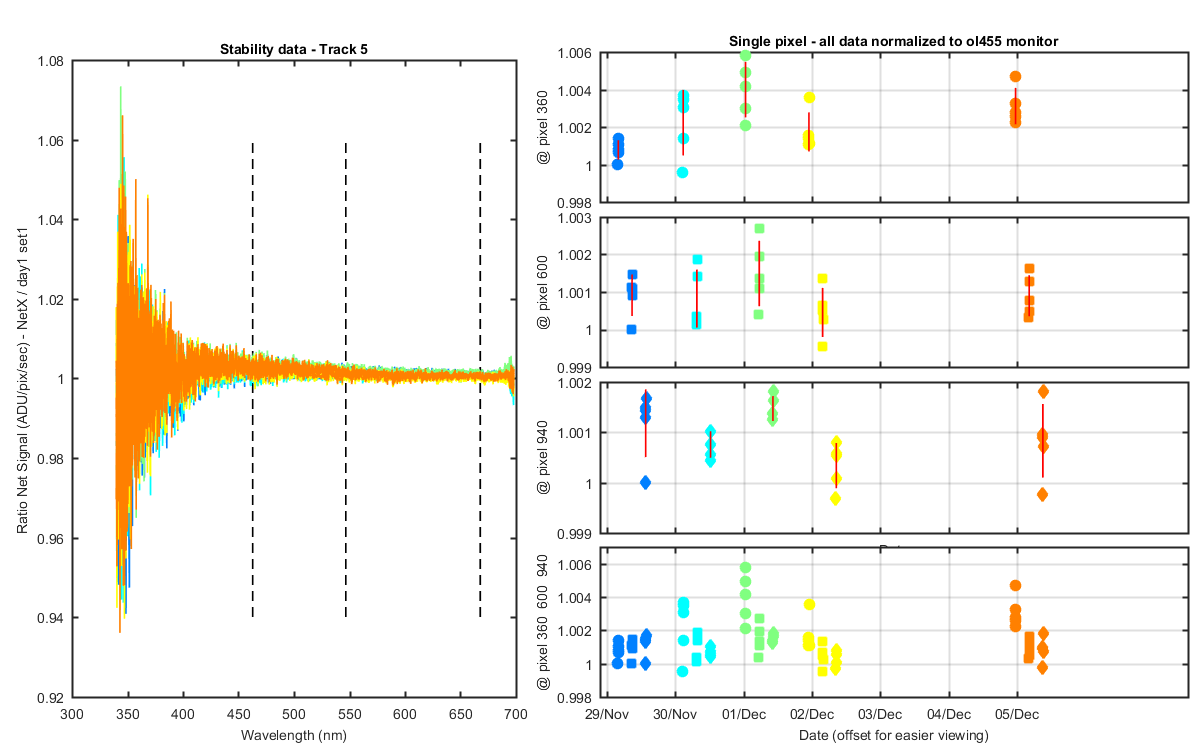
Track 5: showing each of the 5 net light scans ratio (to the day 1 net 1 light) for each days data. Nets are lite-dark divided by int time so units are ADU/pix/sec. The data are normalized to the ol455 monitor data by dividing the net signal by the ol455 data/2.391e-08. The black dashed lines show the pixel locations of the data on the graphs to the right. The right 3 stacked panels shows a single pixel for each dark/day combo. The red line is the standard deviation of the 5 points from each day.
Figure 5
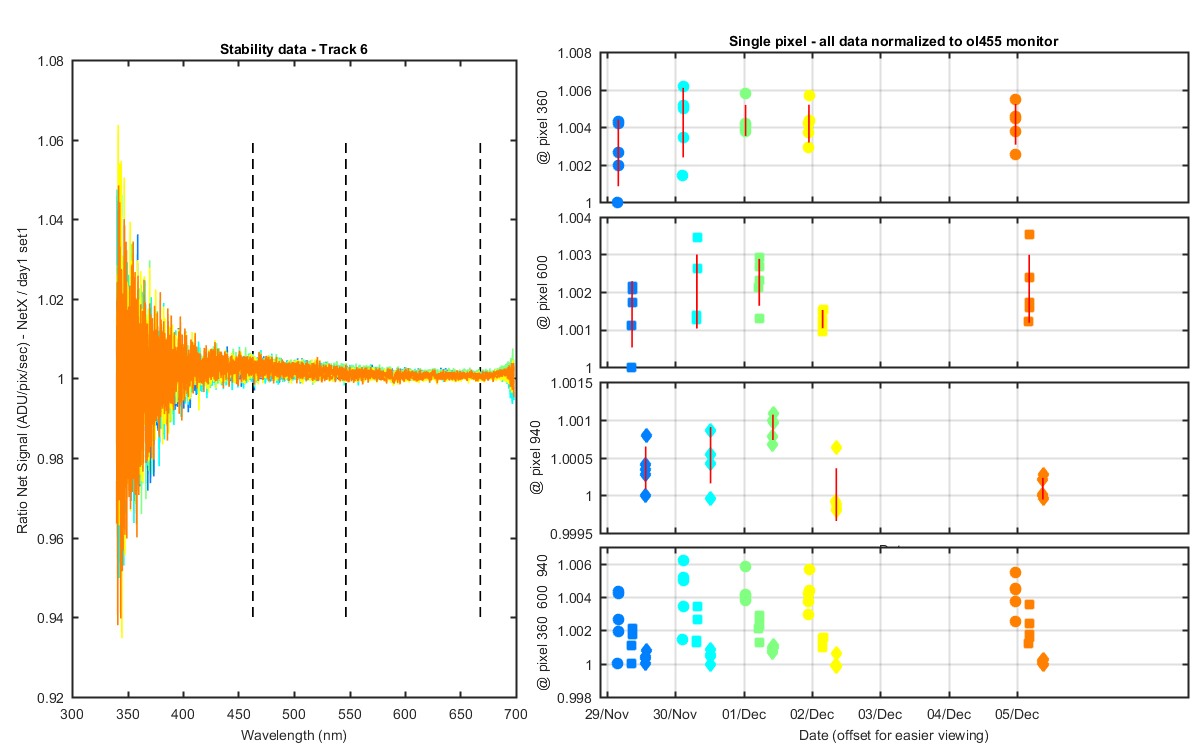
Track 6: showing each of the 5 net light scans ratio (to the day 1 net 1 light) for each days data. Nets are lite-dark divided by int time so units are ADU/pix/sec. The data are normalized to the ol455 monitor data by dividing the net signal by the ol455 data/2.391e-08. The black dashed lines show the pixel locations of the data on the graphs to the right. The right 3 stacked panels shows a single pixel for each dark/day combo. The red line is the standard deviation of the 5 points from each day.
Figure 6
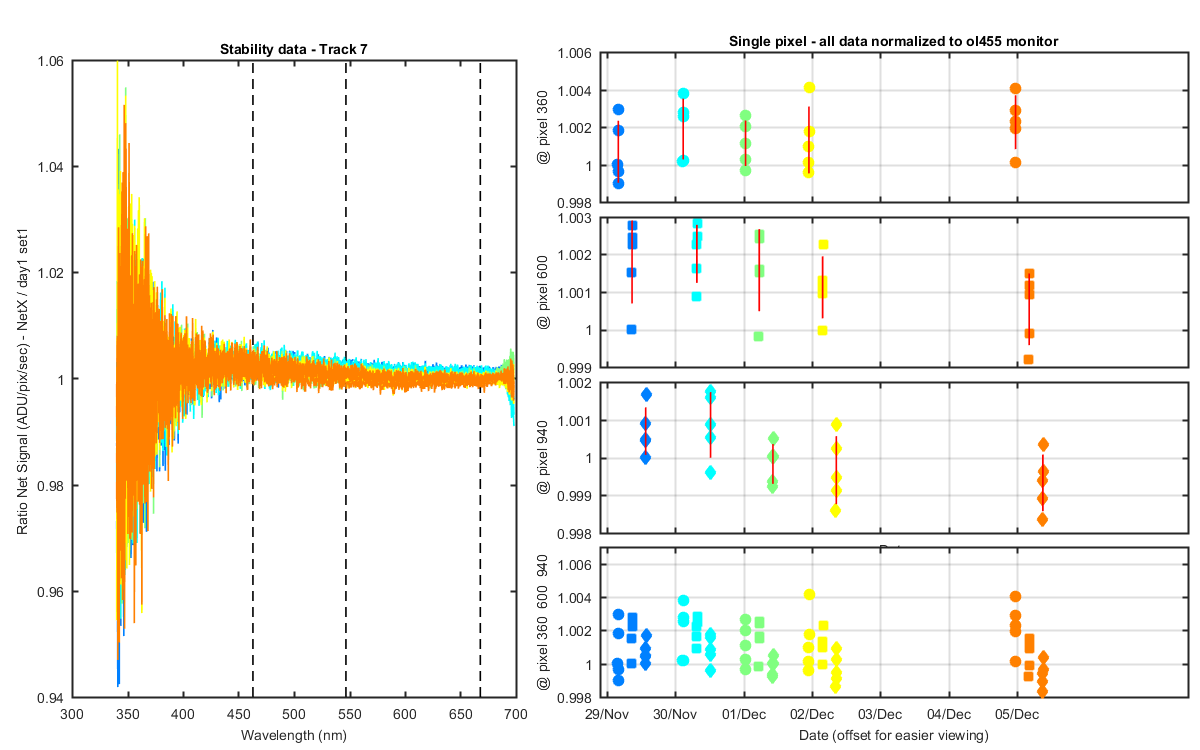
Track 7: showing each of the 5 net light scans ratio (to the day 1 net 1 light) for each days data. Nets are lite-dark divided by int time so units are ADU/pix/sec. The data are normalized to the ol455 monitor data by dividing the net signal by the ol455 data/2.391e-08. The black dashed lines show the pixel locations of the data on the graphs to the right. The right 3 stacked panels shows a single pixel for each dark/day combo. The red line is the standard deviation of the 5 points from each day.
Figure 7
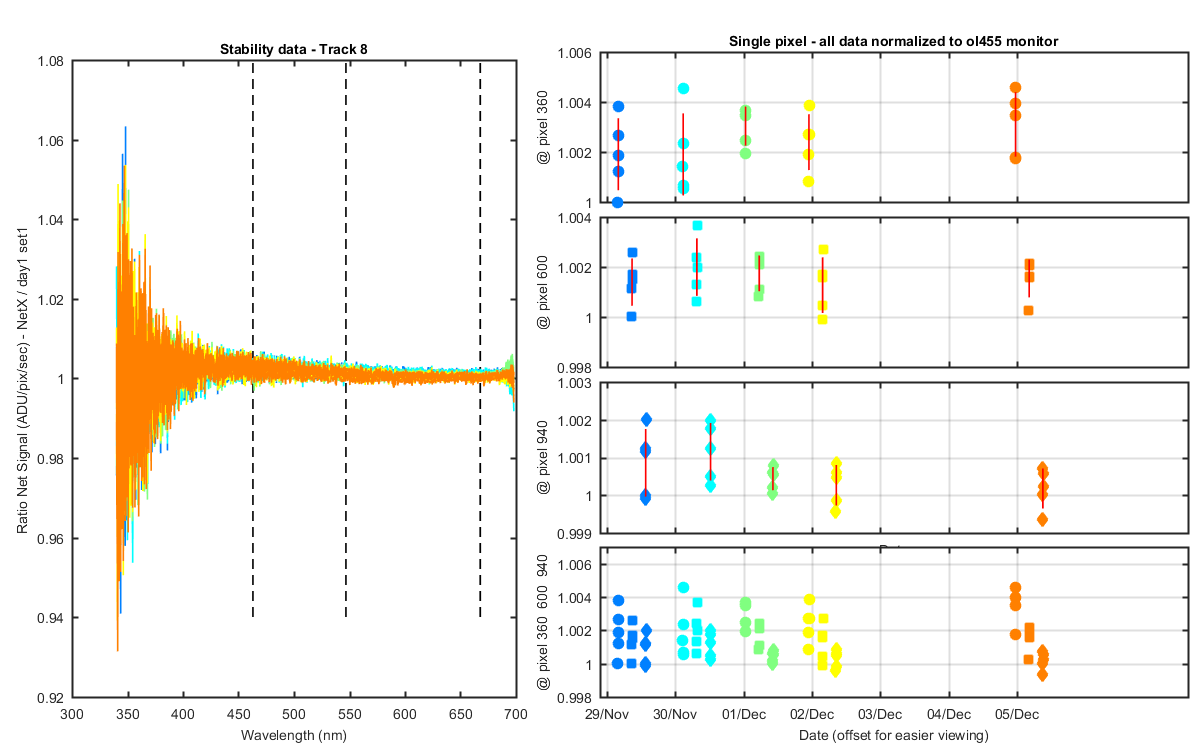
Track 8: showing each of the 5 net light scans ratio (to the day 1 net 1 light) for each days data. Nets are lite-dark divided by int time so units are ADU/pix/sec. The data are normalized to the ol455 monitor data by dividing the net signal by the ol455 data/2.391e-08. The black dashed lines show the pixel locations of the data on the graphs to the right. The right 3 stacked panels shows a single pixel for each dark/day combo. The red line is the standard deviation of the 5 points from each day.
Figure 8
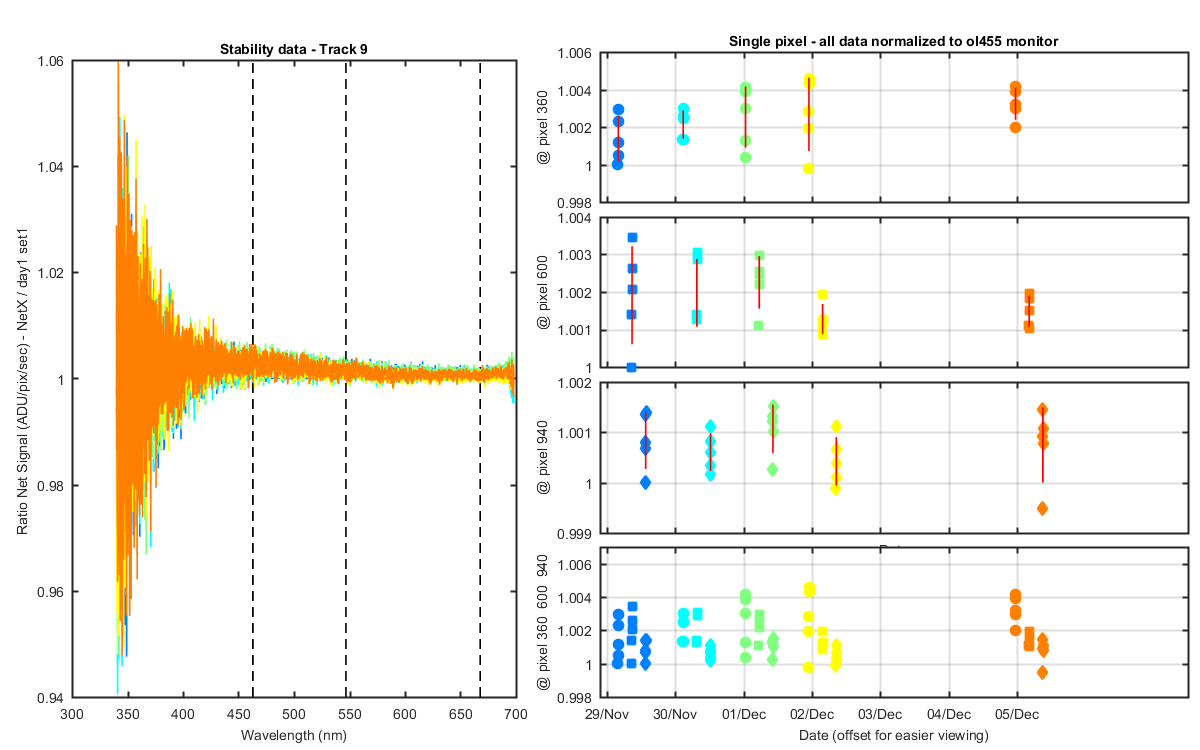
Track 9: showing each of the 5 net light scans ratio (to the day 1 net 1 light) for each days data. Nets are lite-dark divided by int time so units are ADU/pix/sec. The data are normalized to the ol455 monitor data by dividing the net signal by the ol455 data/2.391e-08. The black dashed lines show the pixel locations of the data on the graphs to the right. The right 3 stacked panels shows a single pixel for each dark/day combo. The red line is the standard deviation of the 5 points from each day.
Figure 9
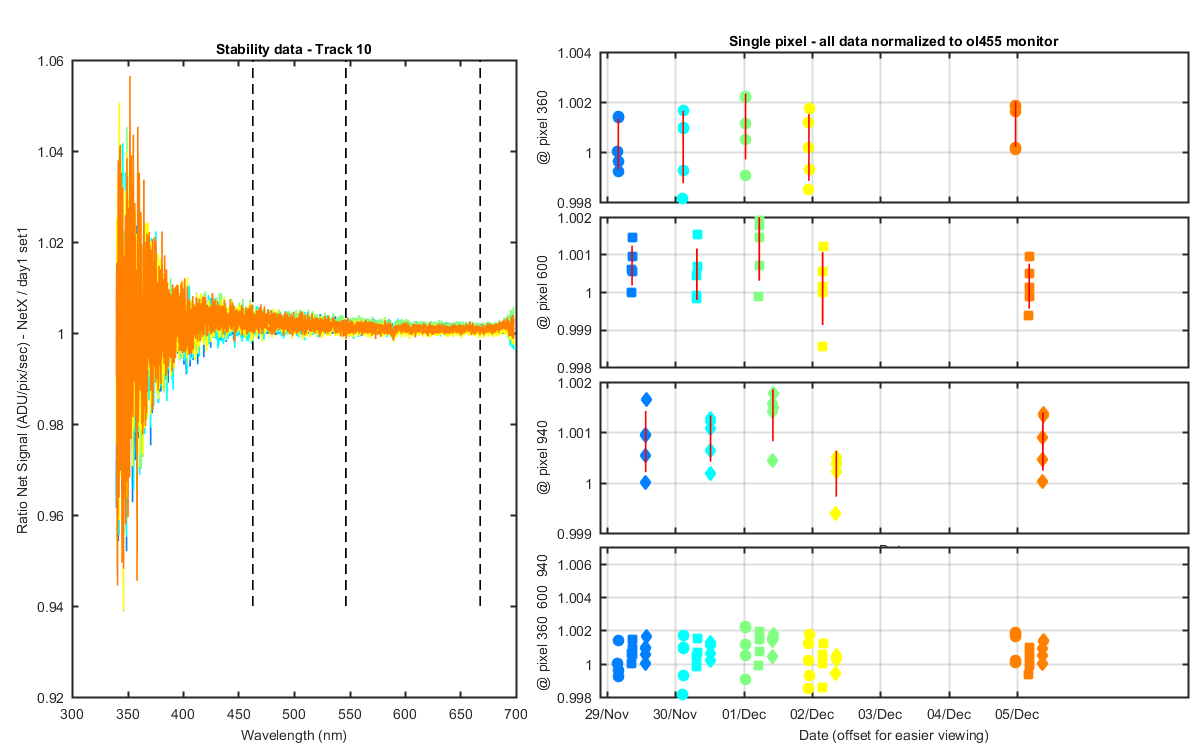
Track 10: showing each of the 5 net light scans ratio (to the day 1 net 1 light) for each days data. Nets are lite-dark divided by int time so units are ADU/pix/sec. The data are normalized to the ol455 monitor data by dividing the net signal by the ol455 data/2.391e-08. The black dashed lines show the pixel locations of the data on the graphs to the right. The right 3 stacked panels shows a single pixel for each dark/day combo. The red line is the standard deviation of the 5 points from each day.
Figure 10
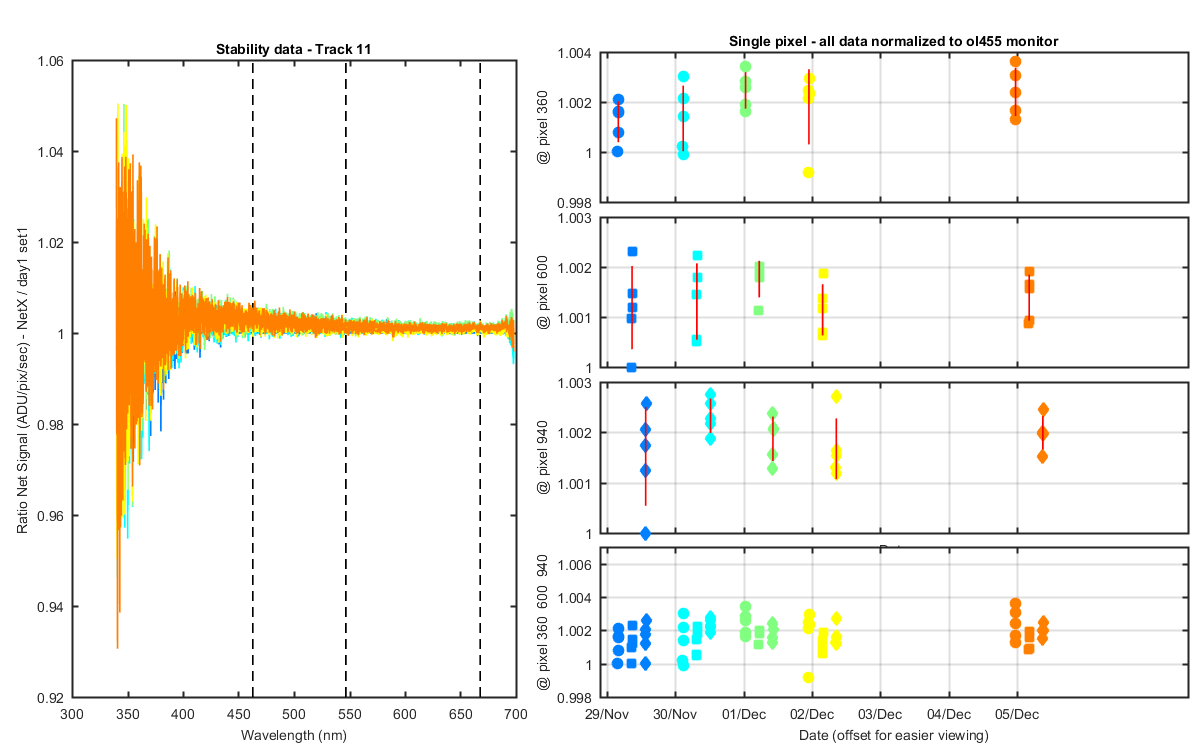
Track 11: showing each of the 5 net light scans ratio (to the day 1 net 1 light) for each days data. Nets are lite-dark divided by int time so units are ADU/pix/sec. The data are normalized to the ol455 monitor data by dividing the net signal by the ol455 data/2.391e-08. The black dashed lines show the pixel locations of the data on the graphs to the right. The right 3 stacked panels shows a single pixel for each dark/day combo. The red line is the standard deviation of the 5 points from each day.
Figure 11
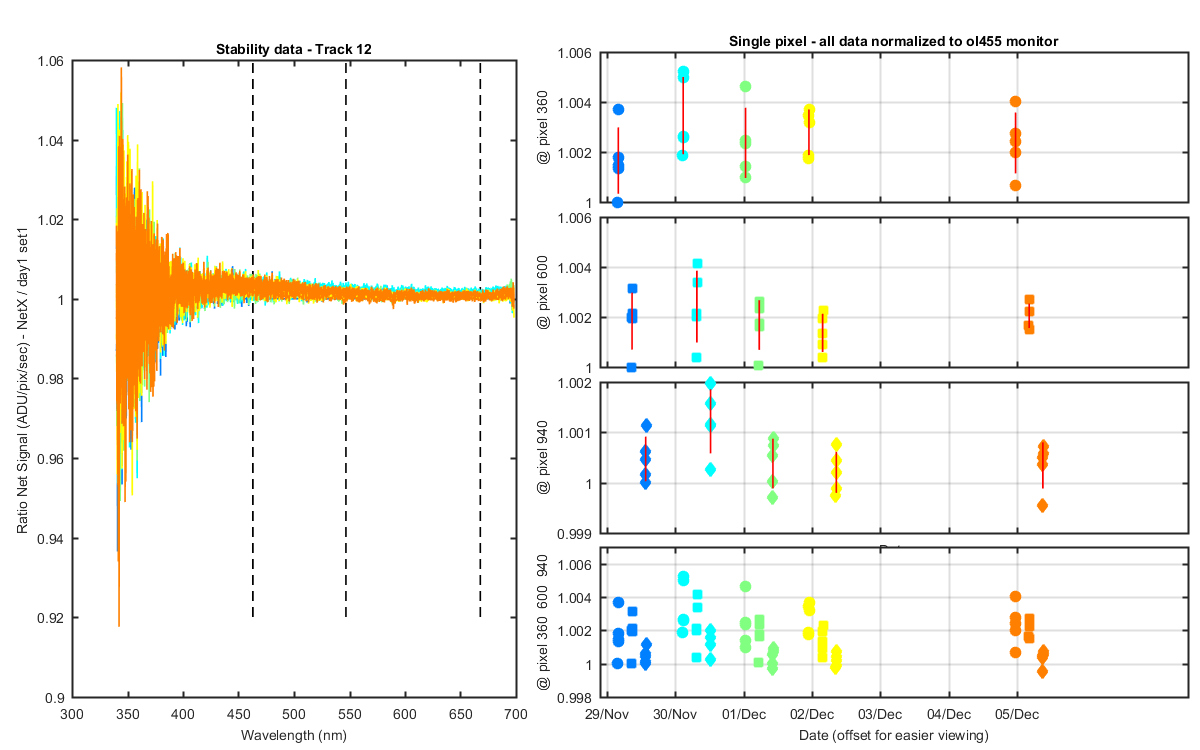
Track 12: showing each of the 5 net light scans ratio (to the day 1 net 1 light) for each days data. Nets are lite-dark divided by int time so units are ADU/pix/sec. The data are normalized to the ol455 monitor data by dividing the net signal by the ol455 data/2.391e-08. The black dashed lines show the pixel locations of the data on the graphs to the right. The right 3 stacked panels shows a single pixel for each dark/day combo. The red line is the standard deviation of the 5 points from each day.
Figure 12
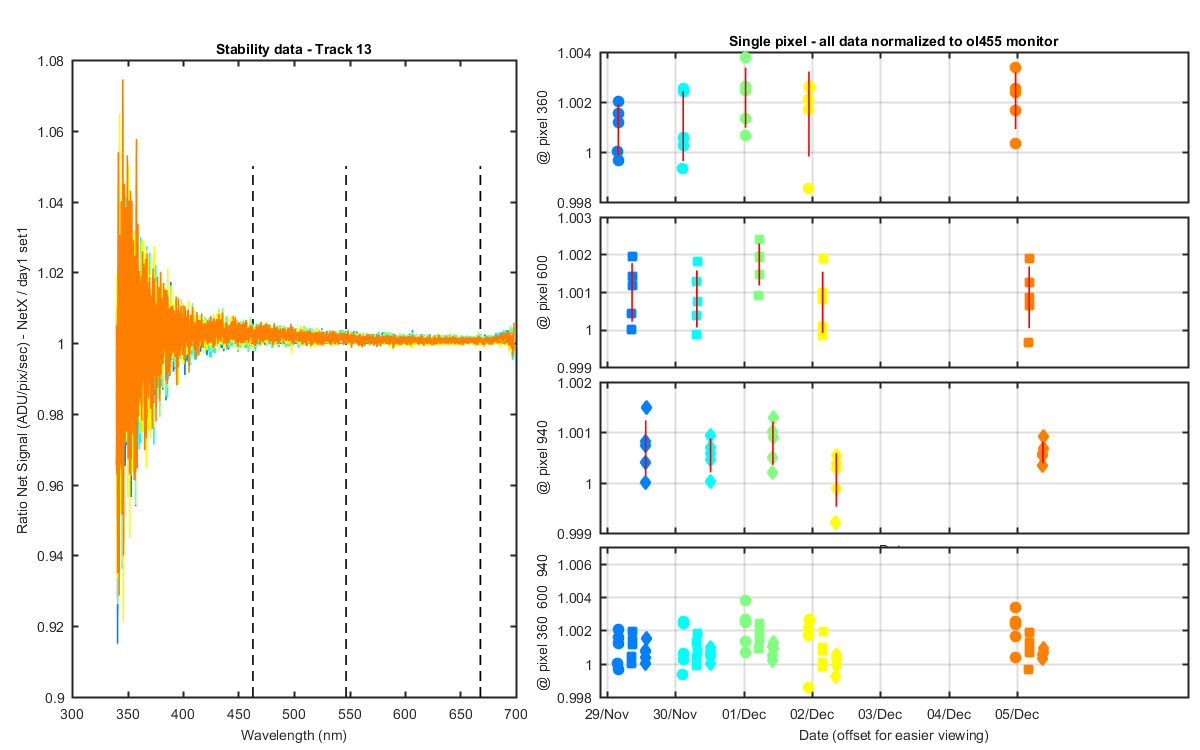
Track 13: showing each of the 5 net light scans ratio (to the day 1 net 1 light) for each days data. Nets are lite-dark divided by int time so units are ADU/pix/sec. The data are normalized to the ol455 monitor data by dividing the net signal by the ol455 data/2.391e-08. The black dashed lines show the pixel locations of the data on the graphs to the right. The right 3 stacked panels shows a single pixel for each dark/day combo. The red line is the standard deviation of the 5 points from each day.
Figure 13
Track 14: showing each of the 5 net light scans ratio (to the day 1 net 1 light) for each days data. Nets are lite-dark divided by int time so units are ADU/pix/sec. The data are normalized to the ol455 monitor data by dividing the net signal by the ol455 data/2.391e-08. The black dashed lines show the pixel locations of the data on the graphs to the right. The right 3 stacked panels shows a single pixel for each dark/day combo. The red line is the standard deviation of the 5 points from each day.
Figure 14
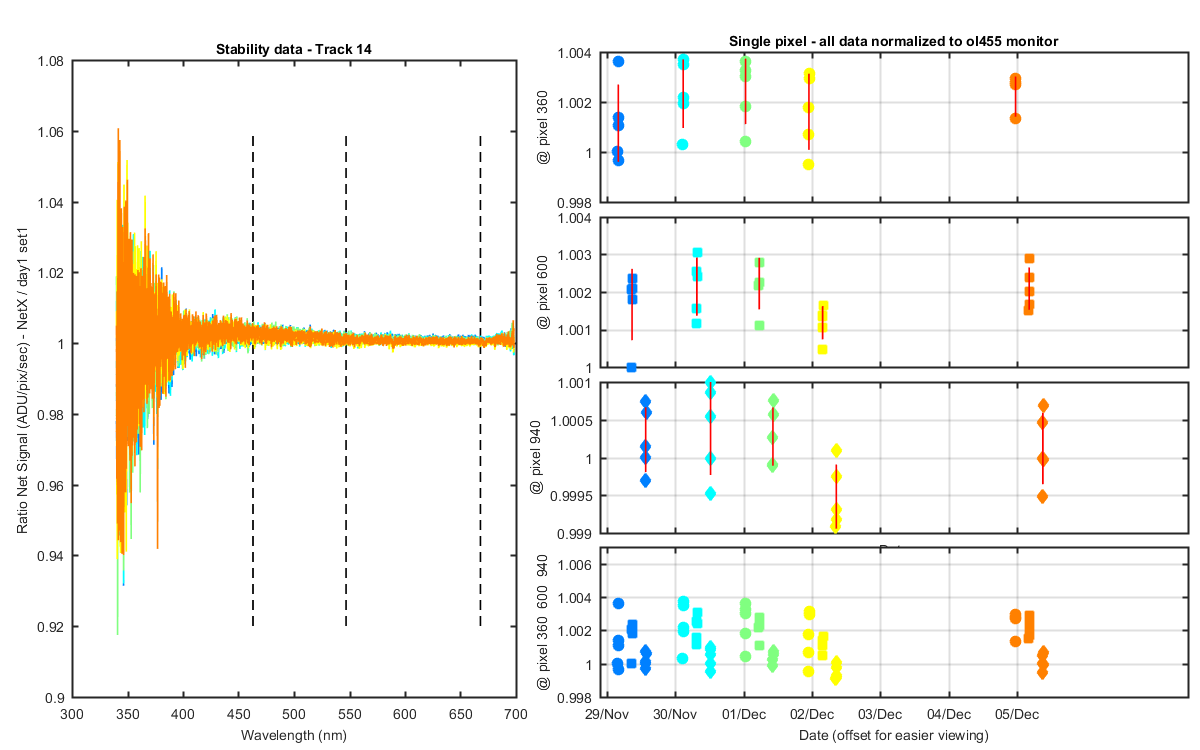
Figure 15