REVISION DATE: 01-Feb-2019 09:41:10
The Blue spec data DO NOT show the issue I found. TO see the issue please go look at the Red spec data.
Mike said "Did you notice that: all the RS net data are negative, Trk#6 below ~ 524 nm, Trk#9 below ~535 nm... So I created the graphs below. FYI: Day 1- 4 (10_jan to 15 Jan) are track 6 and the last 4 days are using track 9 at a lower lamp level. Track 9 is probably lower because the lamp was at a lower level.
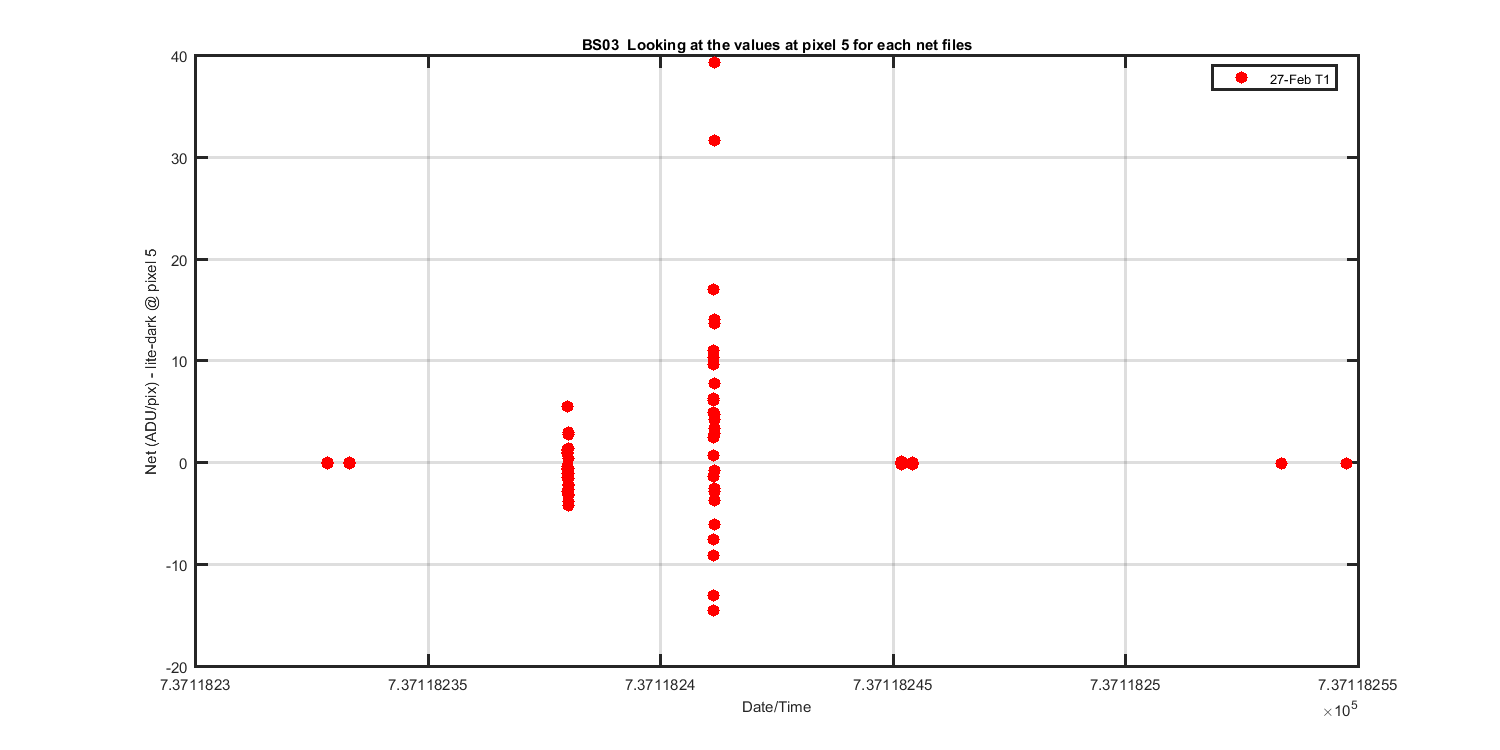
Figure 1 : Shows the pixel 5 values for each net for each days and experiment. Each dot is a net from each dataset collected on each day.
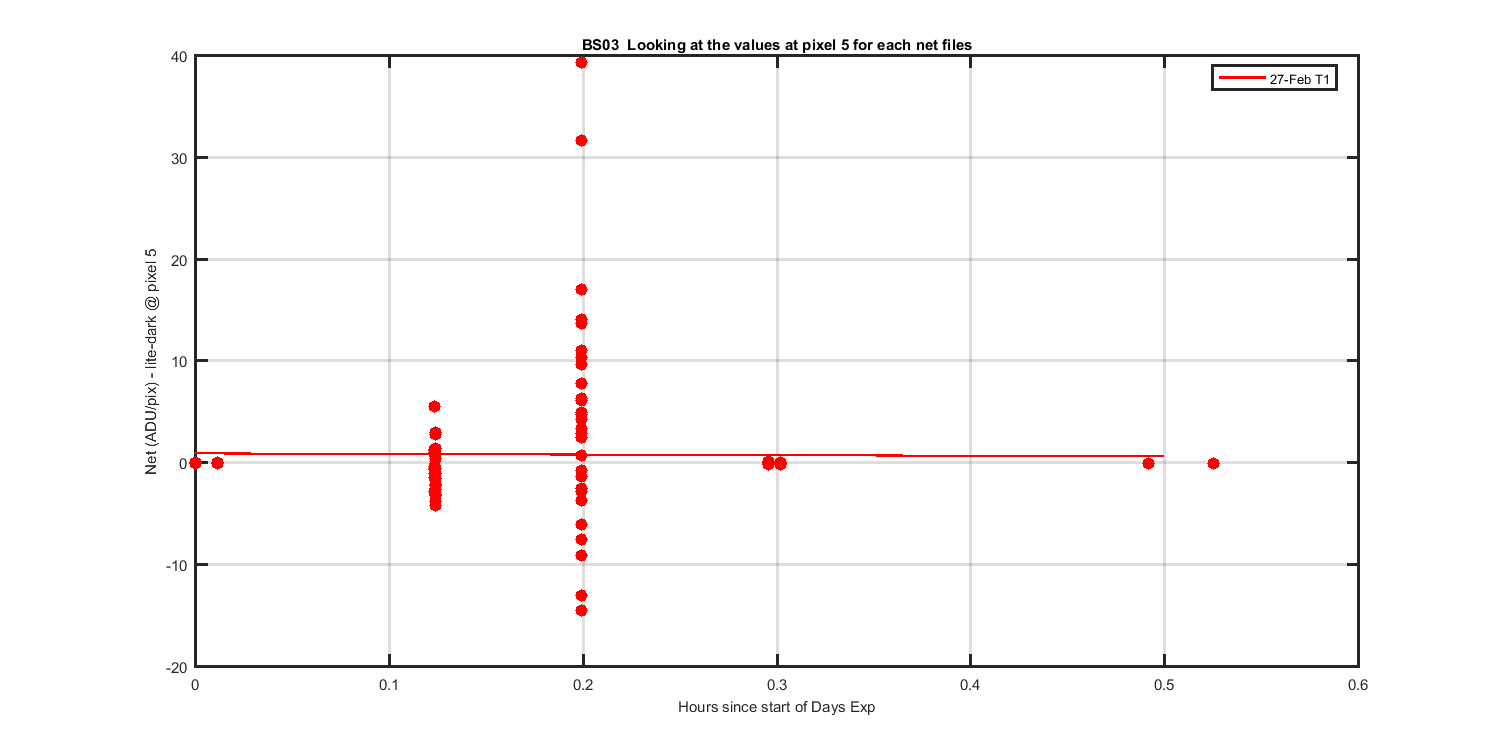
Figure 2 : Shows the pixel 5 values for each net for each days and experiment. Each dot is a net from each dataset collected on each day.
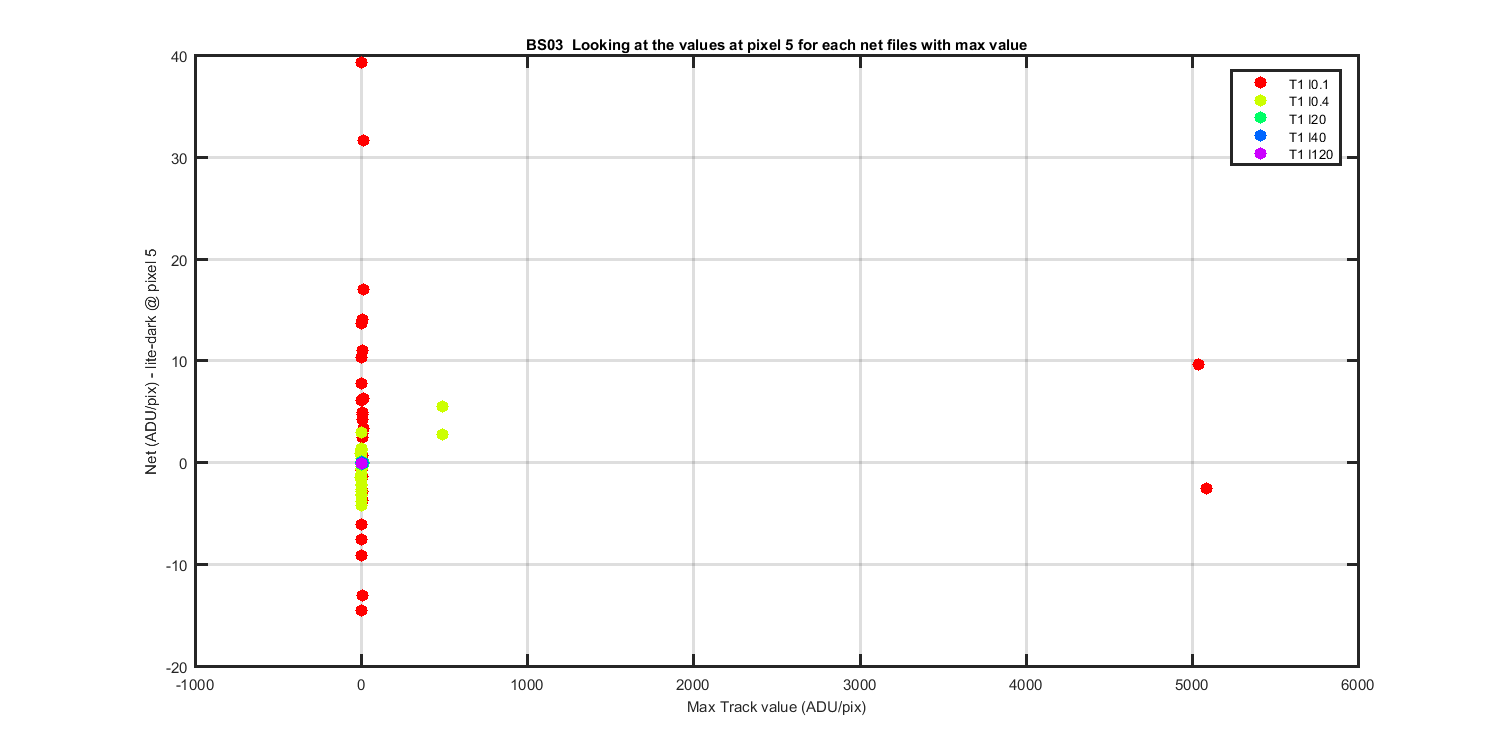
Figure 3 : Shows the pixel 5 values for each net for each days and experiment. Each dot is a net from each dataset collected on each day.
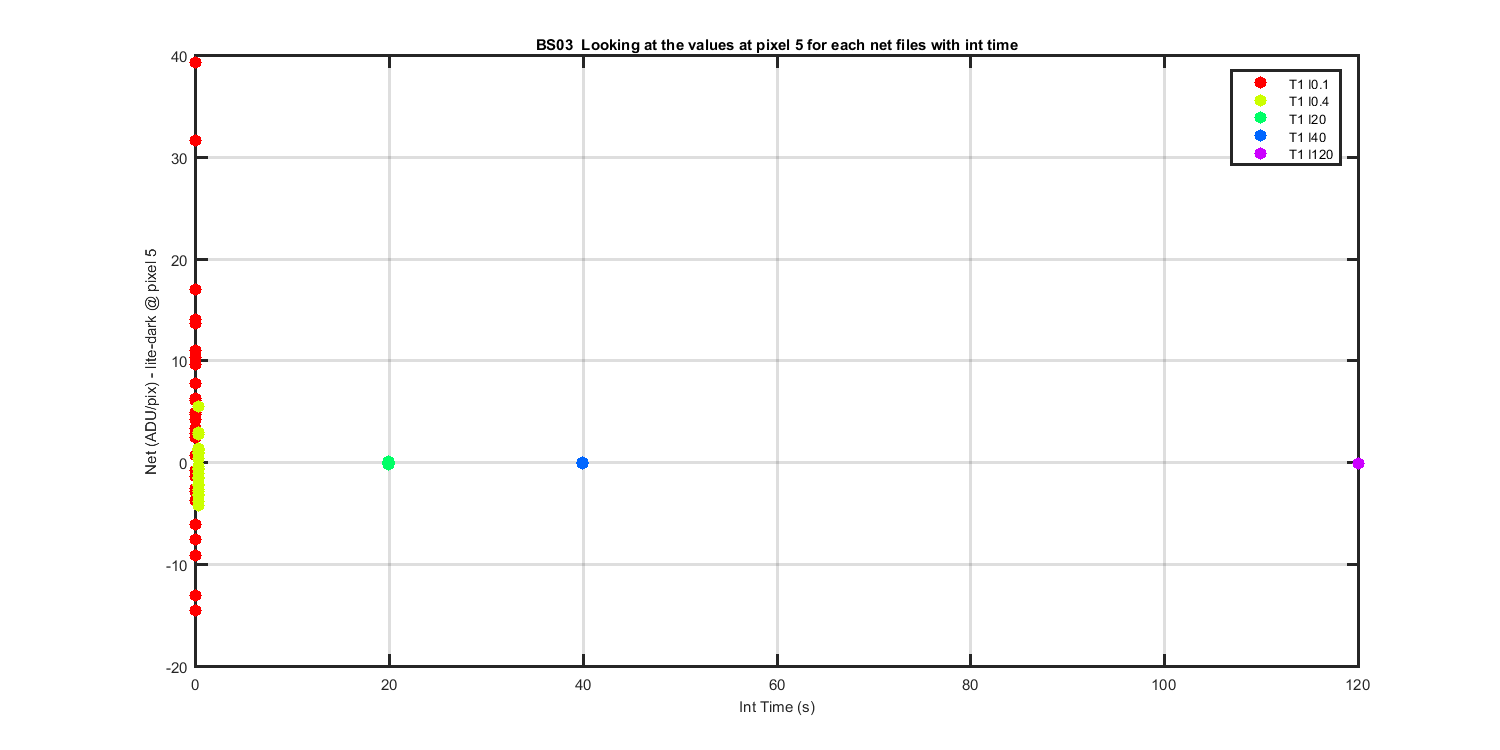
Figure 4 : Shows the pixel 5 values for each net for each days and experiment. Each dot is a net from each dataset collected on each day.
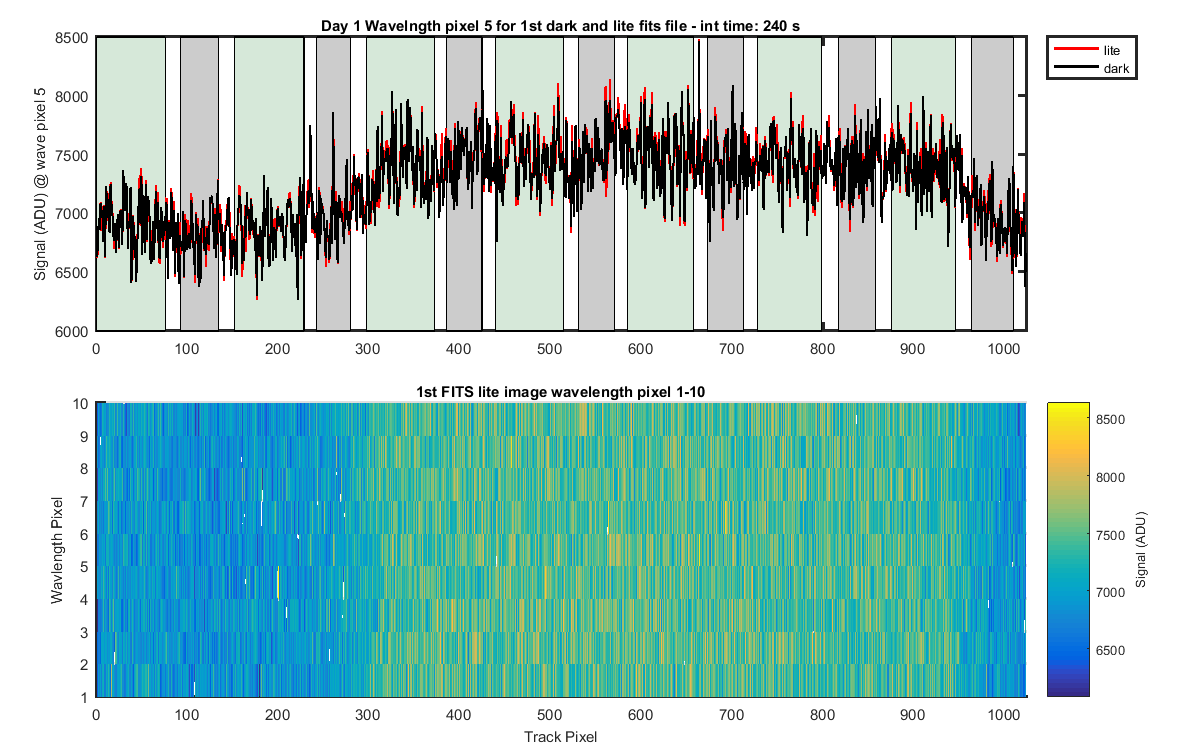
Figure 5 : The top panel shows the cross track values at pixel 5. THis would be wavelength pixel 5 so the line goes across the tracks. The bottom panels is a cutout of one (the first) full fits image file (fits file _001). I pulled out the first 10 pixels (wavelength) the tracks go left to right, wavelength up to down.
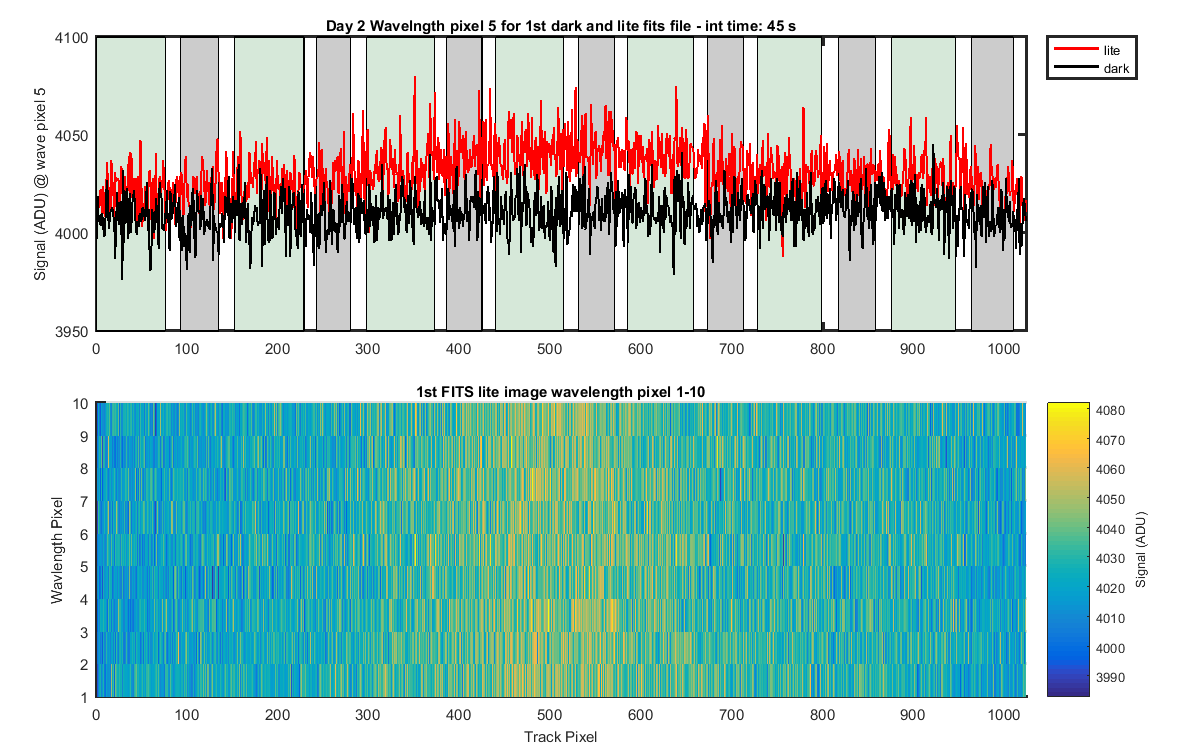
Figure 6 : The top panel shows the cross track values at pixel 5. THis would be wavelength pixel 5 so the line goes across the tracks. The bottom panels is a cutout of one (the first) full fits image file (fits file _001). I pulled out the first 10 pixels (wavelength) the tracks go left to right, wavelength up to down.
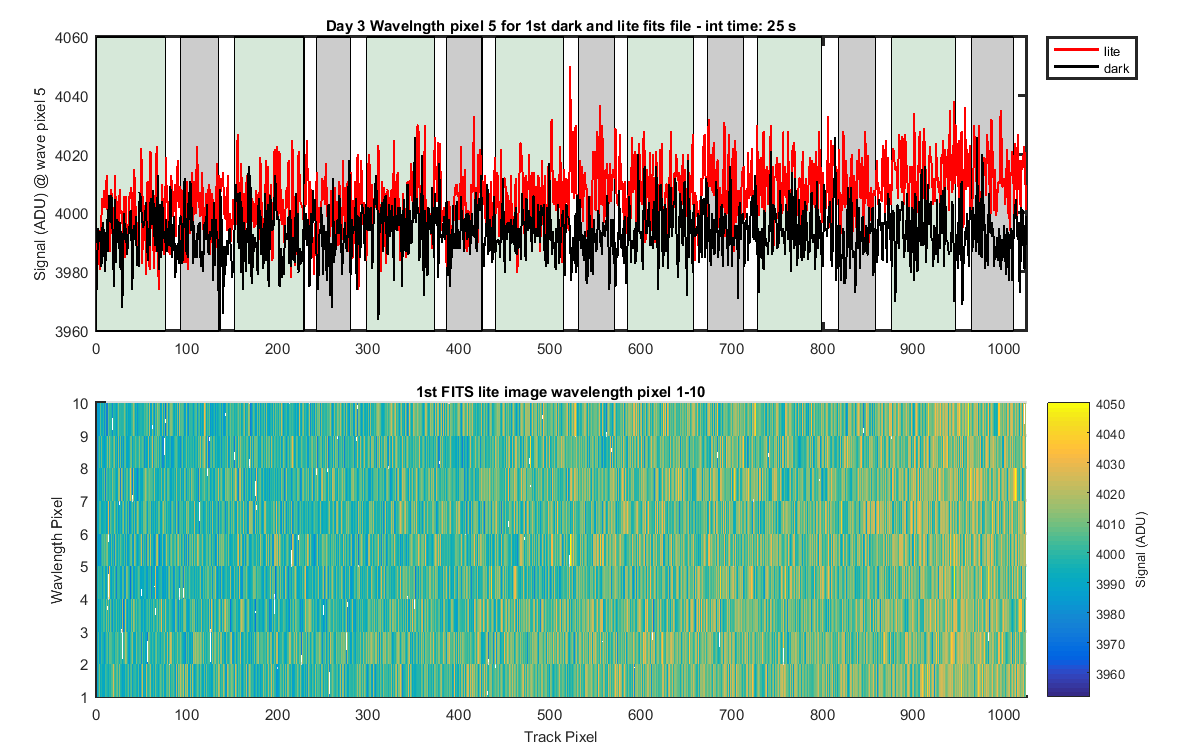
Figure 7 : The top panel shows the cross track values at pixel 5. THis would be wavelength pixel 5 so the line goes across the tracks. The bottom panels is a cutout of one (the first) full fits image file (fits file _001). I pulled out the first 10 pixels (wavelength) the tracks go left to right, wavelength up to down.
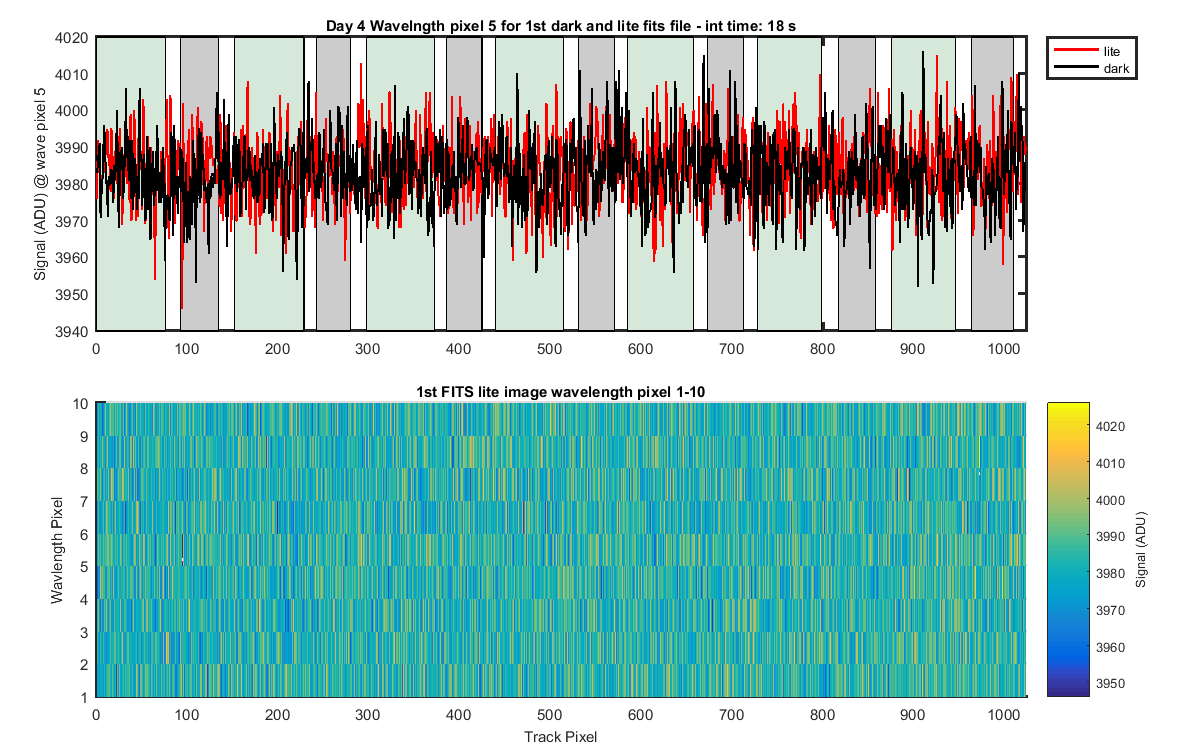
Figure 8 : The top panel shows the cross track values at pixel 5. THis would be wavelength pixel 5 so the line goes across the tracks. The bottom panels is a cutout of one (the first) full fits image file (fits file _001). I pulled out the first 10 pixels (wavelength) the tracks go left to right, wavelength up to down.
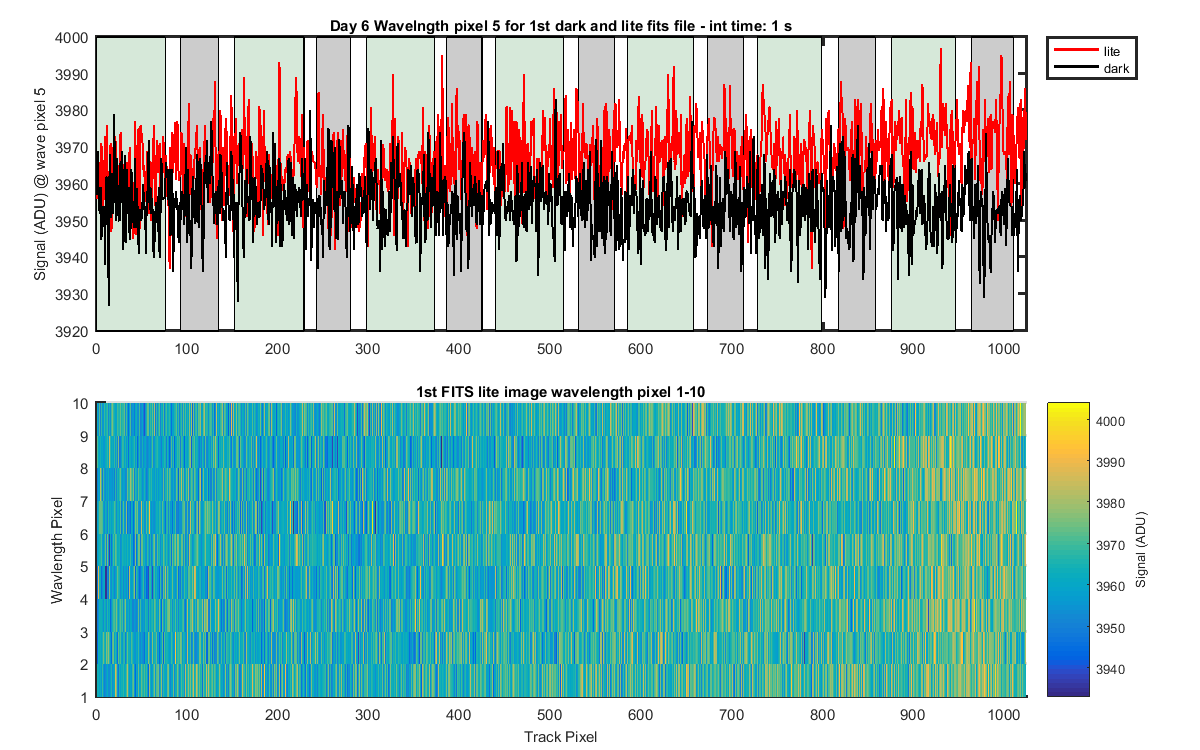
Figure 9 : The top panel shows the cross track values at pixel 5. THis would be wavelength pixel 5 so the line goes across the tracks. The bottom panels is a cutout of one (the first) full fits image file (fits file _001). I pulled out the first 10 pixels (wavelength) the tracks go left to right, wavelength up to down.
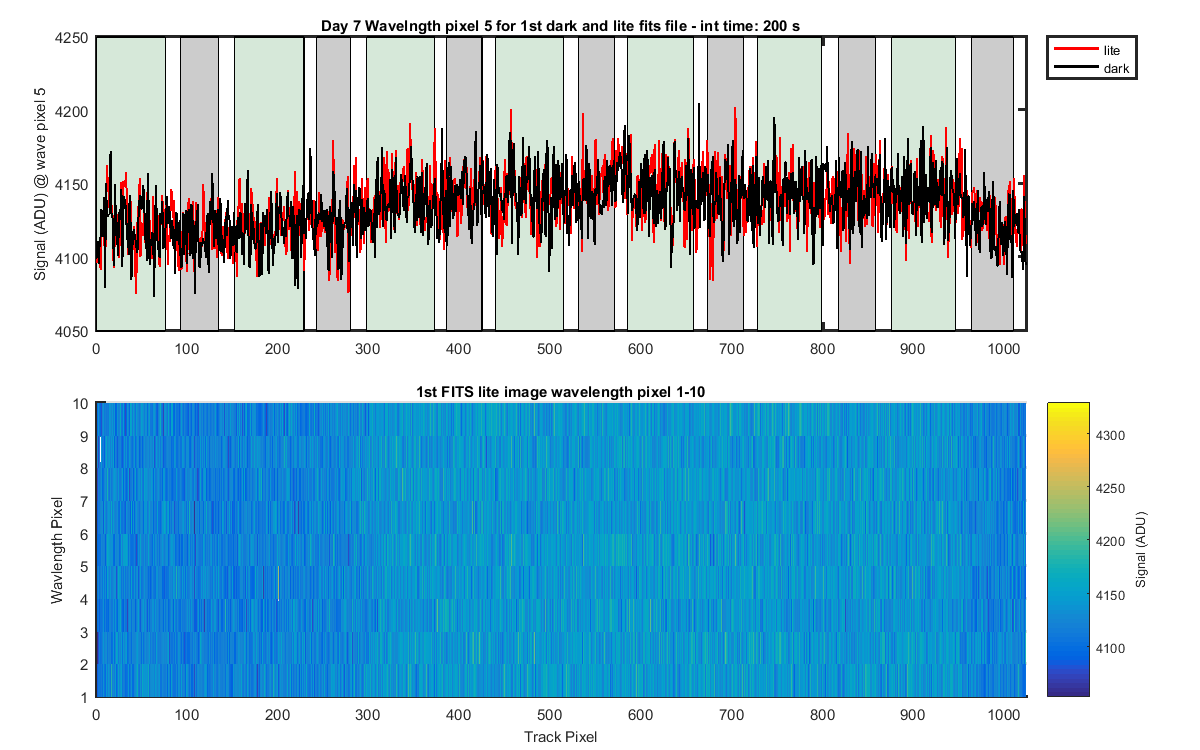
Figure 10 : The top panel shows the cross track values at pixel 5. THis would be wavelength pixel 5 so the line goes across the tracks. The bottom panels is a cutout of one (the first) full fits image file (fits file _001). I pulled out the first 10 pixels (wavelength) the tracks go left to right, wavelength up to down.
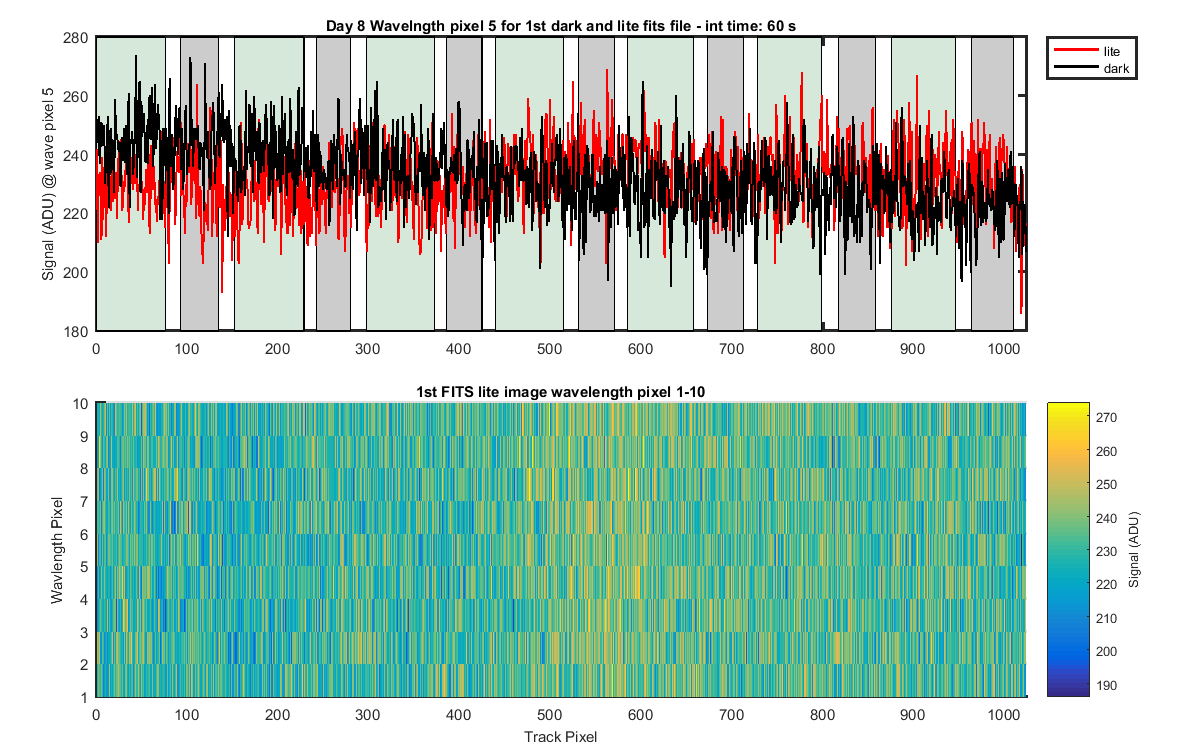
Figure 11 : The top panel shows the cross track values at pixel 5. THis would be wavelength pixel 5 so the line goes across the tracks. The bottom panels is a cutout of one (the first) full fits image file (fits file _001). I pulled out the first 10 pixels (wavelength) the tracks go left to right, wavelength up to down.
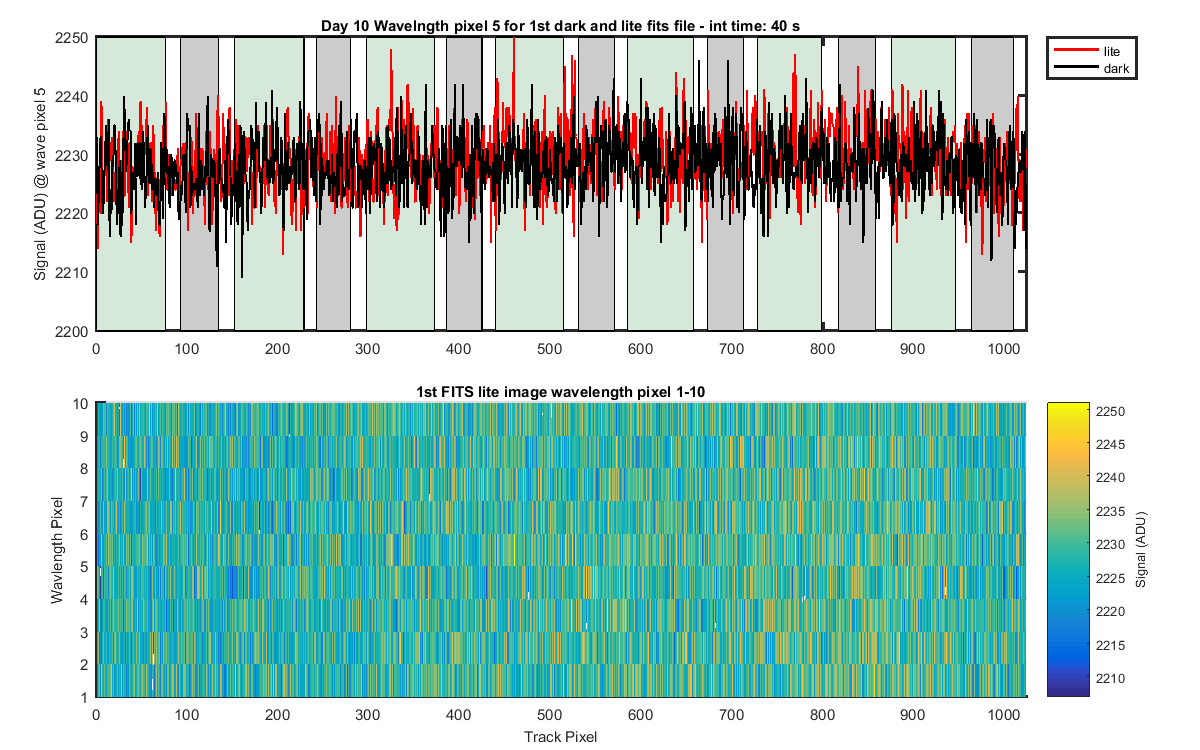
Figure 12 : The top panel shows the cross track values at pixel 5. THis would be wavelength pixel 5 so the line goes across the tracks. The bottom panels is a cutout of one (the first) full fits image file (fits file _001). I pulled out the first 10 pixels (wavelength) the tracks go left to right, wavelength up to down.
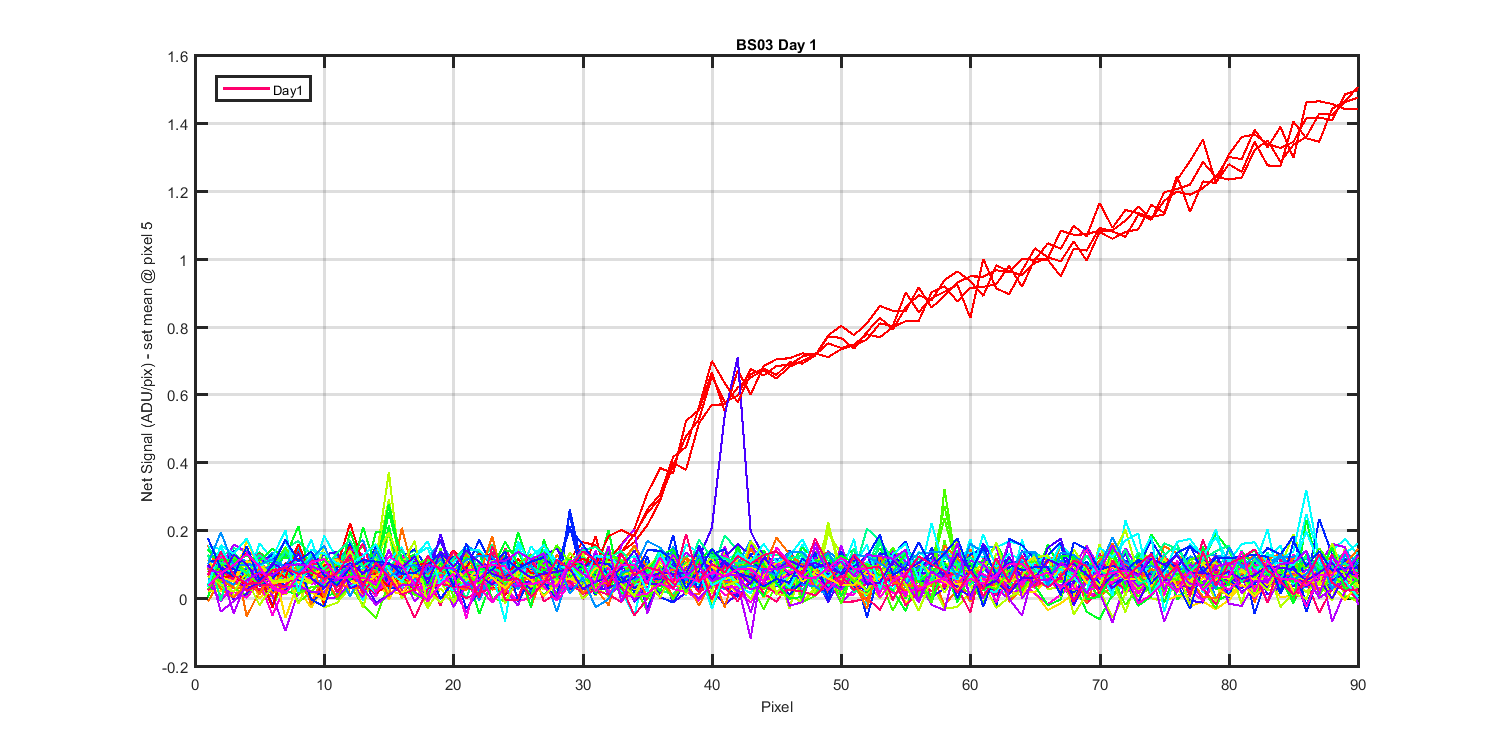
Figure 13 : Shows the mean dark and lite for each data set.
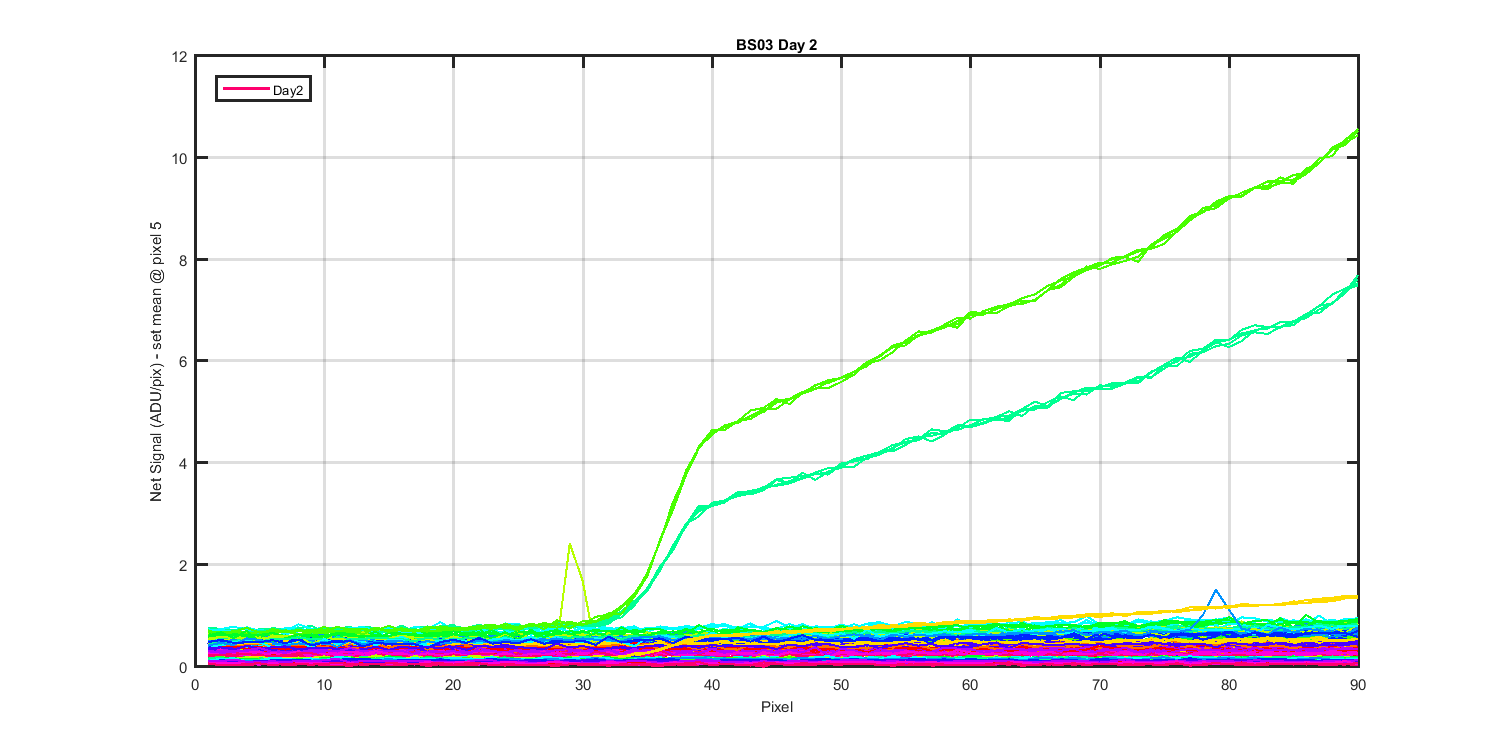
Figure 14 : Shows the mean dark and lite for each data set.
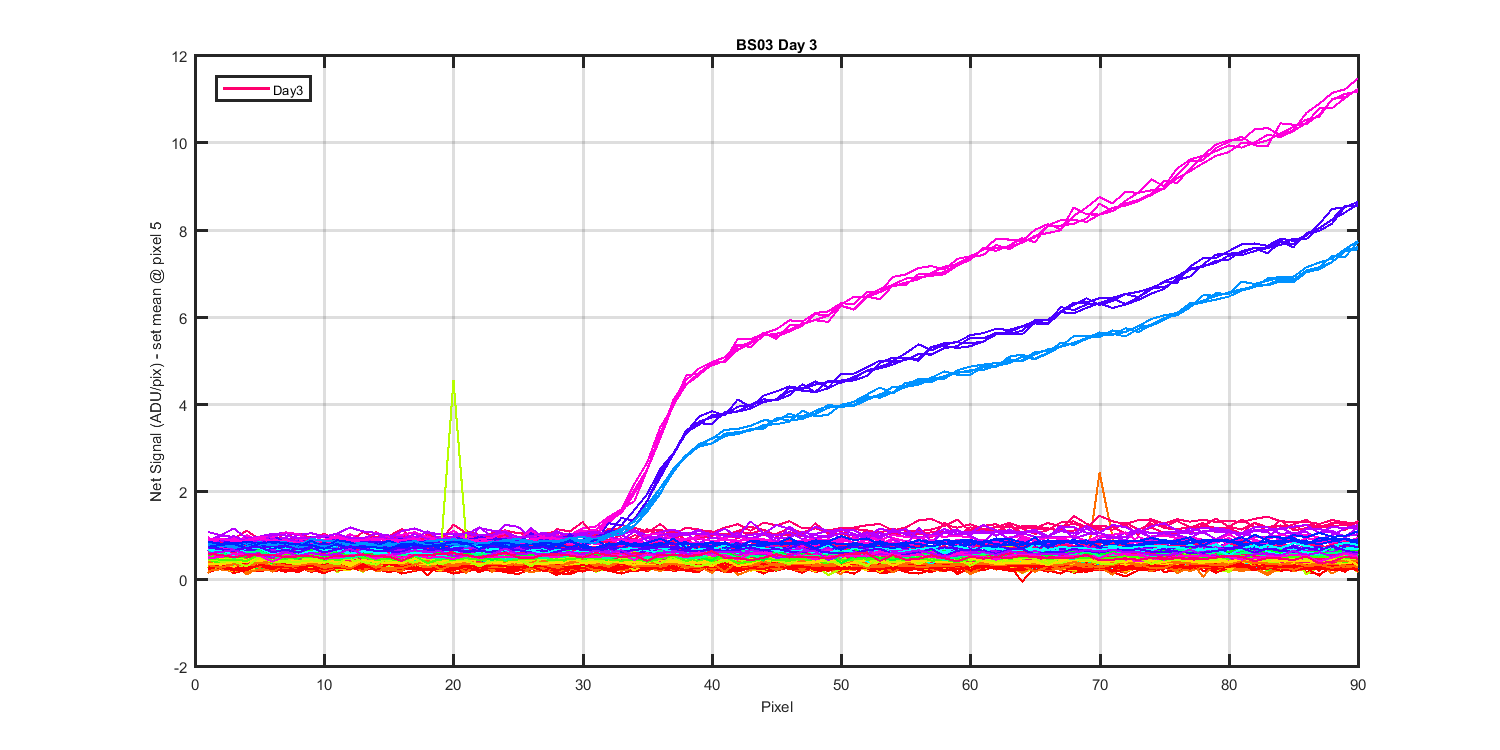
Figure 15 : Shows the mean dark and lite for each data set.
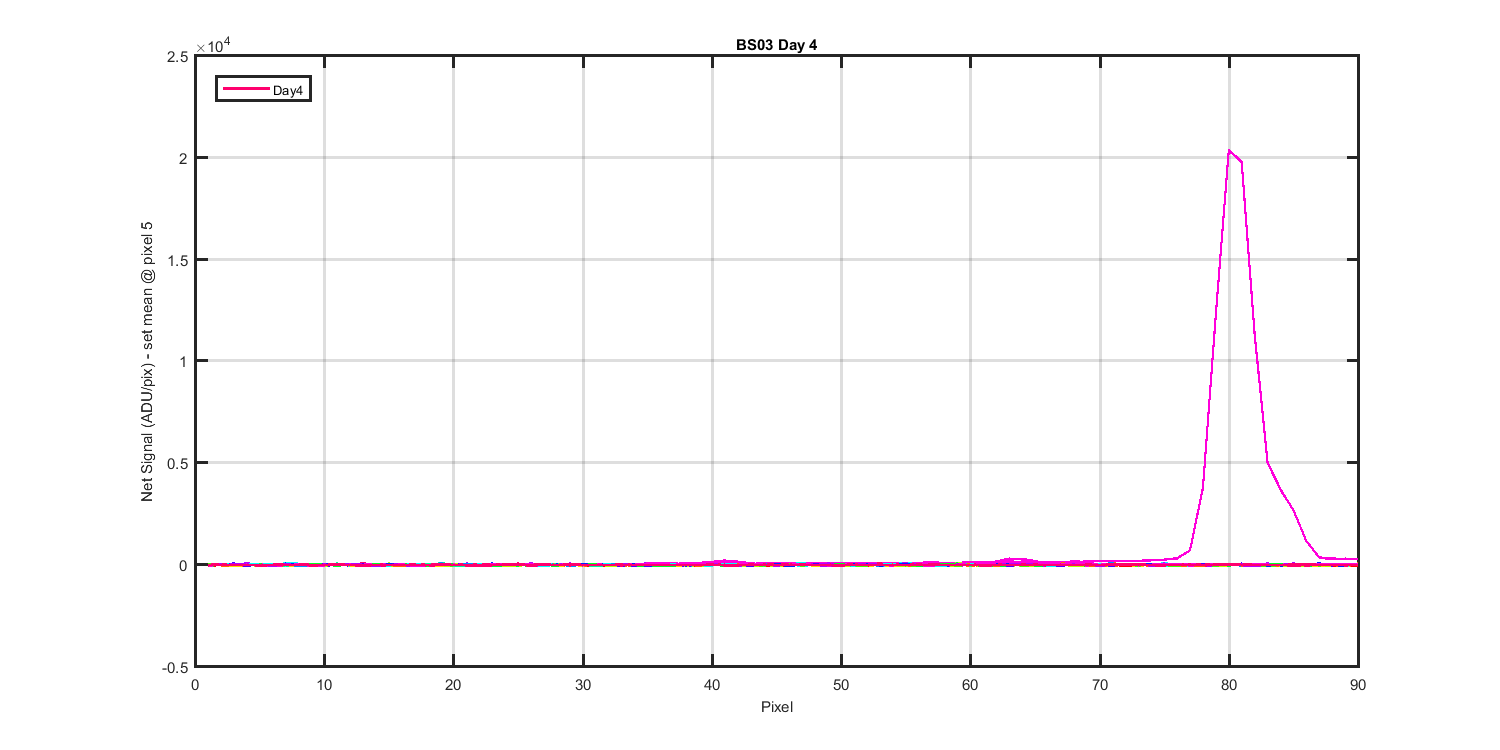
Figure 16 : Shows the mean dark and lite for each data set.
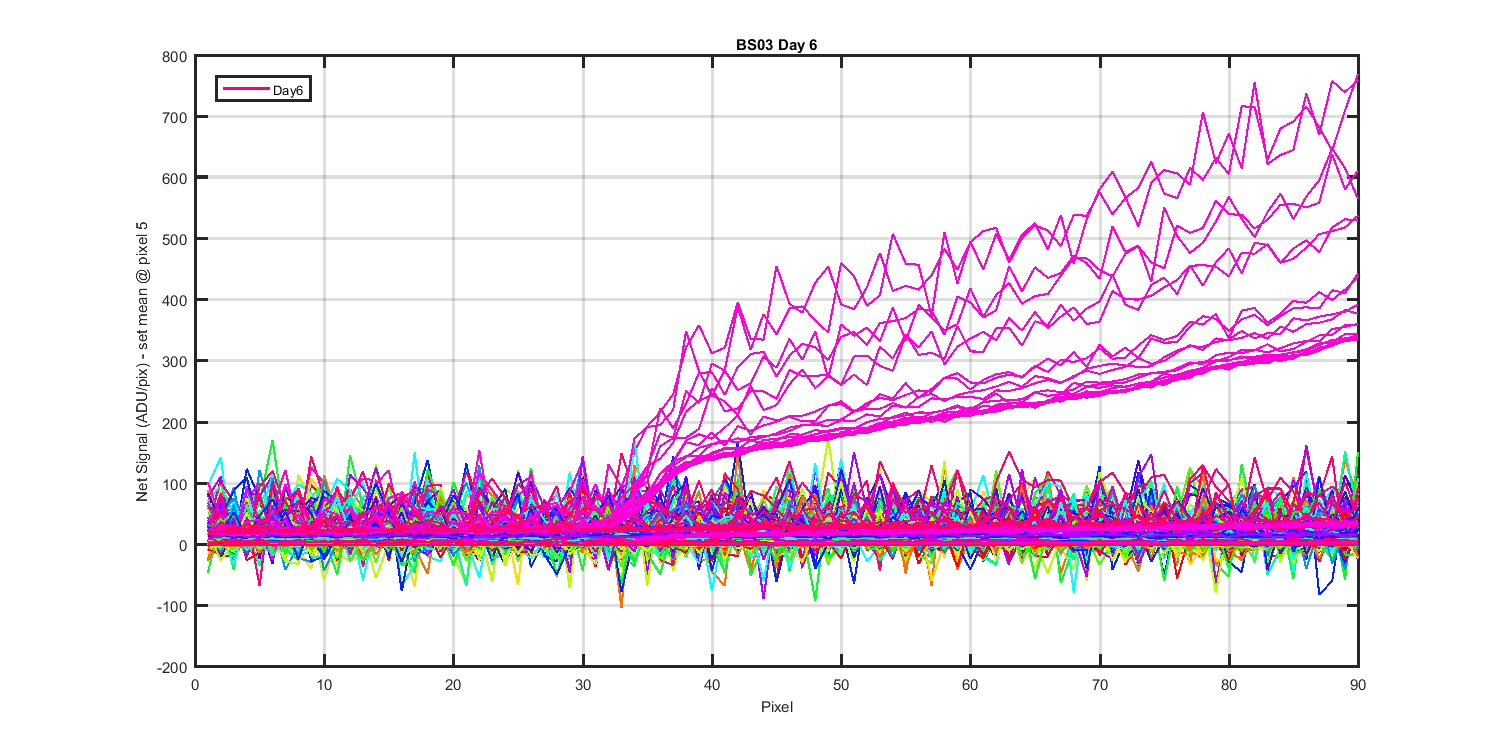
Figure 17 : Shows the mean dark and lite for each data set.
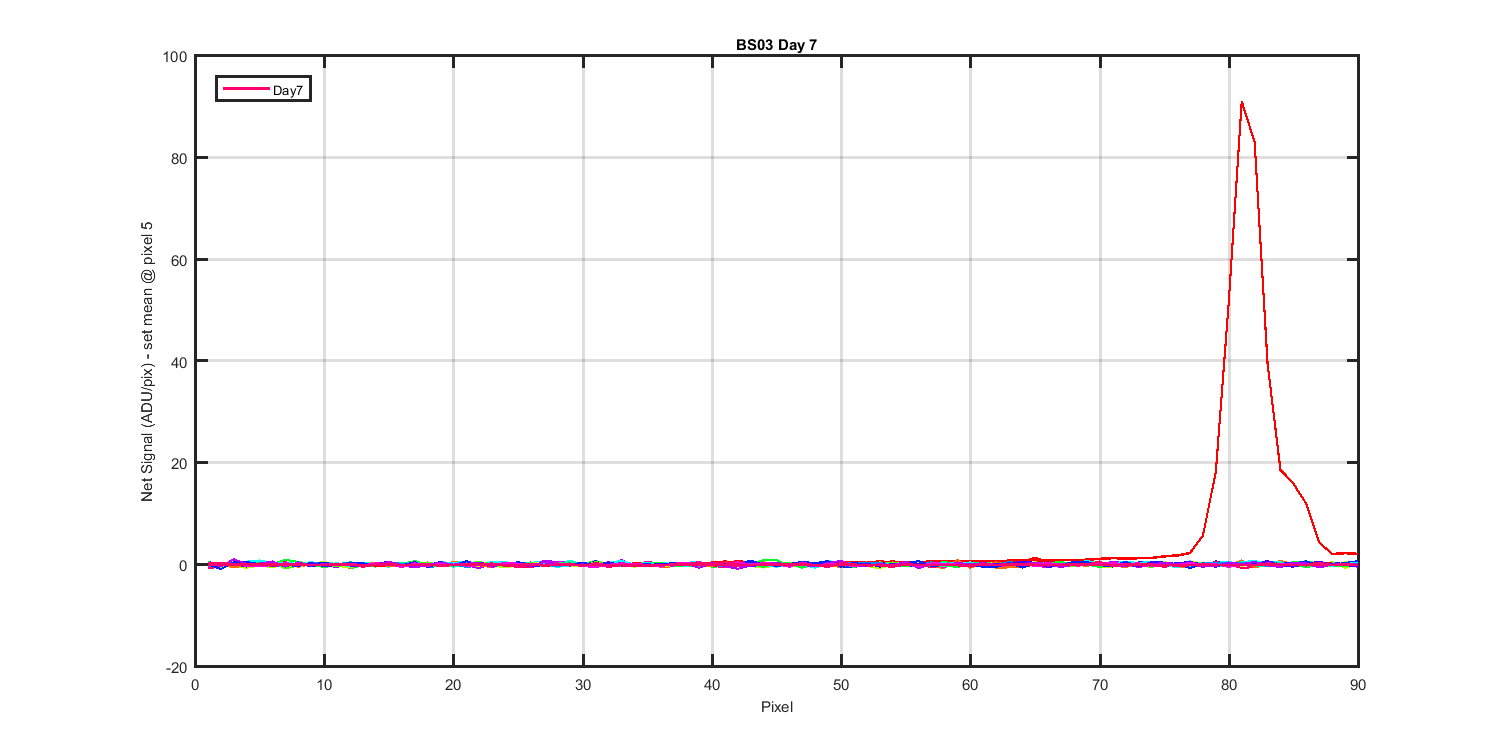
Figure 18 : Shows the mean dark and lite for each data set.
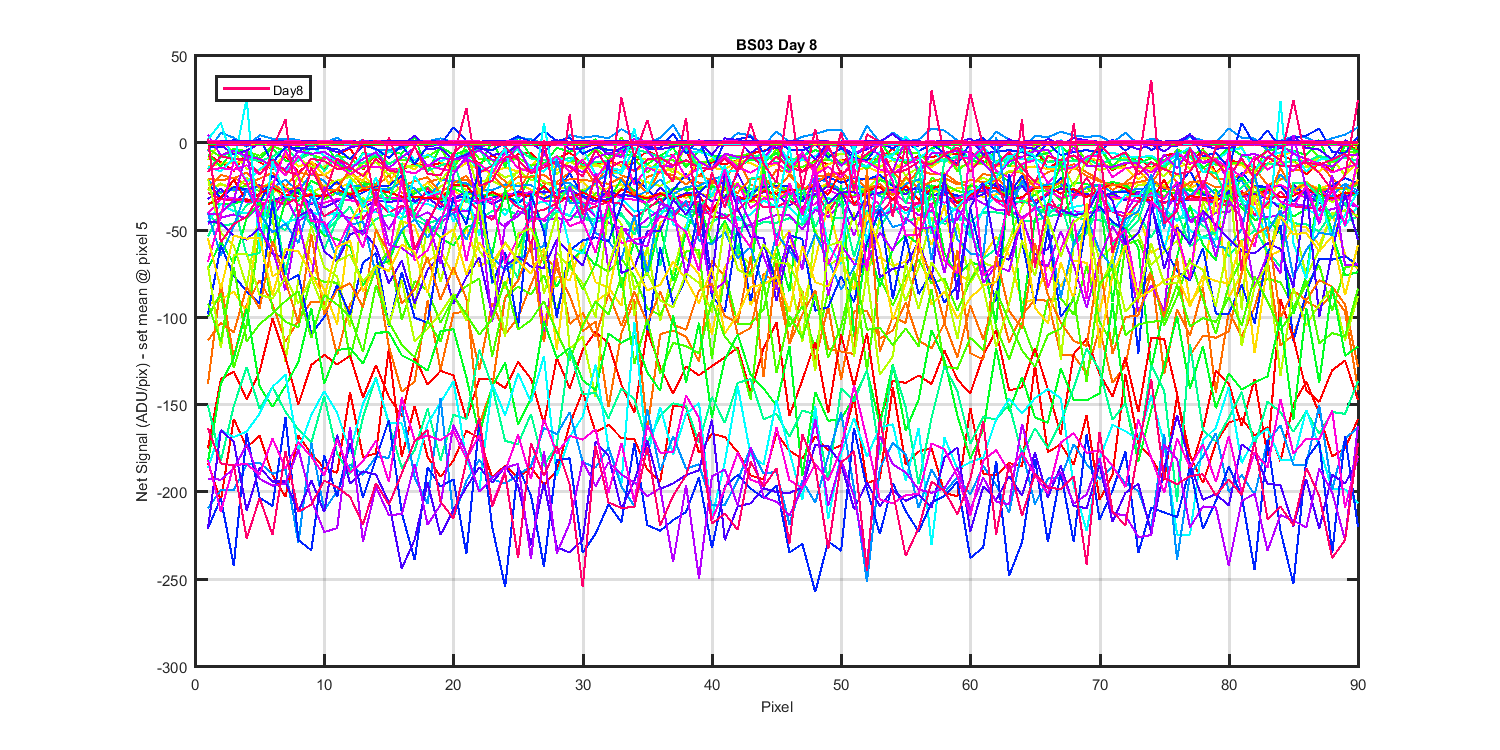
Figure 19 : Shows the mean dark and lite for each data set.
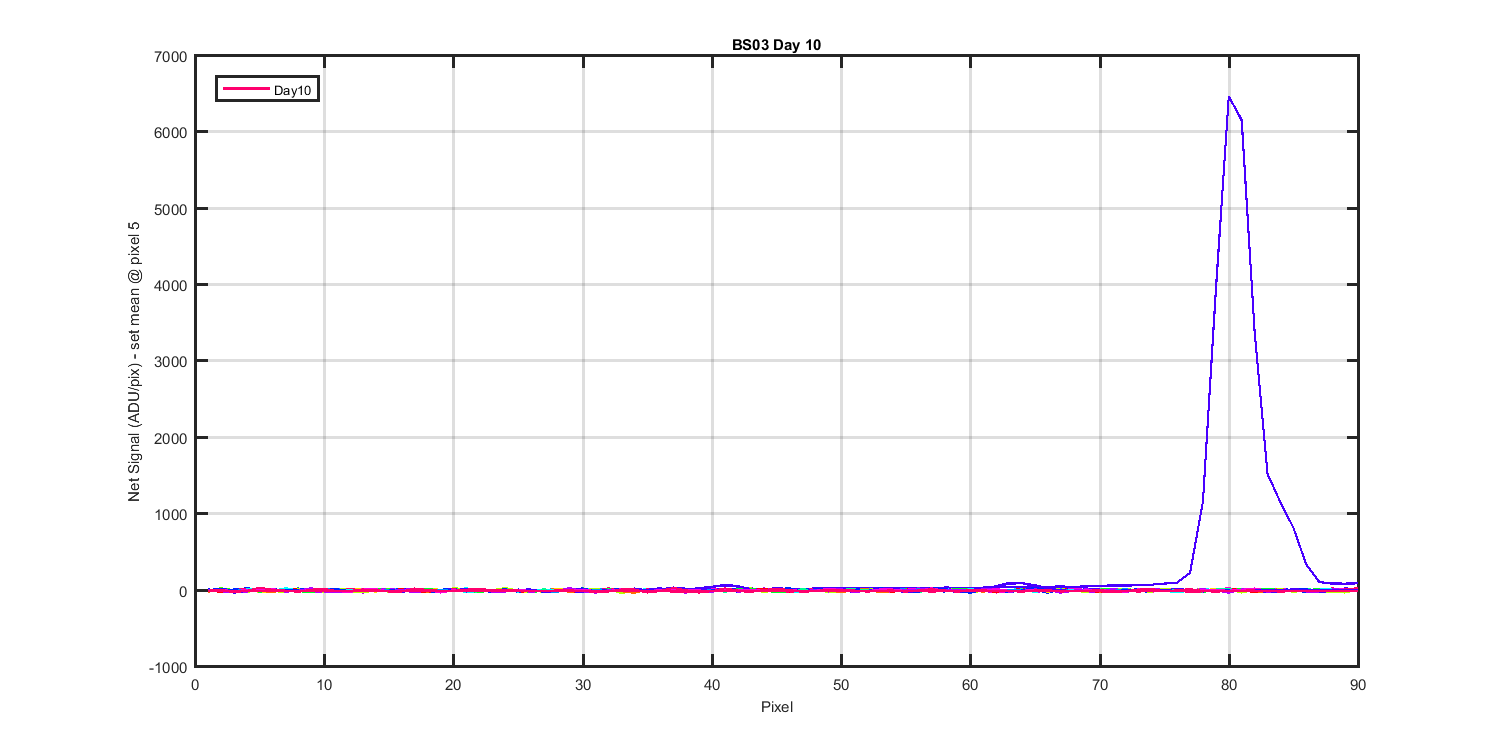
Figure 20 : Shows the mean dark and lite for each data set.