REVISION DATE: 18-Apr-2019 11:30:59
Before system responses Mike tries to balance the Es and Lu channels for the BSG and RSG so that they can all be collected at the same time. Also Ken would like integration times of 10 secs or more. So the graphs below show the Es and Lu data from the cal lamp before any balancing. And then I look at the nuetral density filters Mike wants to use and apply those to the Es and Lu tracks to see what combination gets them on the same level and at 10 seconds.
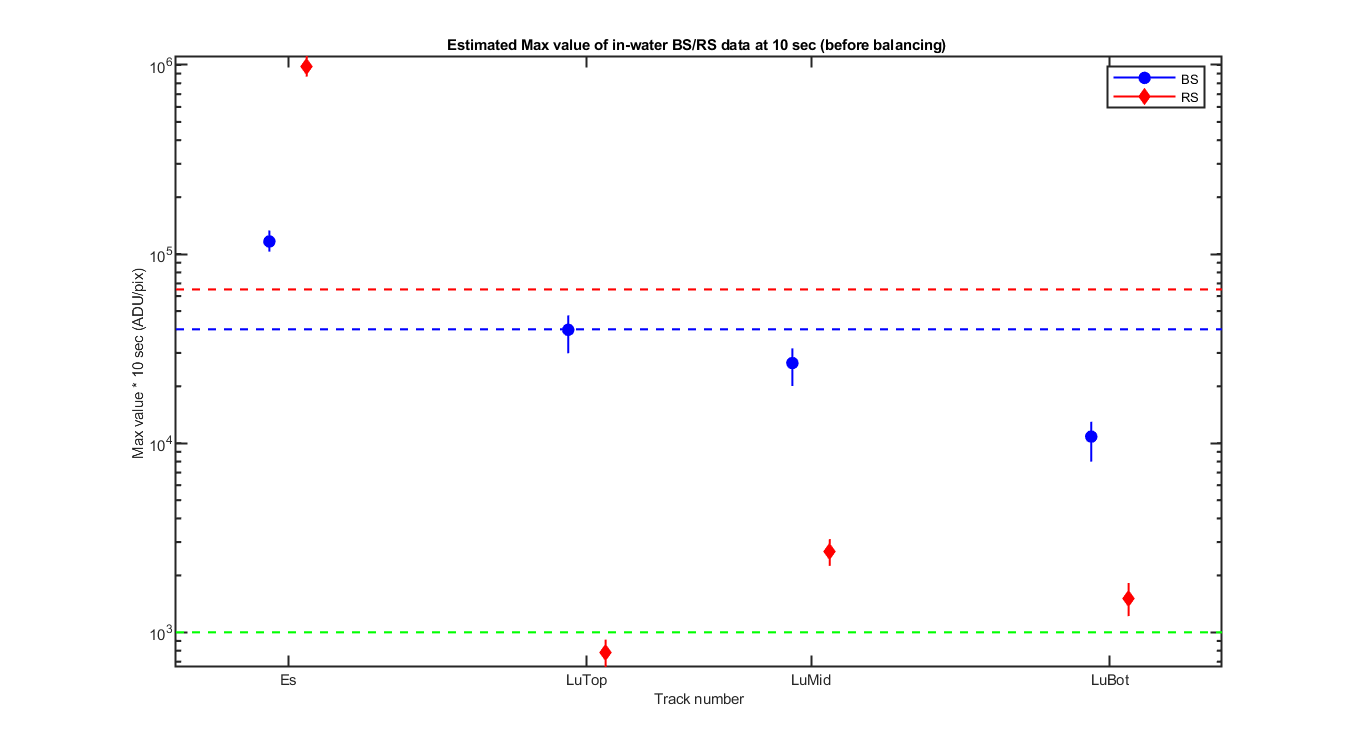
Figure 1 A graph of the estimated signal levels (ADU/pix) at a 10 second integration time before any balancing. blue circles are the BSG and red diamonds are RSB. The vertical lines show the min and max values for the M266 in-water data used to calculate the estimate. red dsahed line is 65000 ADU/pix, blue dashed line is 40000 ADU/pix and the green dashed line is the 1000 ADU/pix. Note that the max values can be at difference wavelengths. For the blue spec it is ~450 nm but for the RSG it is in the blue red overlap. But you still want the max so these areas are not saturated.
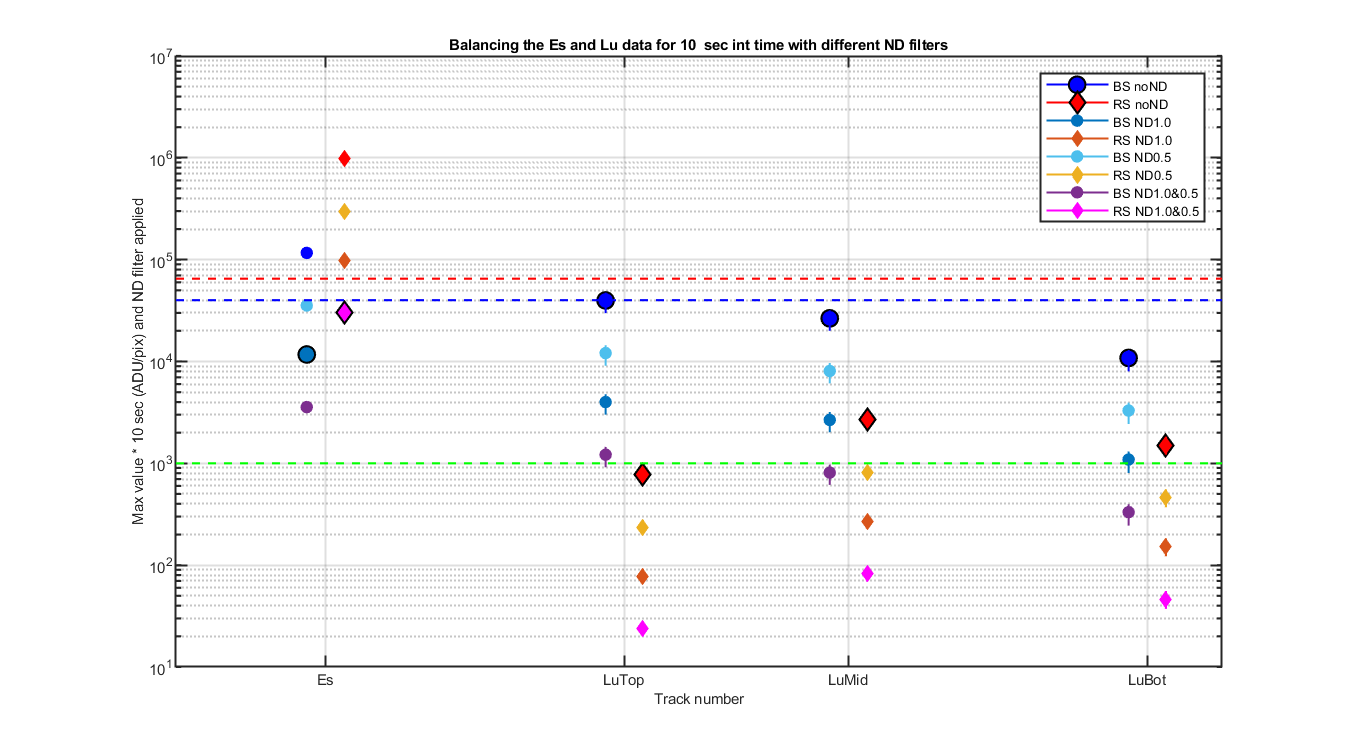
Figure 2 In this graph I have applied the two ND filters to each track and spec. circle = BSG and diamonds = RSG. Colors are which filter combination. The noND data points are the same as the ones in figure 1. The larger markers are the ones Mike chose for the MOBY267 deployment.