REVISION DATE: 02-Apr-2019 20:17:20
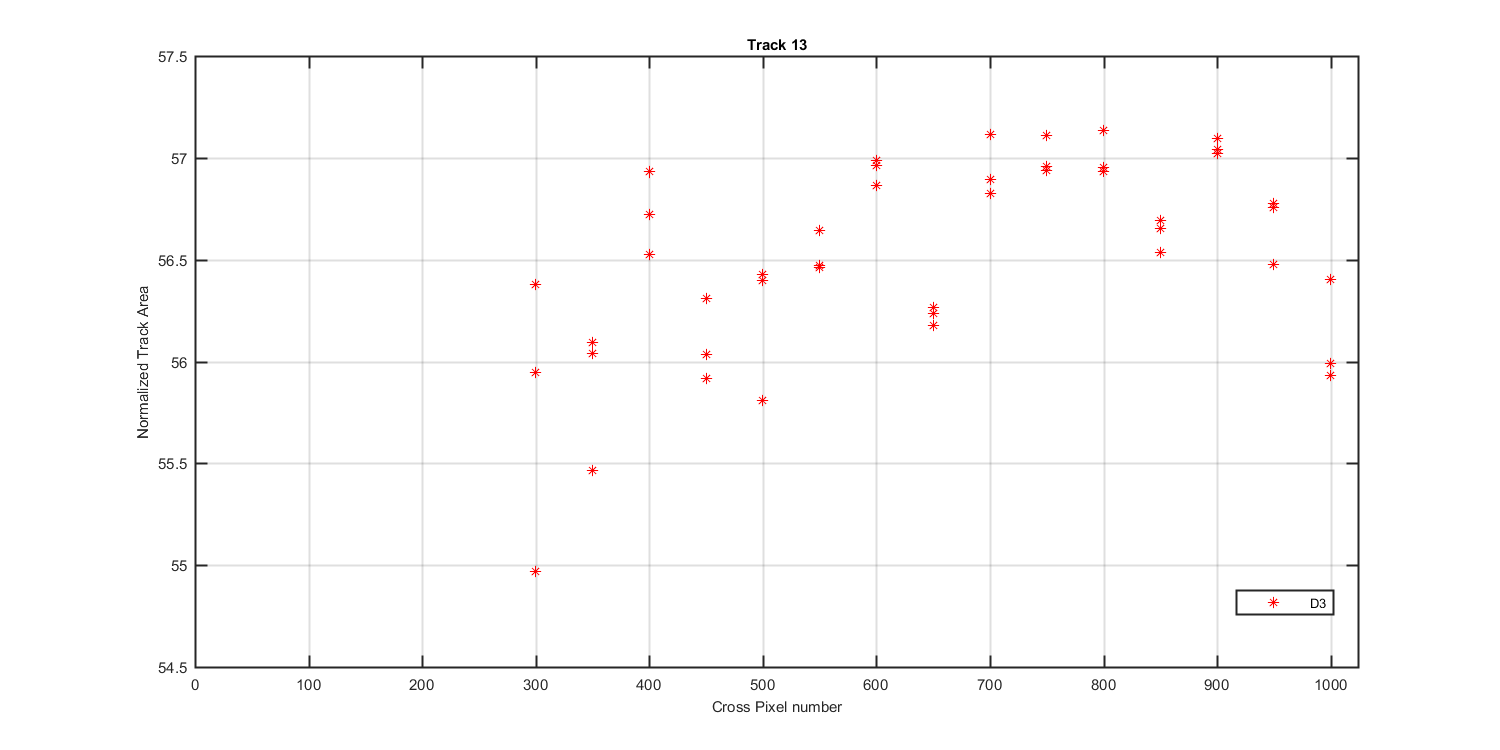
Looks at track movement for experiment data. For each file and track I normalized the track to its max value and plotted this for each file. Then I found where the right and left edge of each track crossed the 25% line. Track width is also shows This only includes broad band sources (laser and wavelnegth cal data are excluded)
Figure 1
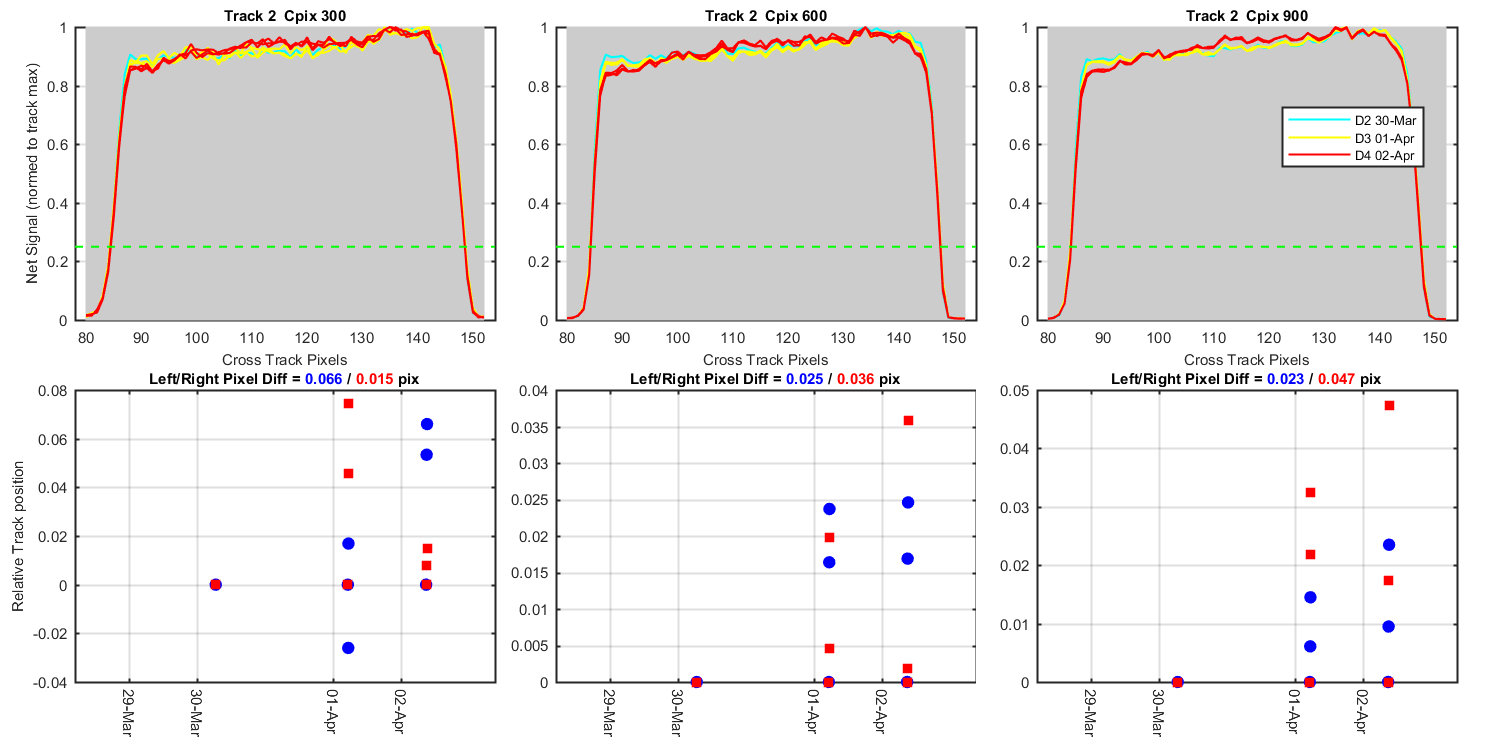
Figure 2
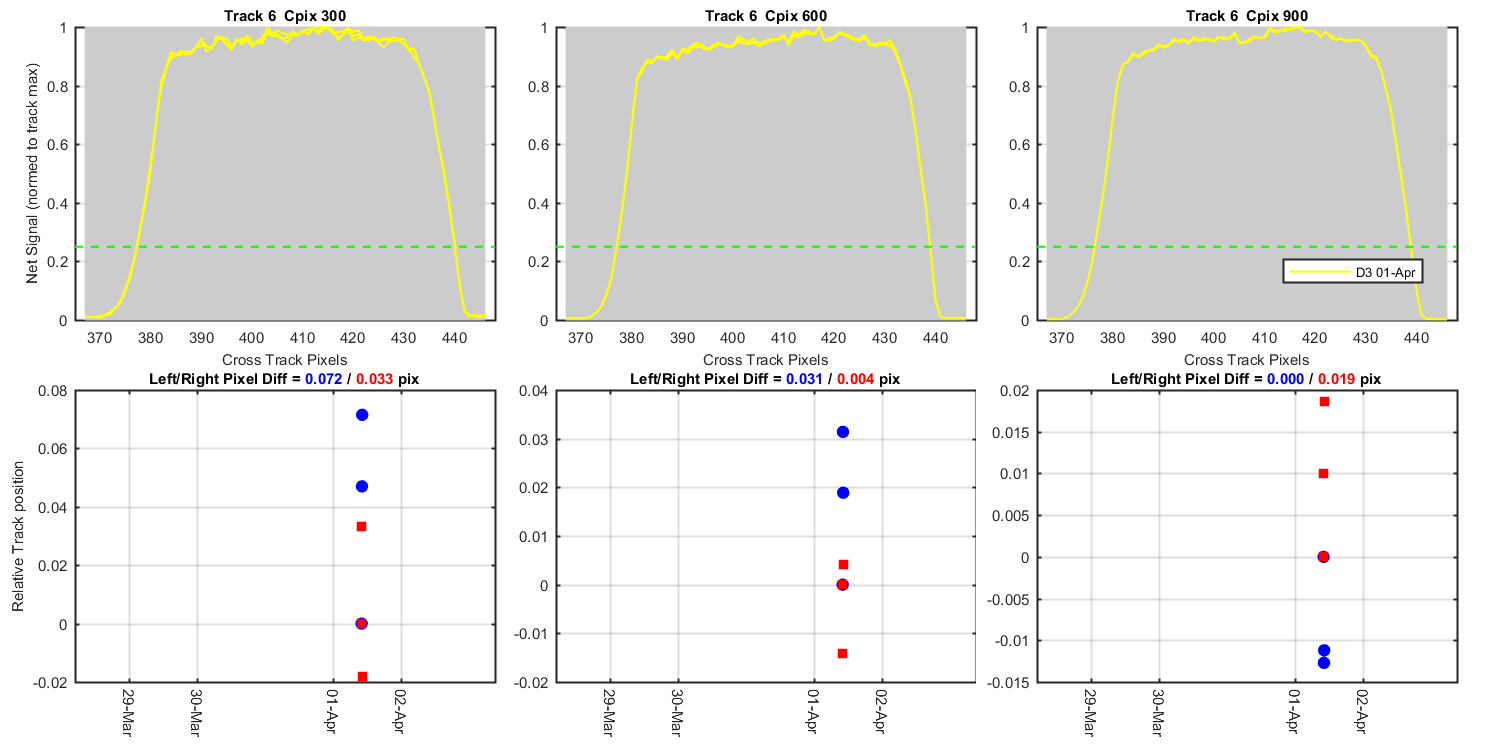
Figure 3
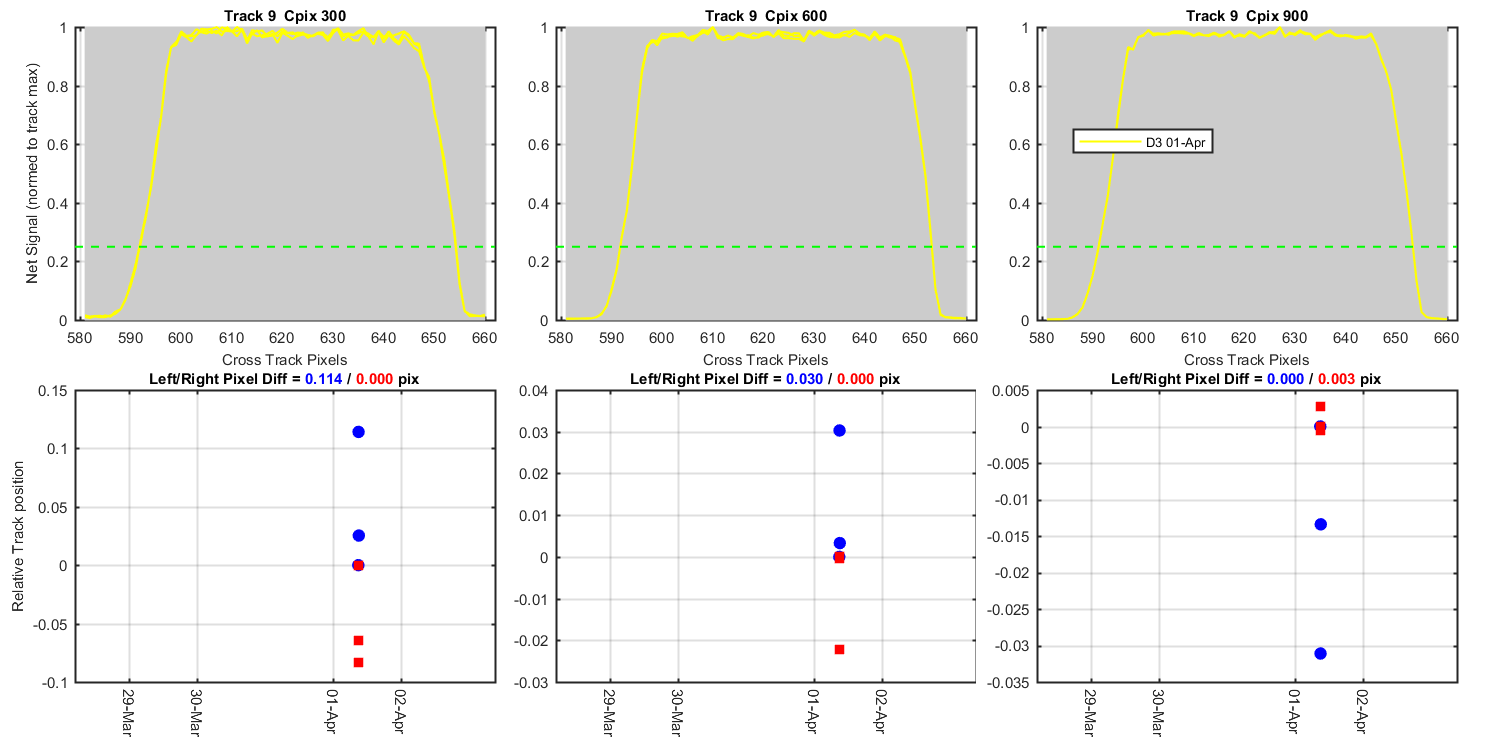
Figure 4
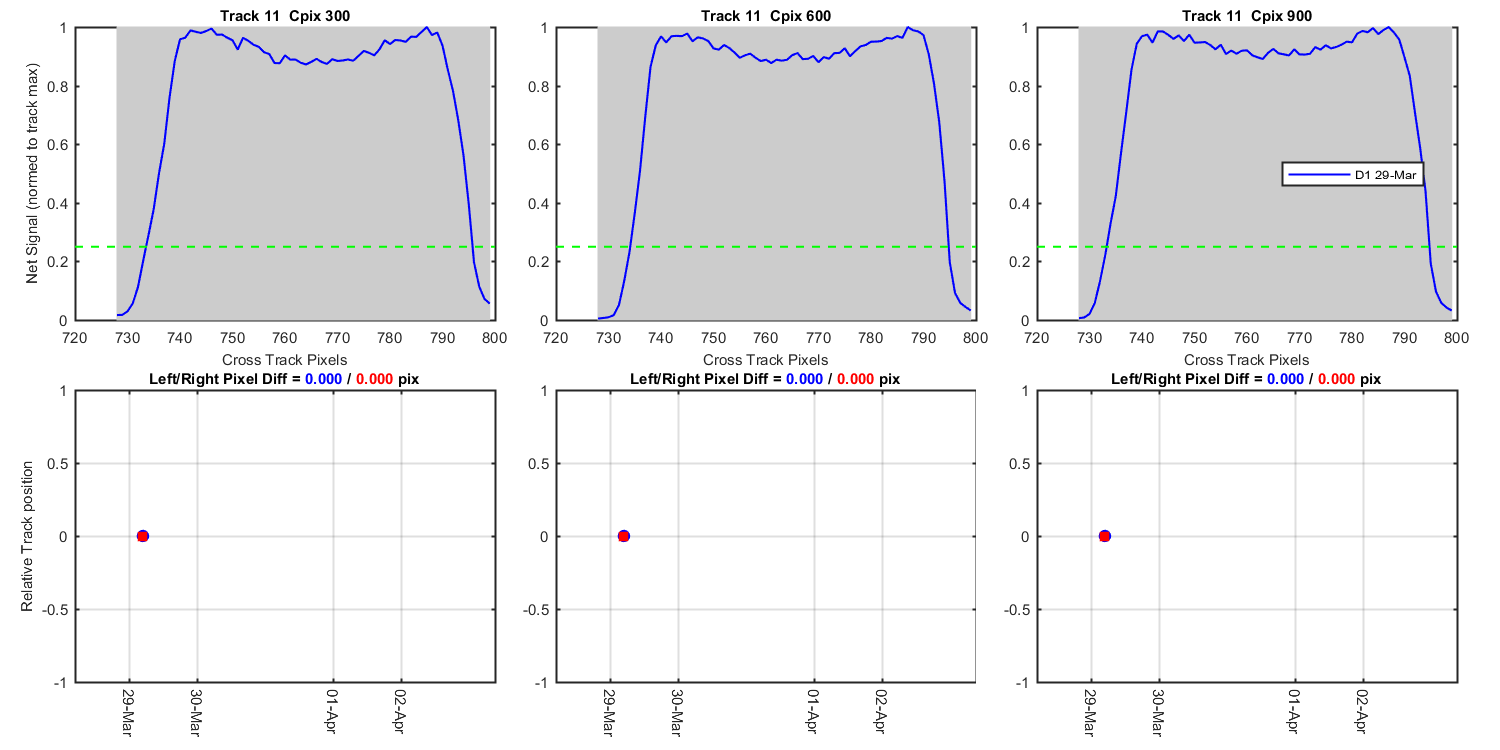
Figure 5
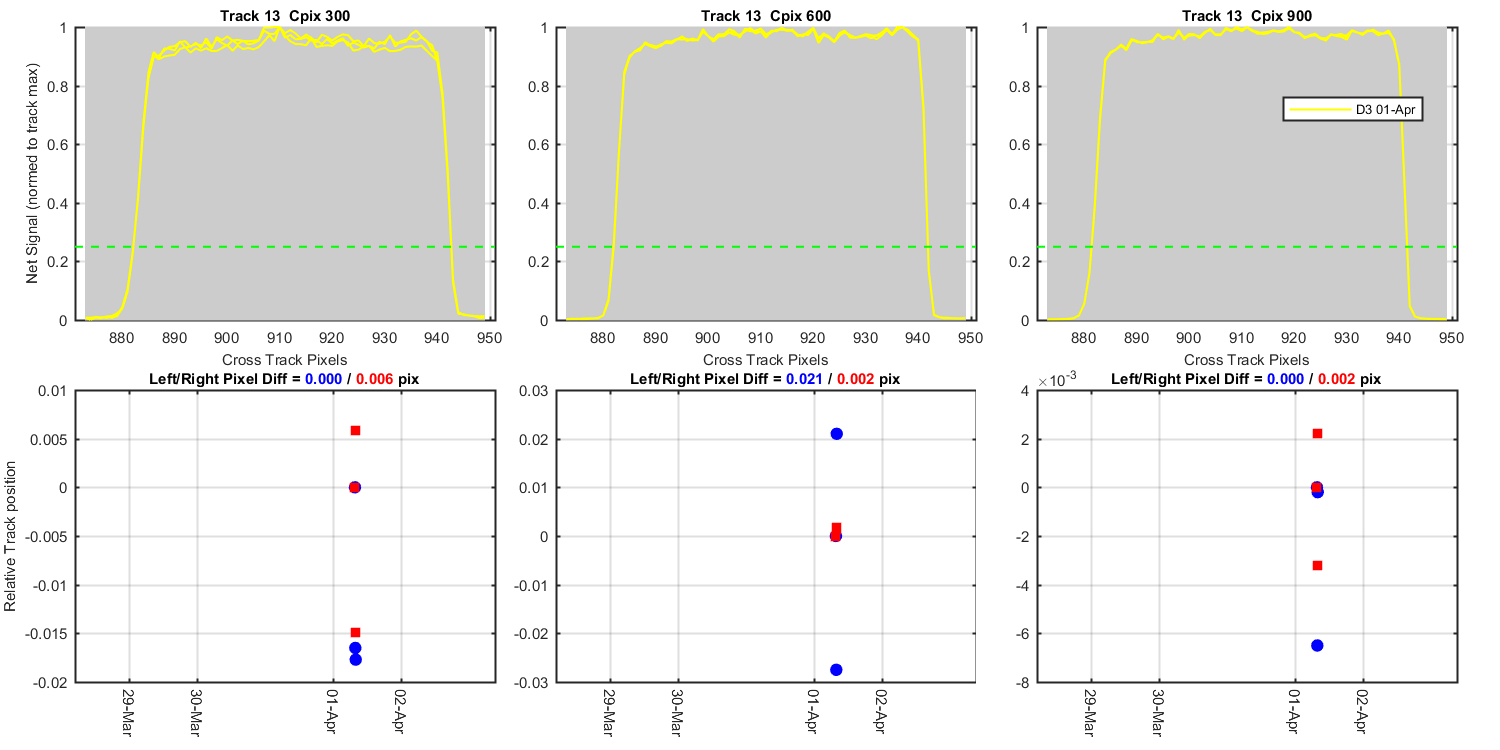
Figure 6
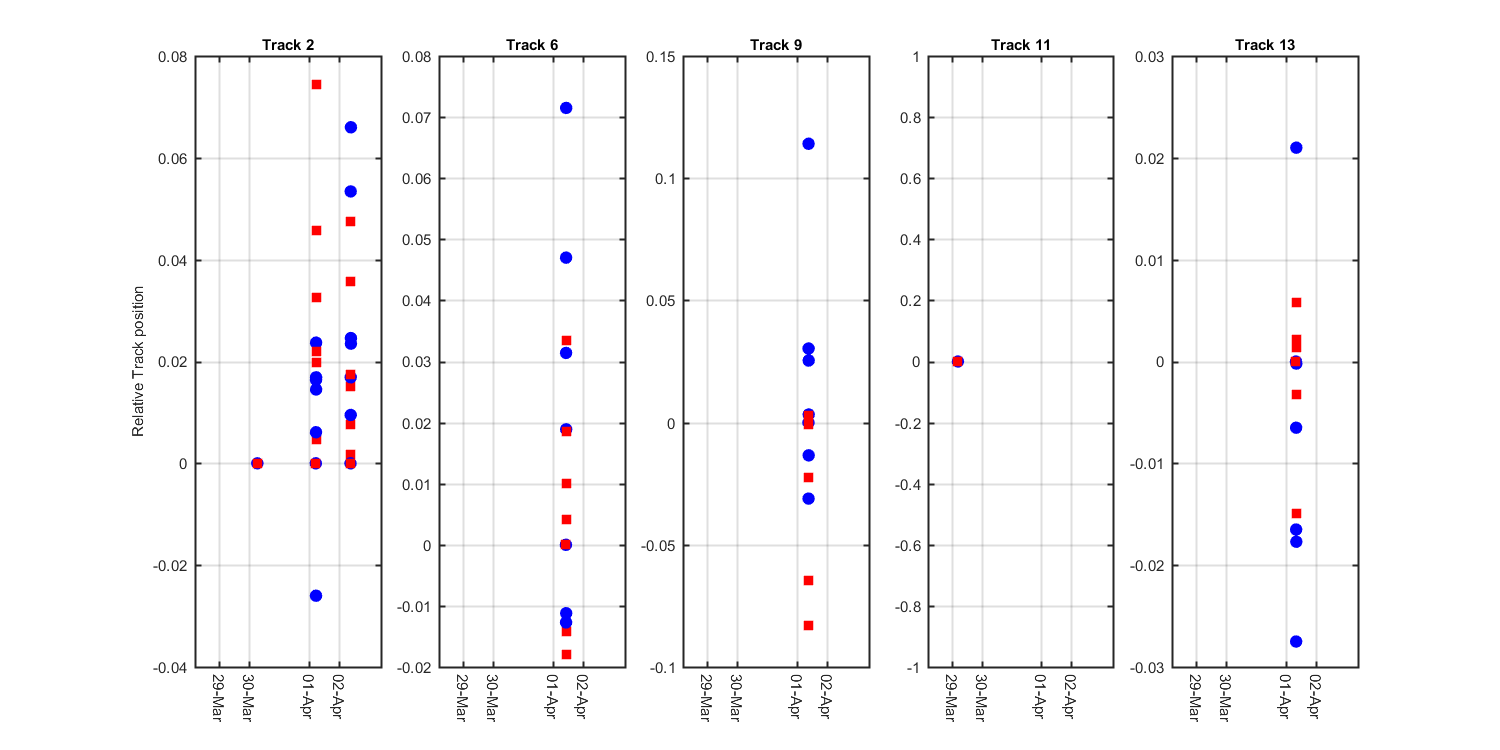
Figure 7
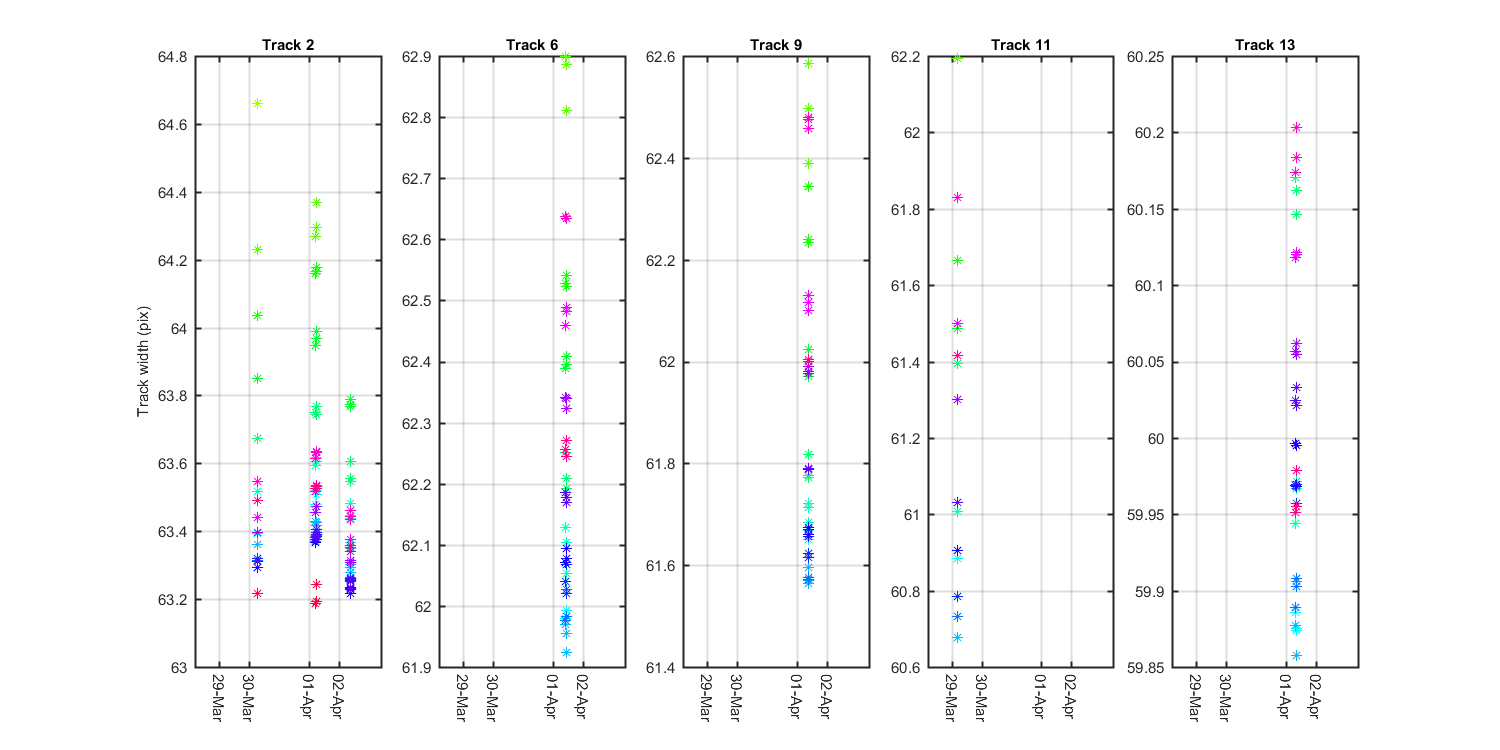
Figure 8
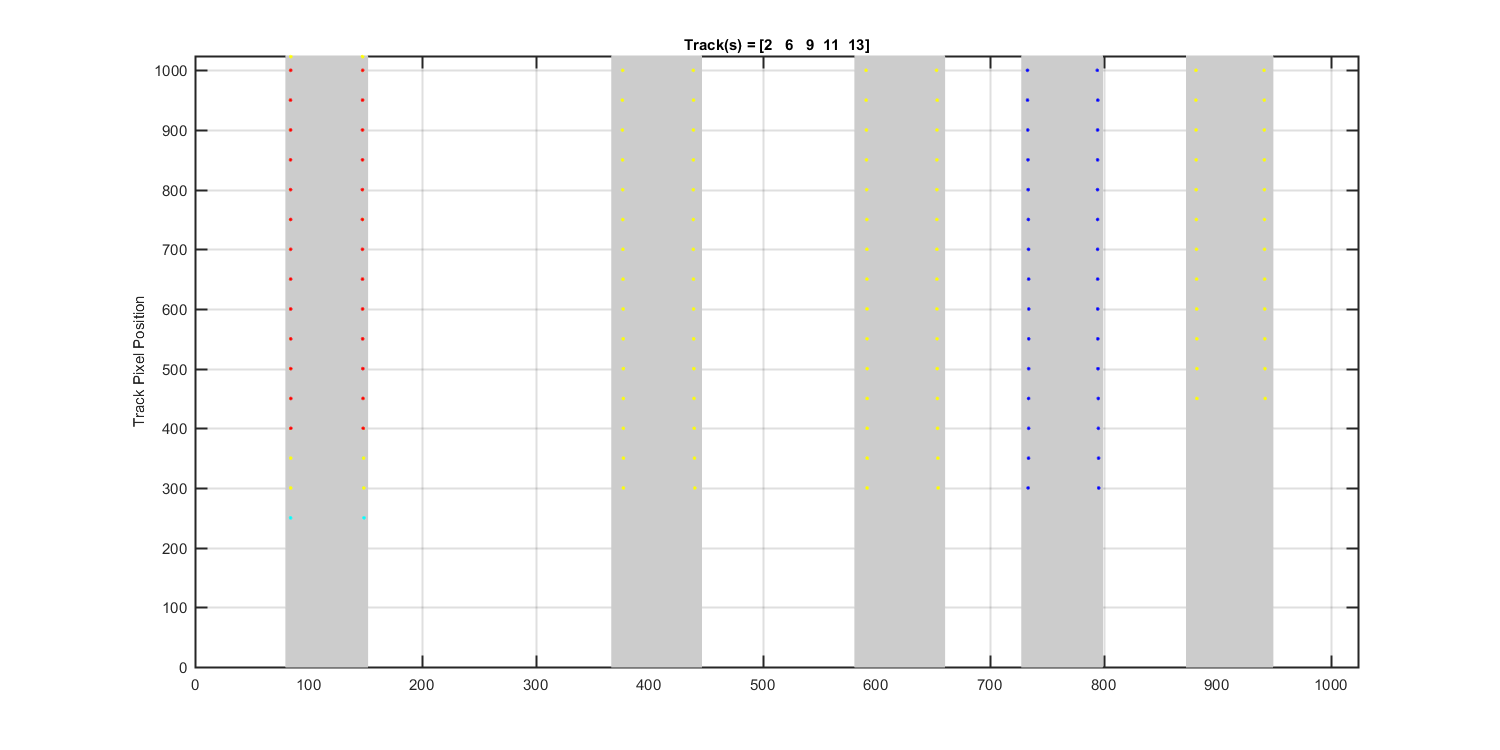
Figure 9
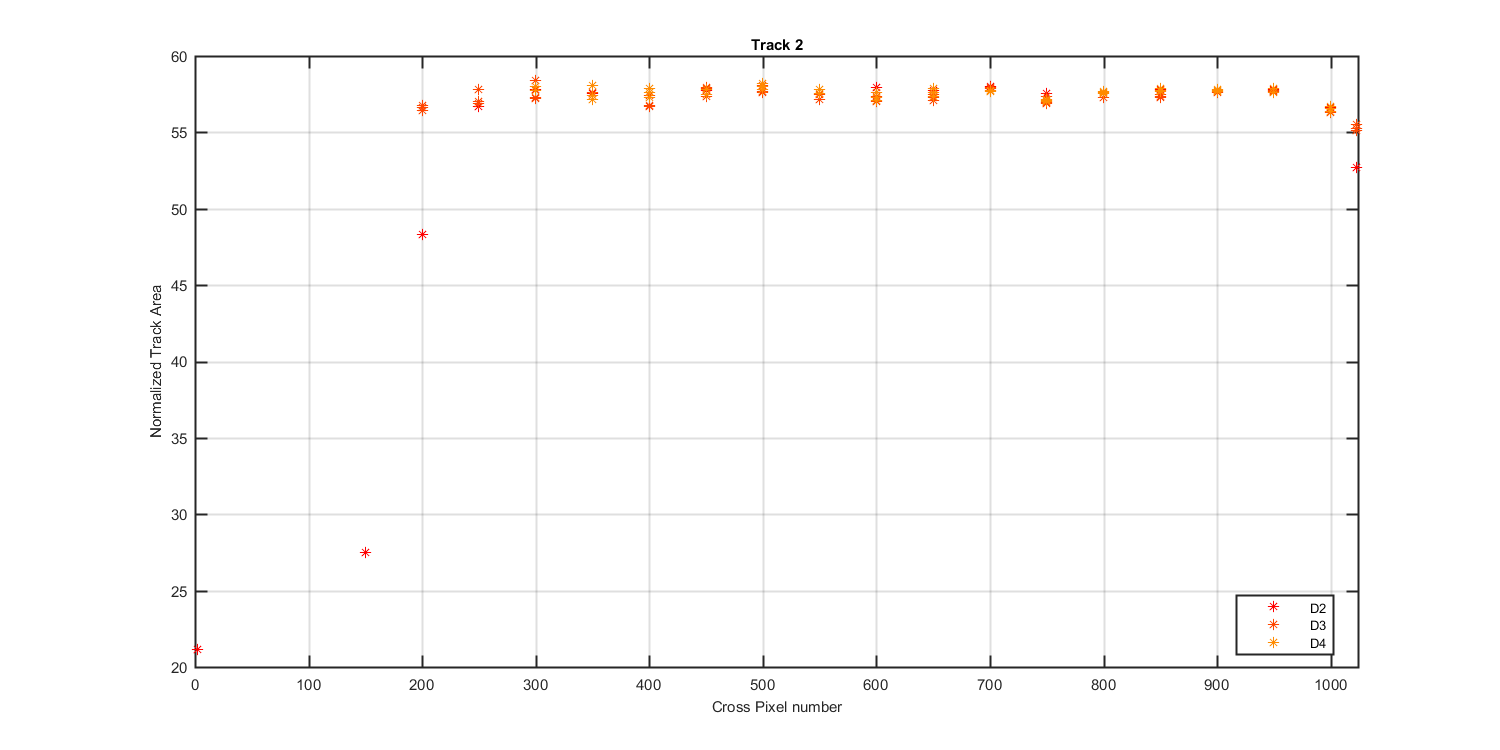
Figure 10
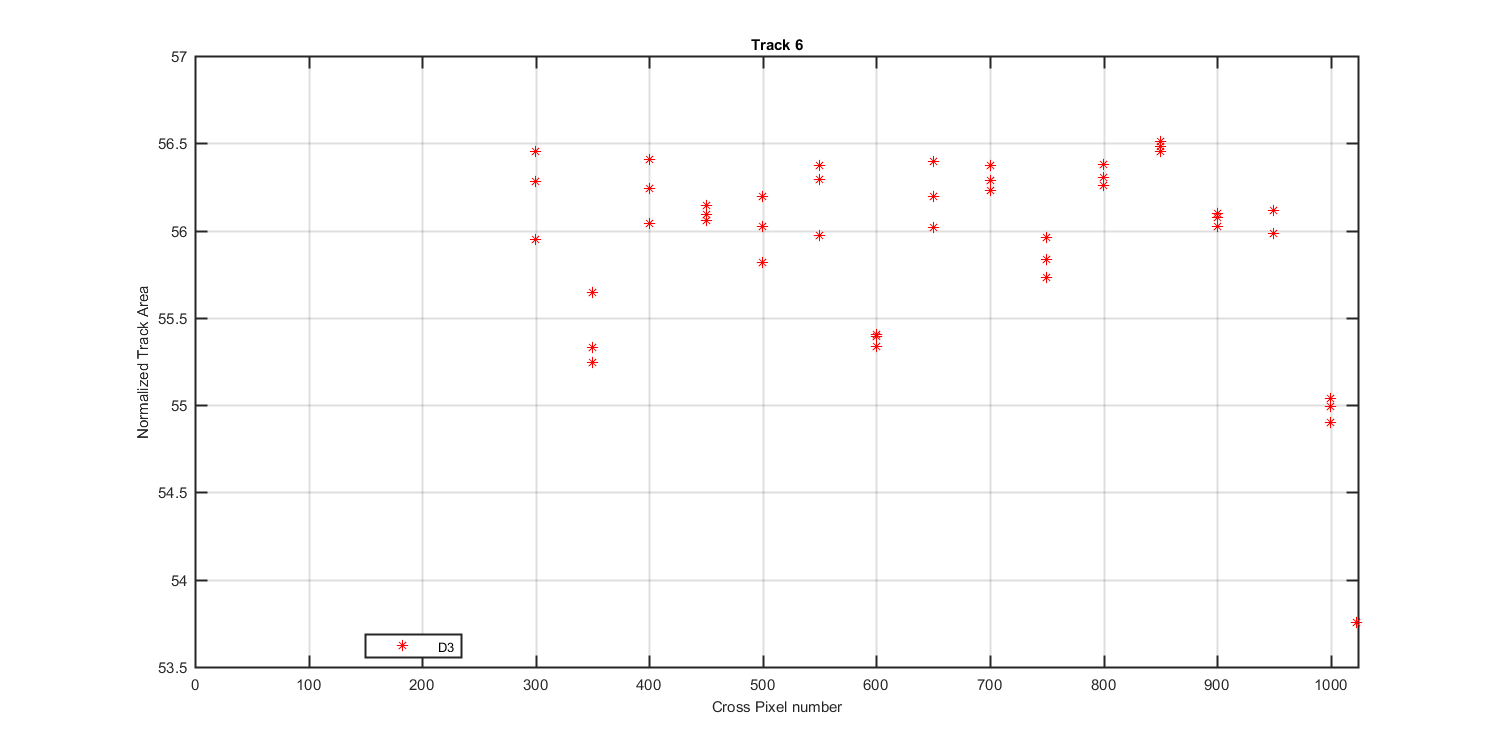
Figure 11
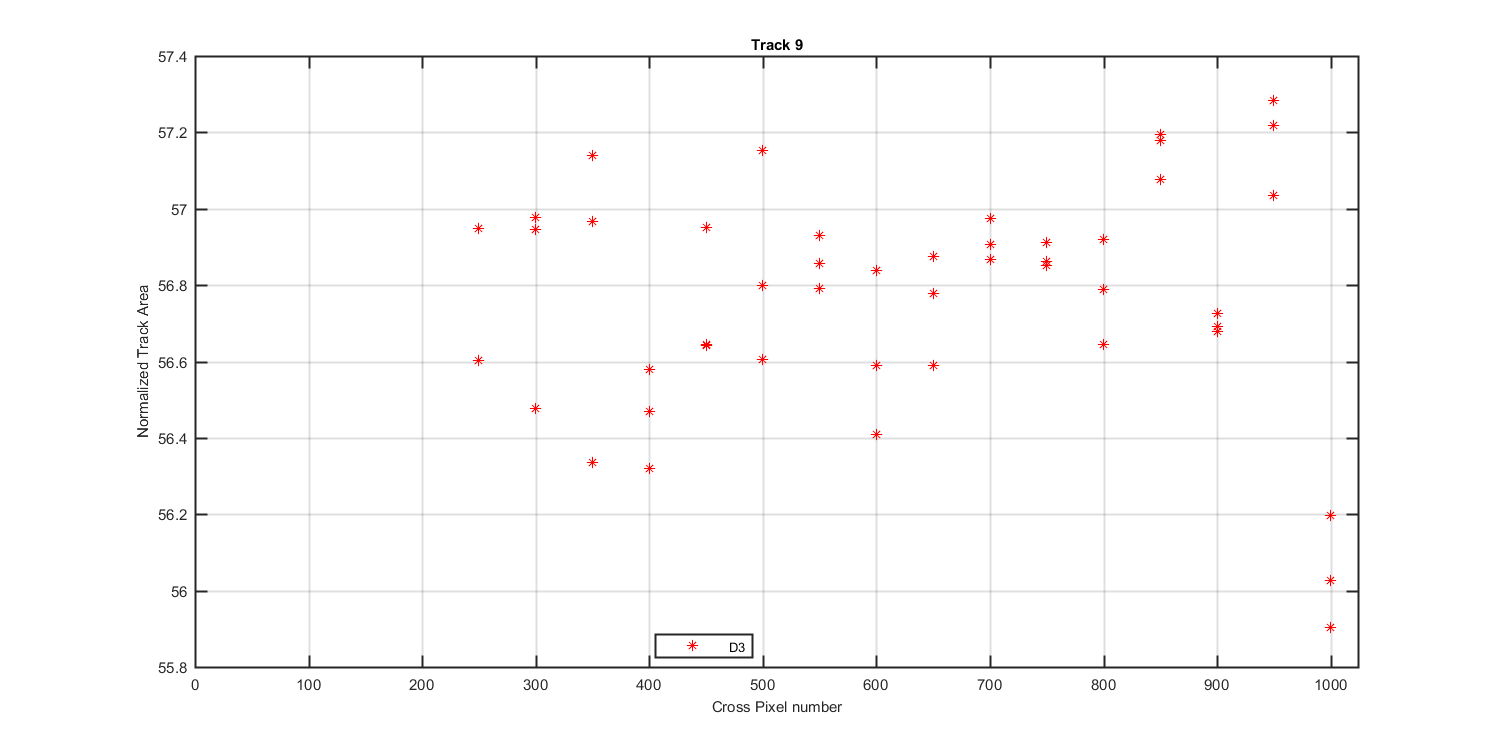
Figure 12
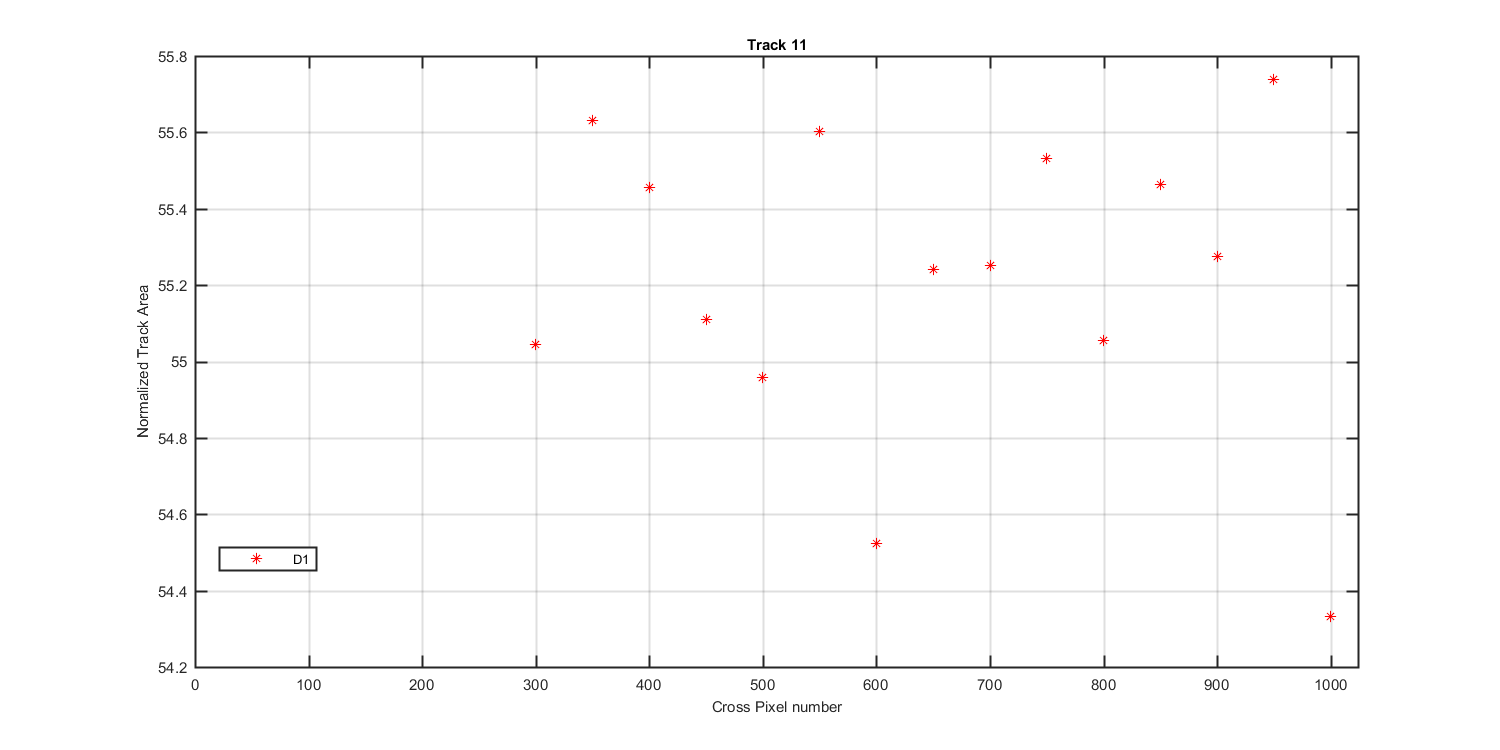
Figure 13