REVISION DATE: 04-Apr-2019 16:50:29
Exerimental BS or RS data starting to put data into new Vaux setup.
| Dataset# | Filename / Fit# | Type | file creation date | Total Exposure Time | Tracks on | Temperature | Pre Amplifier Gain | Matrix Max (ADU) | Matrix Mean (ADU) | Matrix % std |
|---|---|---|---|---|---|---|---|---|---|---|
| 1 | BS_20190329_045105_raw01 / 001 | Dark | 29-Mar-2019 04:51:05 | 10 | 12 | -60 | 4 | 13222 | 4013.4722 | 0.3491 |
| 1 | BS_20190329_045105_raw01 / 002 | Dark | 29-Mar-2019 04:51:18 | 10 | 12 | -60 | 4 | 4072 | 4016.2599 | 0.22514 |
| 1 | BS_20190329_045105_raw01 / 001 | Lite | 29-Mar-2019 04:52:02 | 10 | 12 | -60 | 4 | 4064 | 4014.098 | 0.22266 |
| 1 | BS_20190329_045105_raw01 / 002 | Lite | 29-Mar-2019 04:52:16 | 10 | 12 | -60 | 4 | 4075 | 4016.4619 | 0.22744 |
| 1 | BS_20190329_045105_raw01 / 003 | Lite | 29-Mar-2019 04:52:29 | 10 | 12 | -60 | 4 | 4076 | 4017.9902 | 0.22921 |
| 1 | BS_20190329_045105_raw01 / 004 | Lite | 29-Mar-2019 04:52:43 | 10 | 12 | -60 | 4 | 4074 | 4018.772 | 0.23146 |
| 1 | BS_20190329_045105_raw01 / 003 | Dark | 29-Mar-2019 04:53:06 | 10 | 12 | -60 | 4 | 4086 | 4016.6262 | 0.22811 |
| 1 | BS_20190329_045105_raw01 / 004 | Dark | 29-Mar-2019 04:53:20 | 10 | 12 | -60 | 4 | 4074 | 4017.9648 | 0.2308 |
| 2 | BS_20190329_045105_raw01 / 005 | Dark | 29-Mar-2019 04:59:06 | 10 | 11 | -60 | 4 | 4070 | 4012.7206 | 0.22066 |
| 2 | BS_20190329_045105_raw01 / 006 | Dark | 29-Mar-2019 04:59:19 | 10 | 11 | -60 | 4 | 4074 | 4016.0115 | 0.22338 |
| 2 | BS_20190329_045105_raw01 / 005 | Lite | 29-Mar-2019 04:59:43 | 10 | 11 | -60 | 4 | 29471 | 4608.0134 | 65.1531 |
| 2 | BS_20190329_045105_raw01 / 006 | Lite | 29-Mar-2019 04:59:56 | 10 | 11 | -60 | 4 | 23948 | 4465.8666 | 51.3616 |
| 2 | BS_20190329_045105_raw01 / 007 | Lite | 29-Mar-2019 05:00:10 | 10 | 11 | -60 | 4 | 20387 | 4390.6521 | 43.8747 |
| 2 | BS_20190329_045105_raw01 / 008 | Lite | 29-Mar-2019 05:00:23 | 10 | 11 | -60 | 4 | 20404 | 4390.2191 | 43.7898 |
| 2 | BS_20190329_045105_raw01 / 007 | Dark | 29-Mar-2019 05:00:47 | 10 | 11 | -60 | 4 | 4076 | 4016.9351 | 0.22622 |
| 2 | BS_20190329_045105_raw01 / 008 | Dark | 29-Mar-2019 05:01:00 | 10 | 11 | -60 | 4 | 4076 | 4018.1185 | 0.22779 |
Graphs below are of the Nets for a dataset. A dataset is a group of dark-lite-dark files that Mike says in his logsheet are collected together. One net = darks before and after averaged then , lights averaged, then avg_lite-avg_dark and the avg_net divided by intergration time for each track.
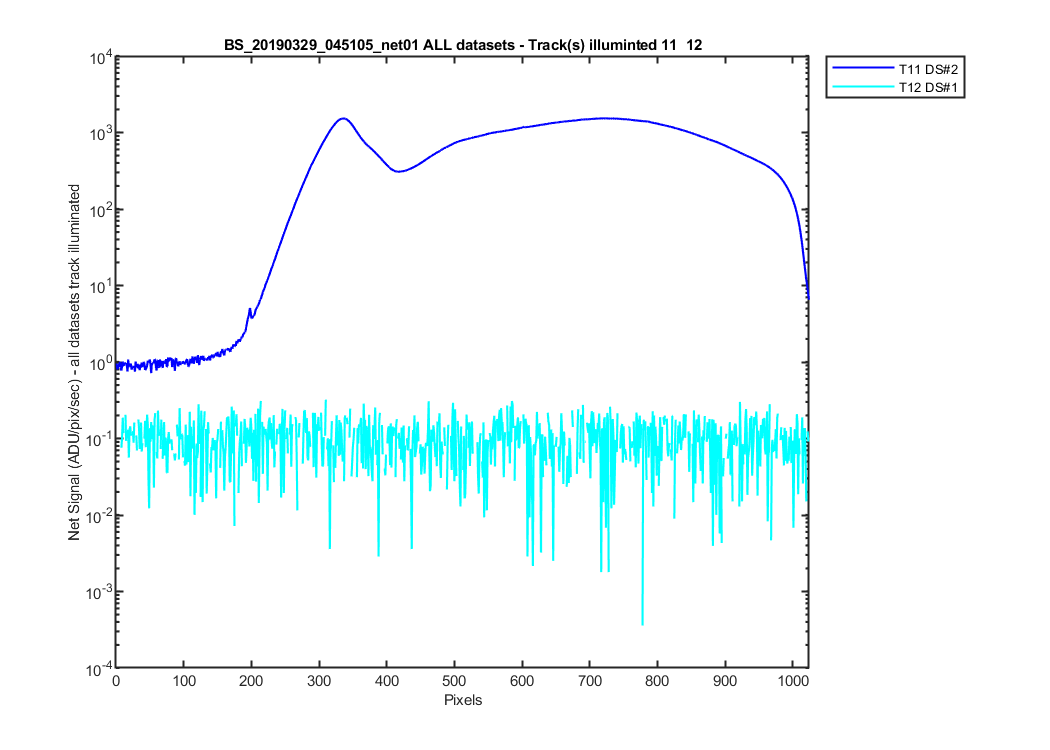
Figure 1 A: All the net data sets with a track illuminated. This shows ALL the net tracks with light on them.
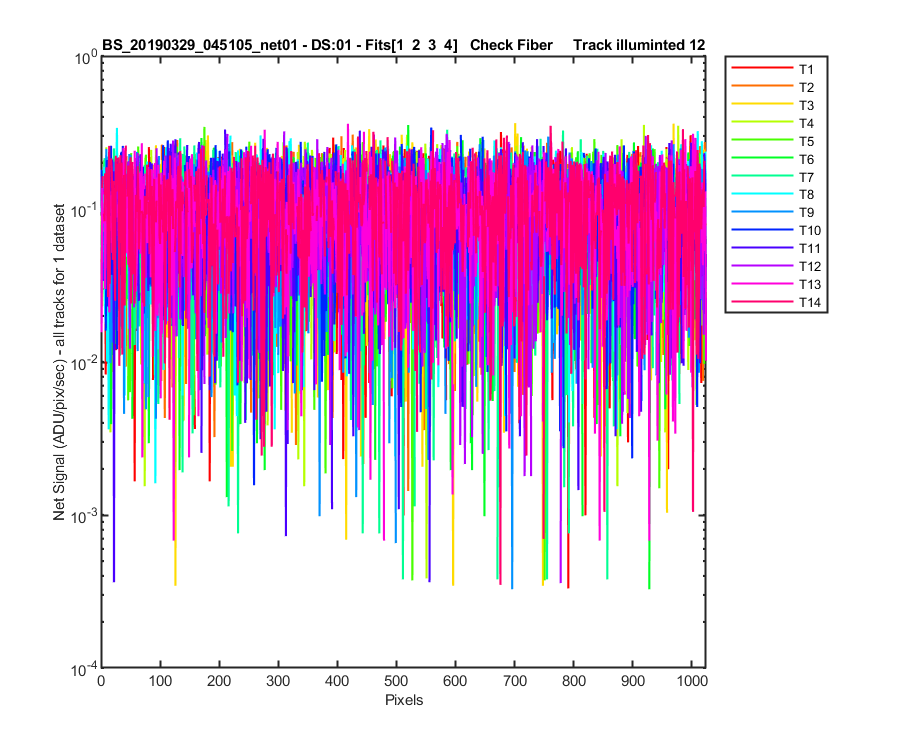
Figure 2 A: The net for one dataset (dark-lite-dark) for all tracks illuminated or not. This allows you to see the straylight on other tracks. The dataset number and fits files used to create this net are in the title of the figure.
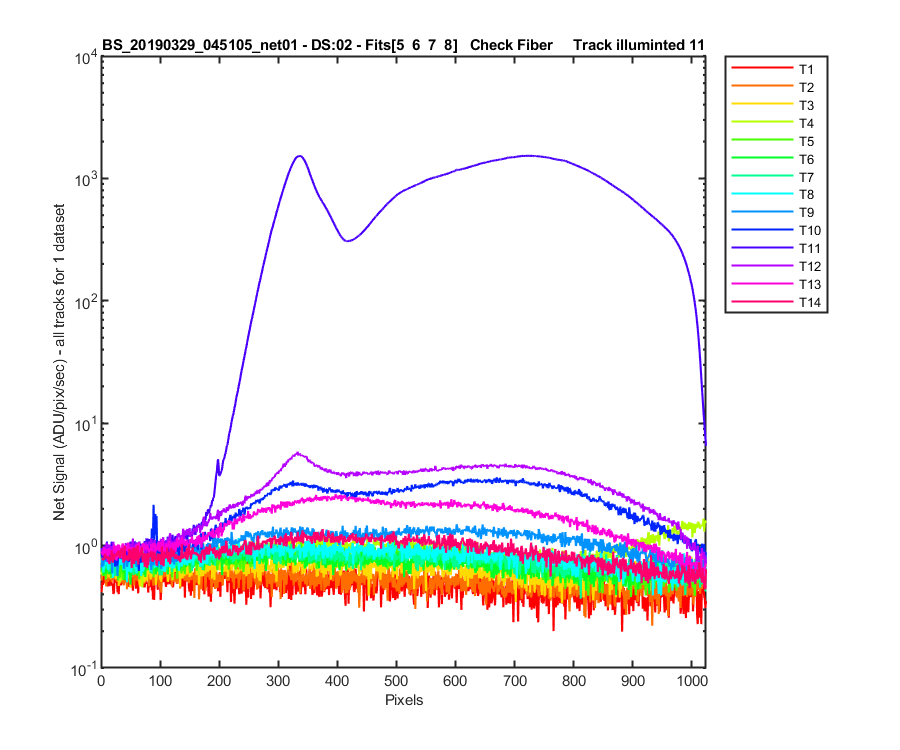
Figure 3 A: The net for one dataset (dark-lite-dark) for all tracks illuminated or not. This allows you to see the straylight on other tracks. The dataset number and fits files used to create this net are in the title of the figure.
Graphs below are from the labjack temperatures. The dashed lines how where data where collected. D = Dark, L = lite and B = background. The Number is the fits last three numbers in the filename.
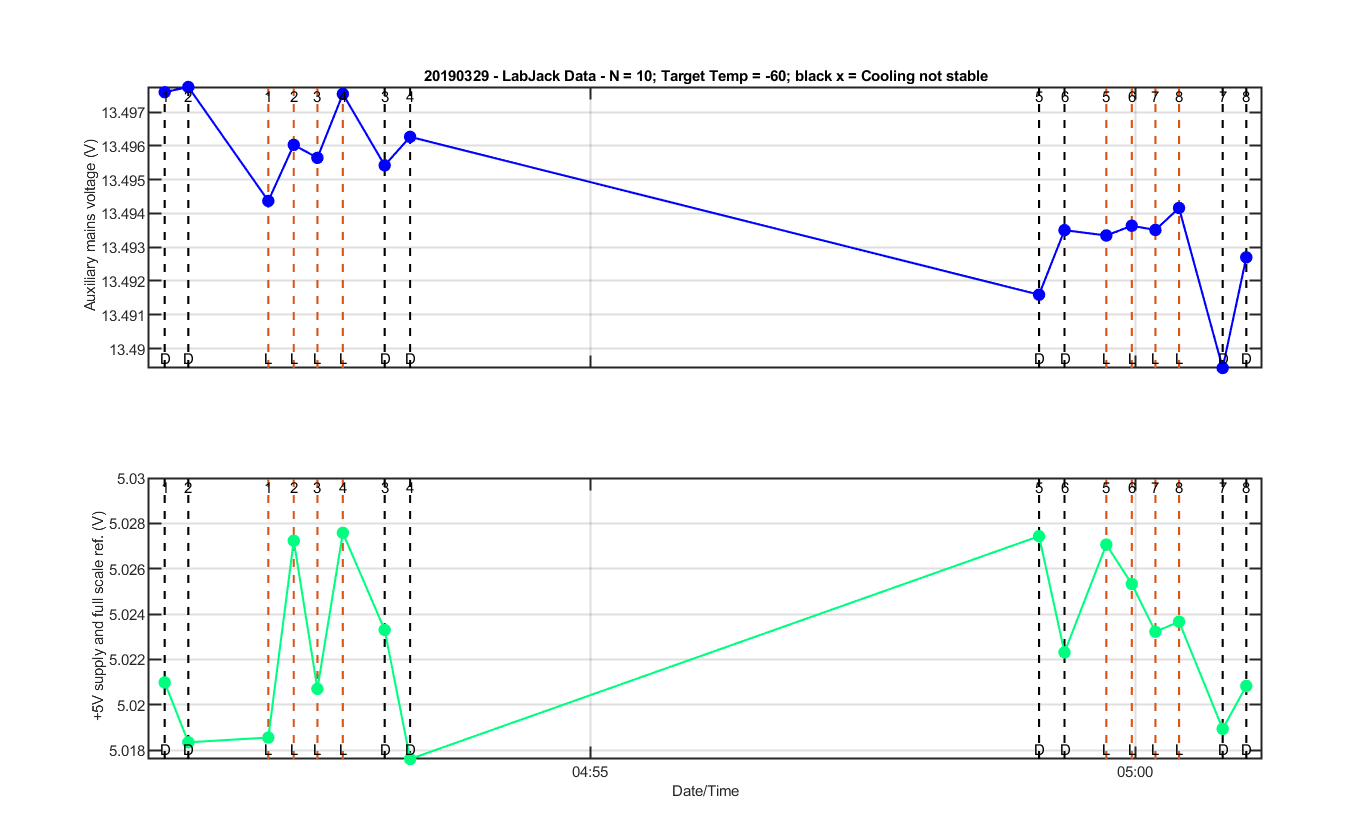
Figure 1 C: LabJack Measurements in the h5 file. Internal temperatures etc during data collections
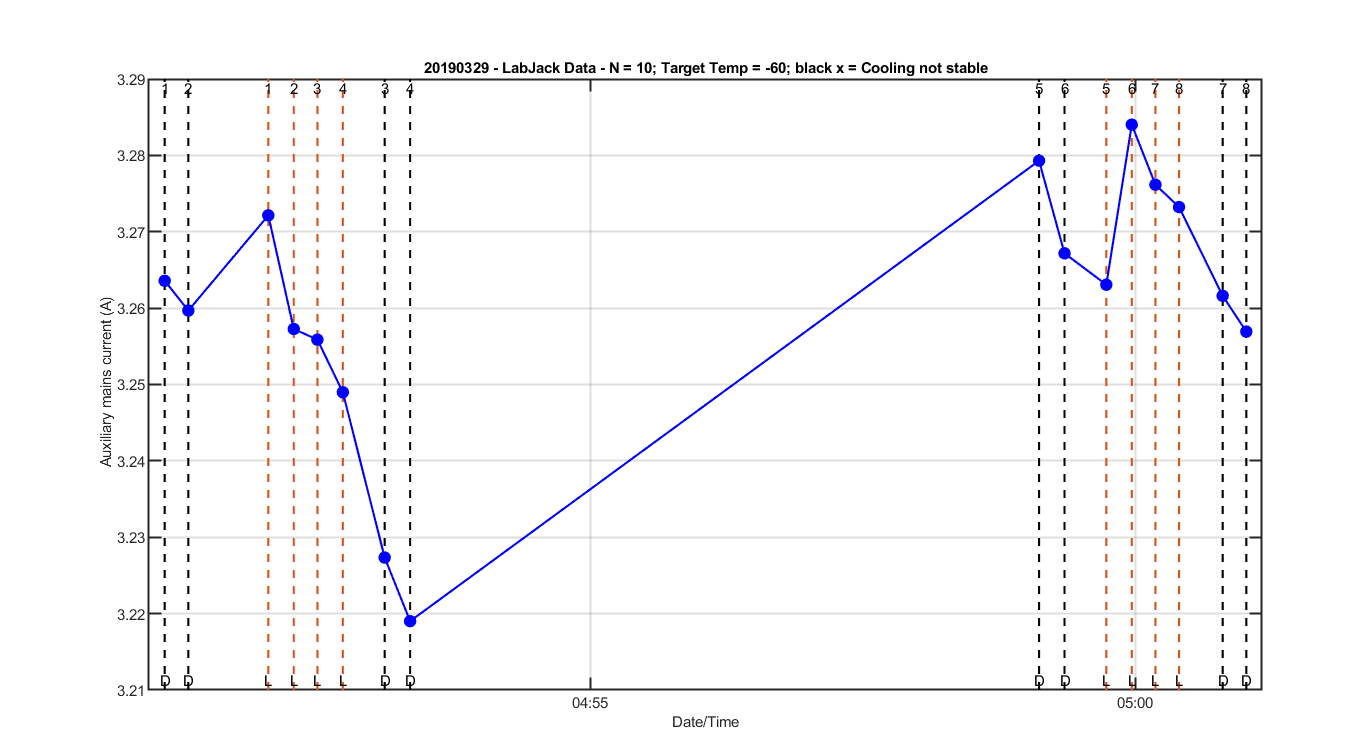
Figure 2 C:
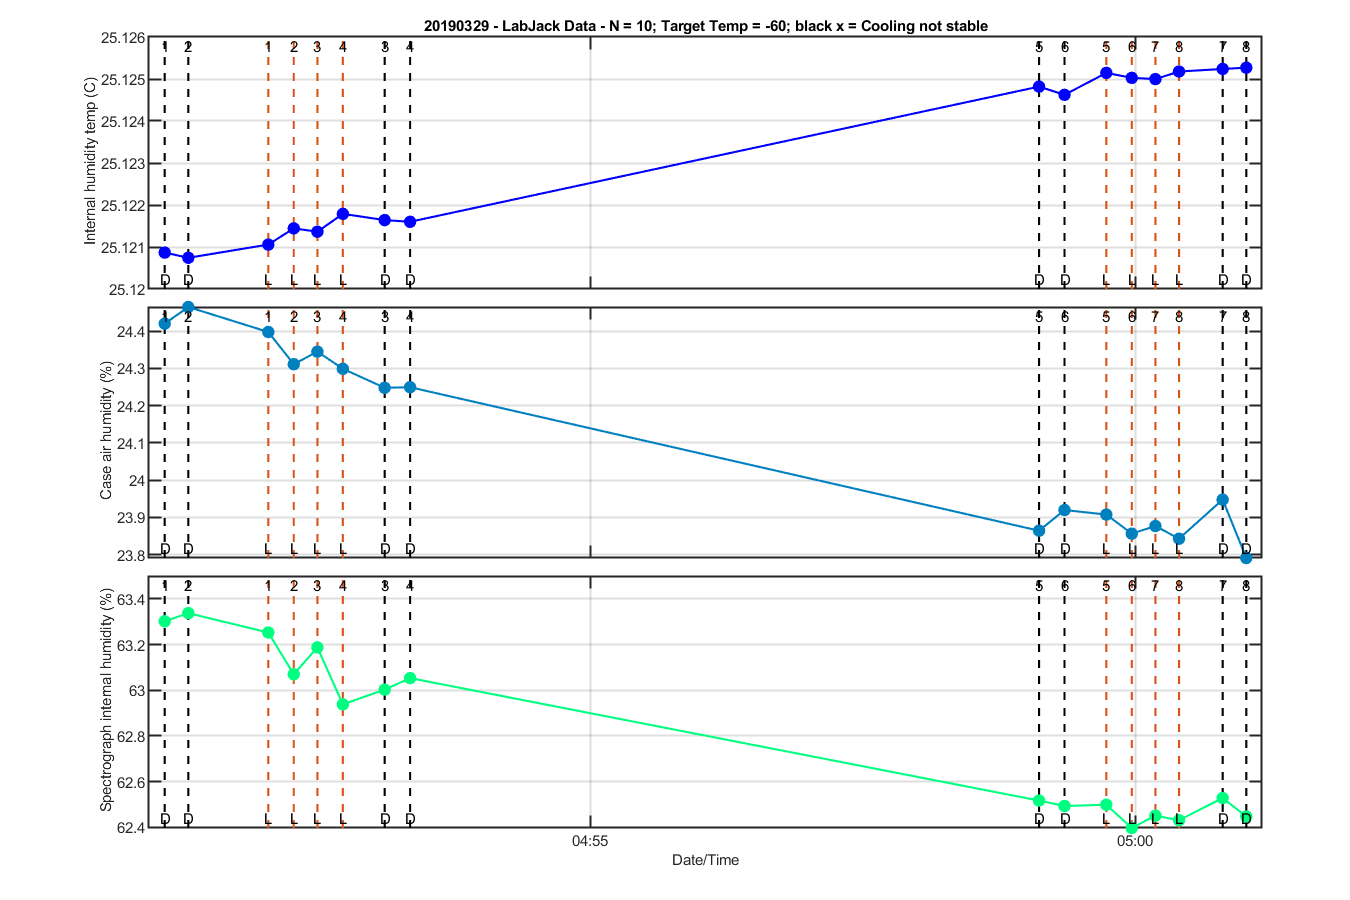
Figure 3 C:
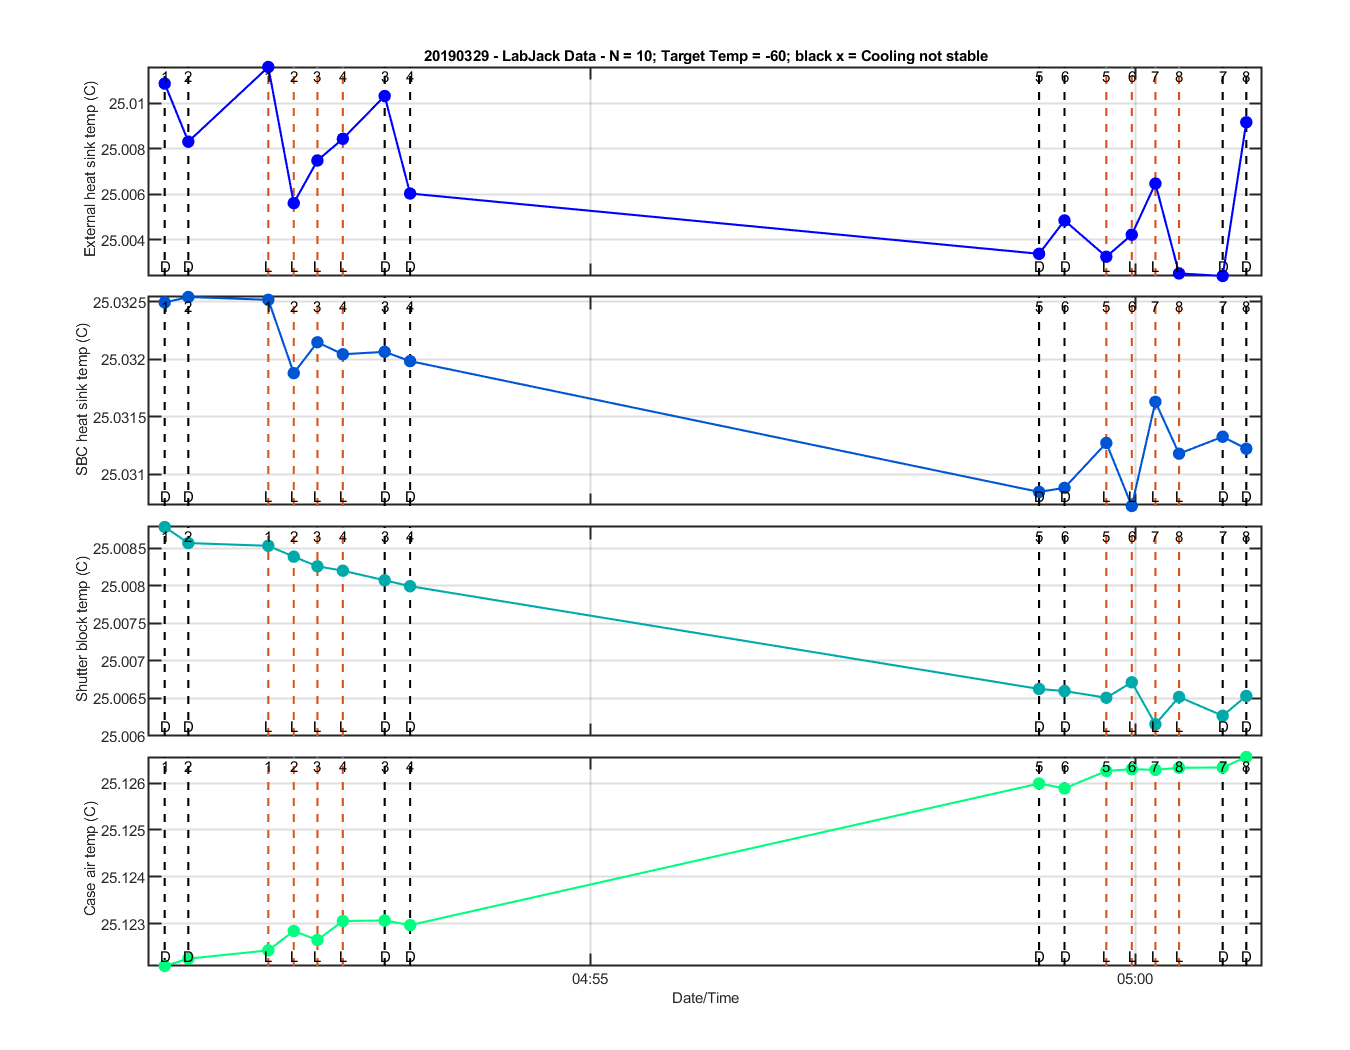
Figure 4 C:
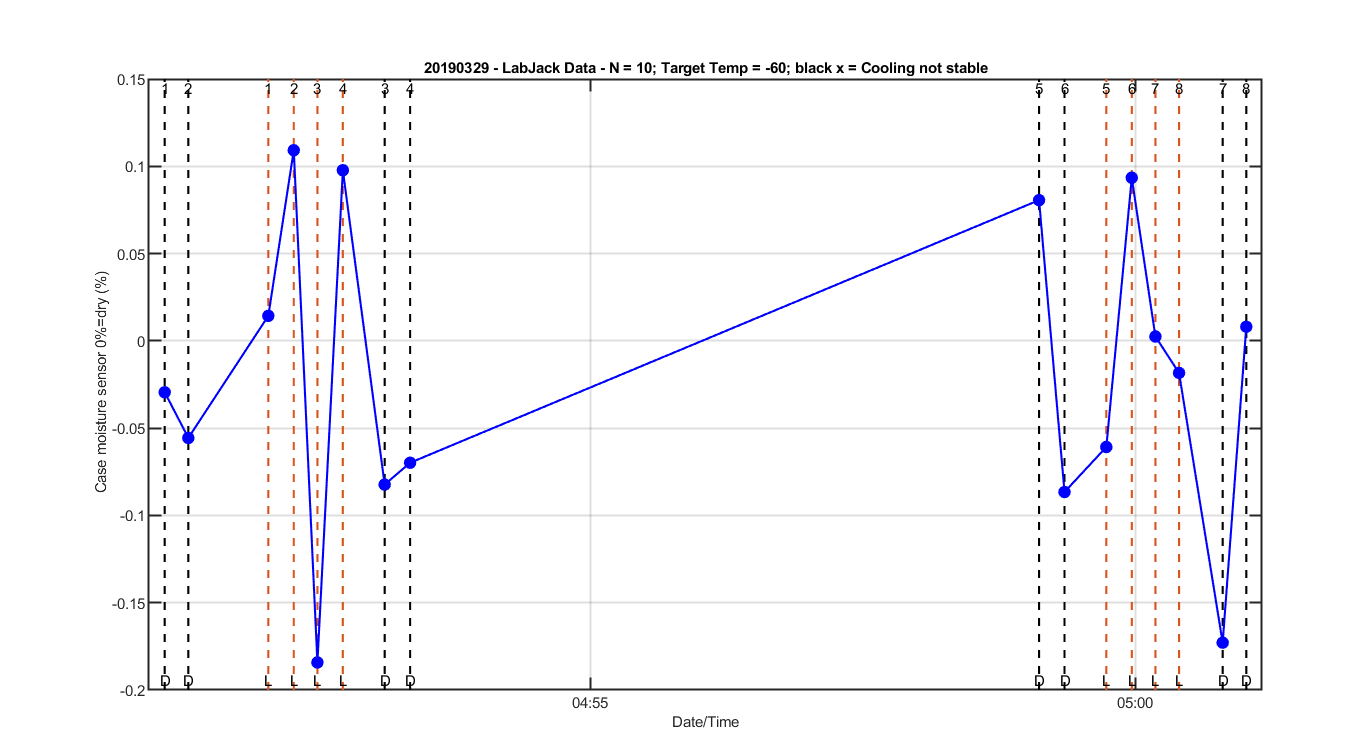
Figure 5 C:
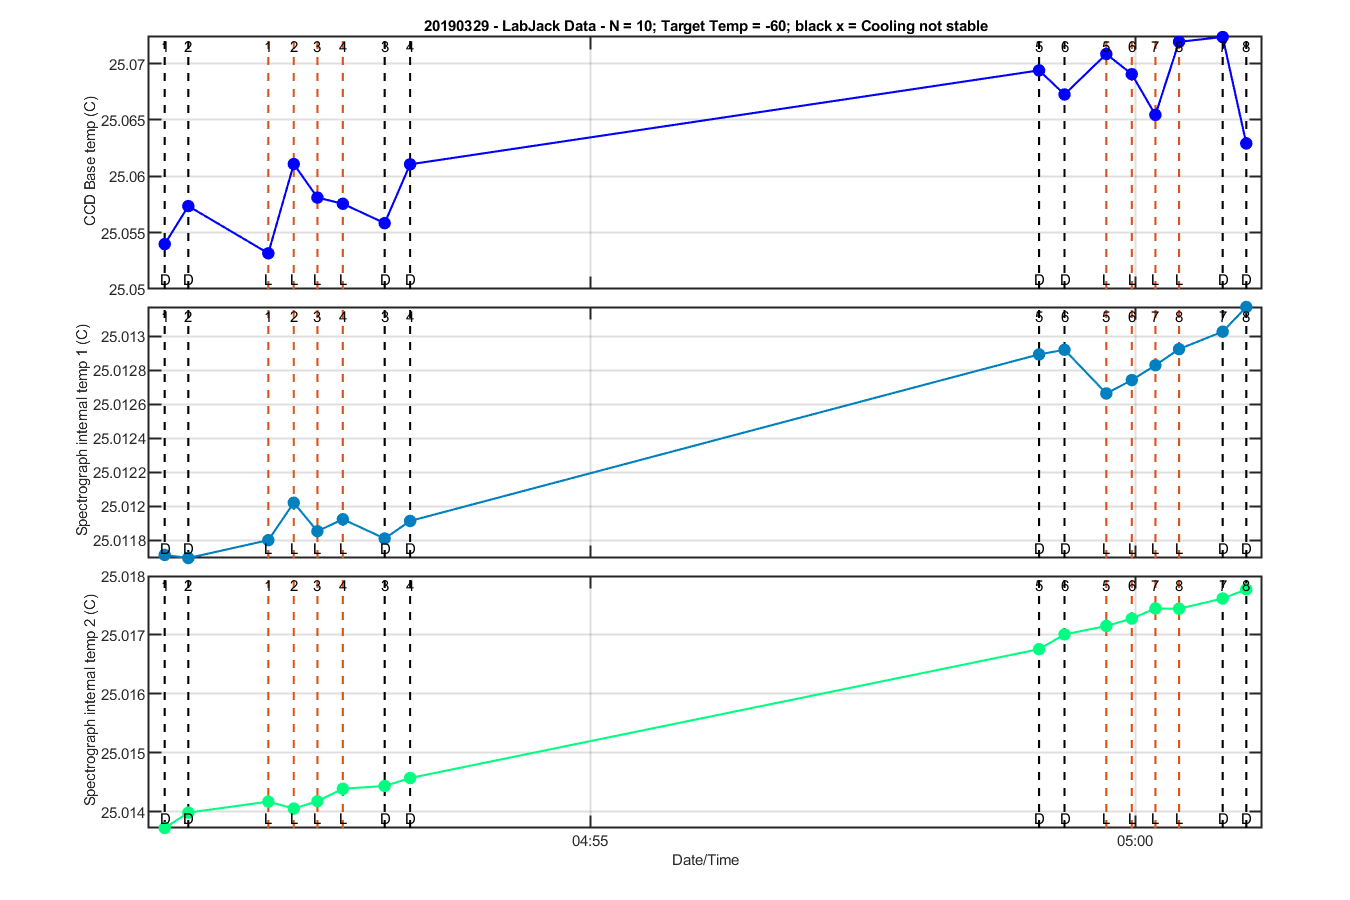
Figure 6 C: