REVISION DATE: 03-Apr-2019 13:54:03
The Red spec shows the issue I found, see graphs below.
Mike said "Did you notice that: all the RS net data are negative, Trk#6 below ~ 524 nm, Trk#9 below ~535 nm... So I created the graphs below. FYI: Day 1- 4 (10_jan to 15 Jan) are track 6 and the last 4 days are using track 9 at a lower lamp level. Track 9 is probably lower because the lamp was at a lower level. Why are the data negative?
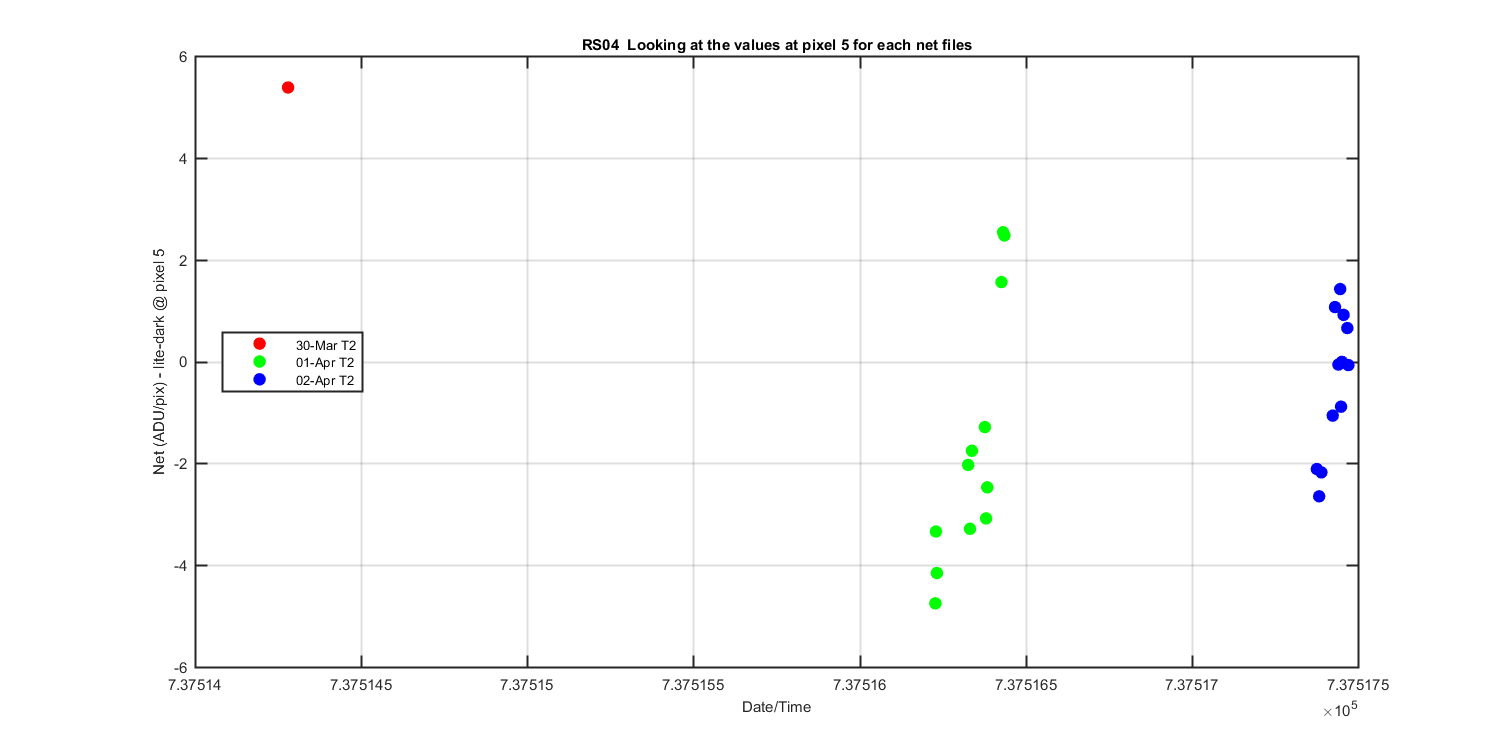
Figure 1 : Shows the pixel 5 values for each net for each days and experiment. Each dot is a net from each dataset collected on each day. Why are they negative?
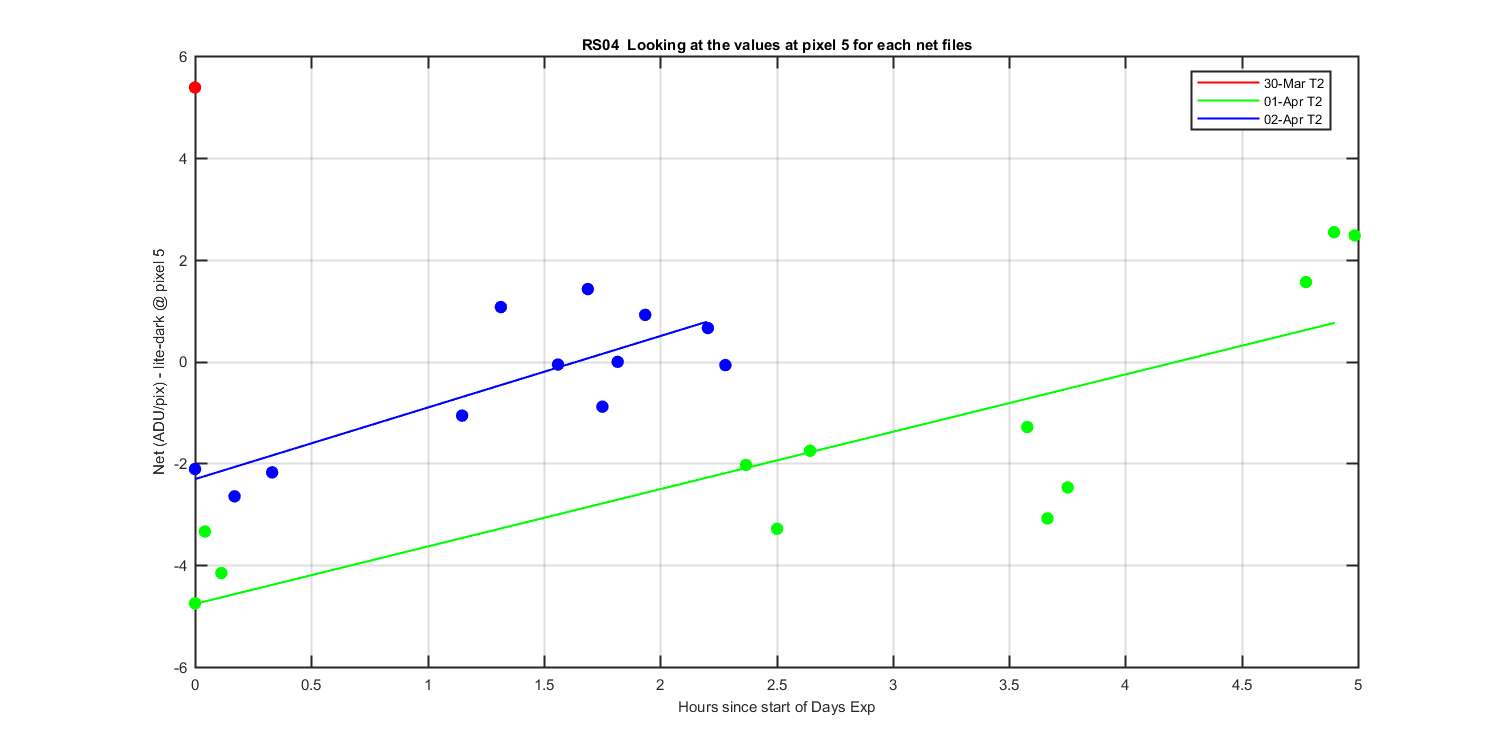
Figure 2 : Shows the pixel 5 values for each net for each days and experiment. Each dot is a net from each dataset collected on each day. Why are they negative?
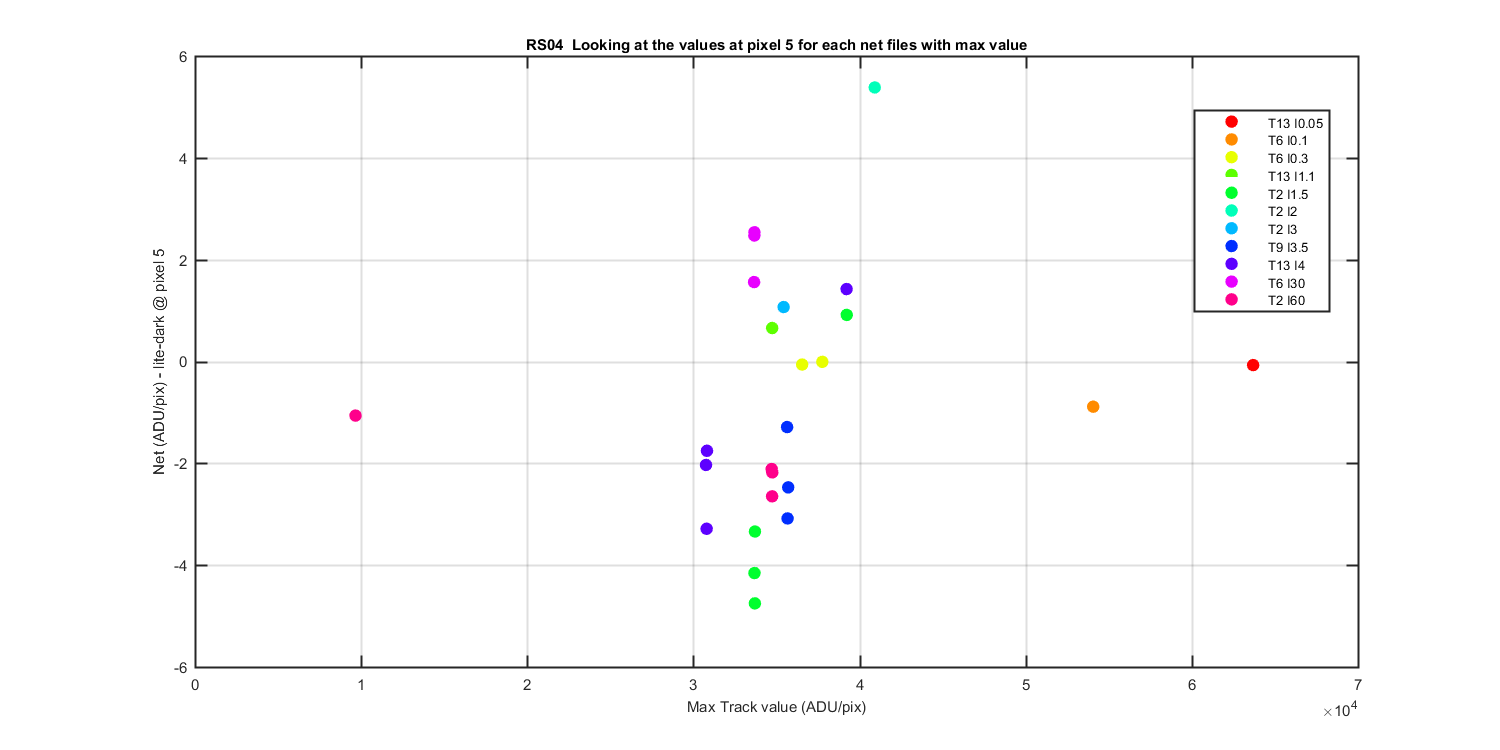
Figure 3 : Shows the pixel 5 values for each net for each days and experiment. Each dot is a net from each dataset collected on each day. Why are they negative?
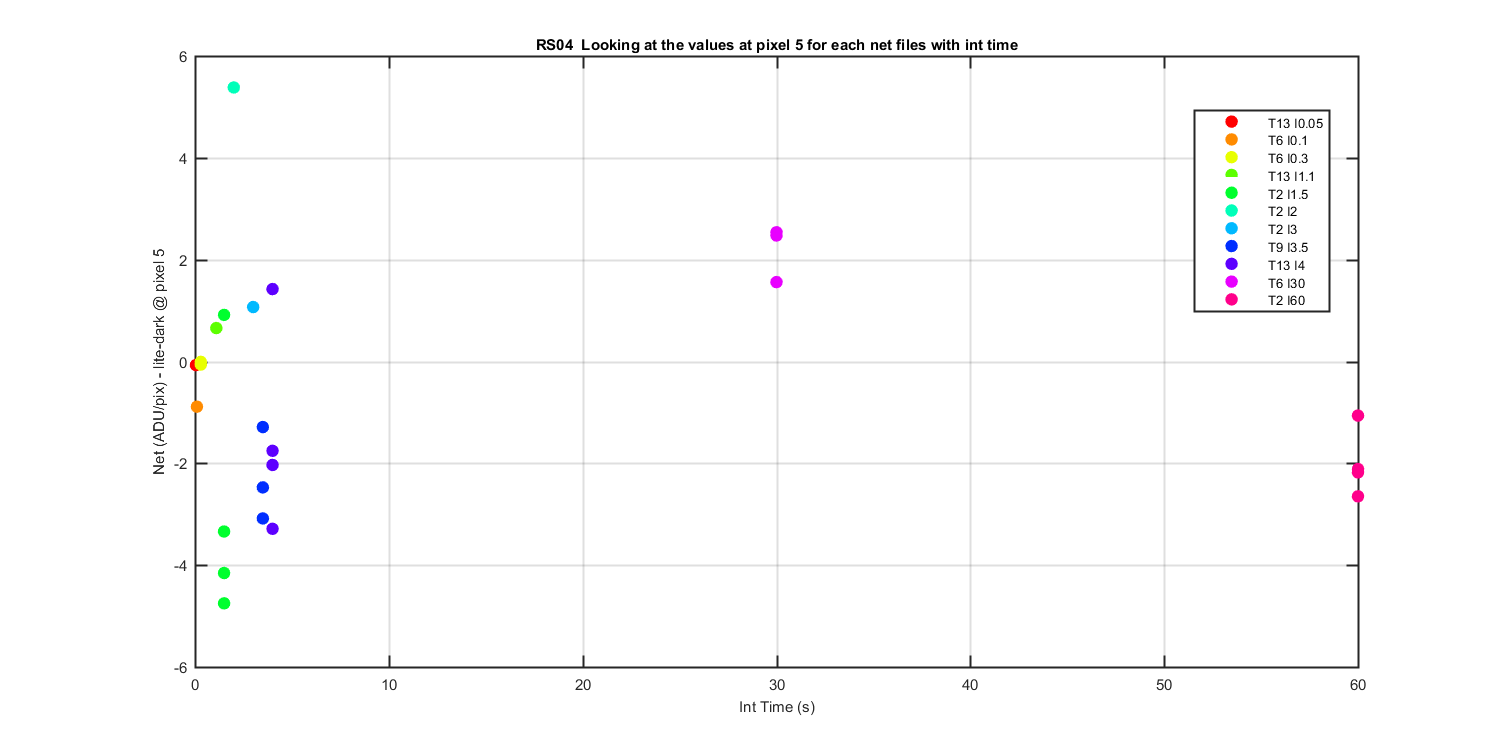
Figure 4 : Shows the pixel 5 values for each net for each days and experiment. Each dot is a net from each dataset collected on each day. Why are they negative?
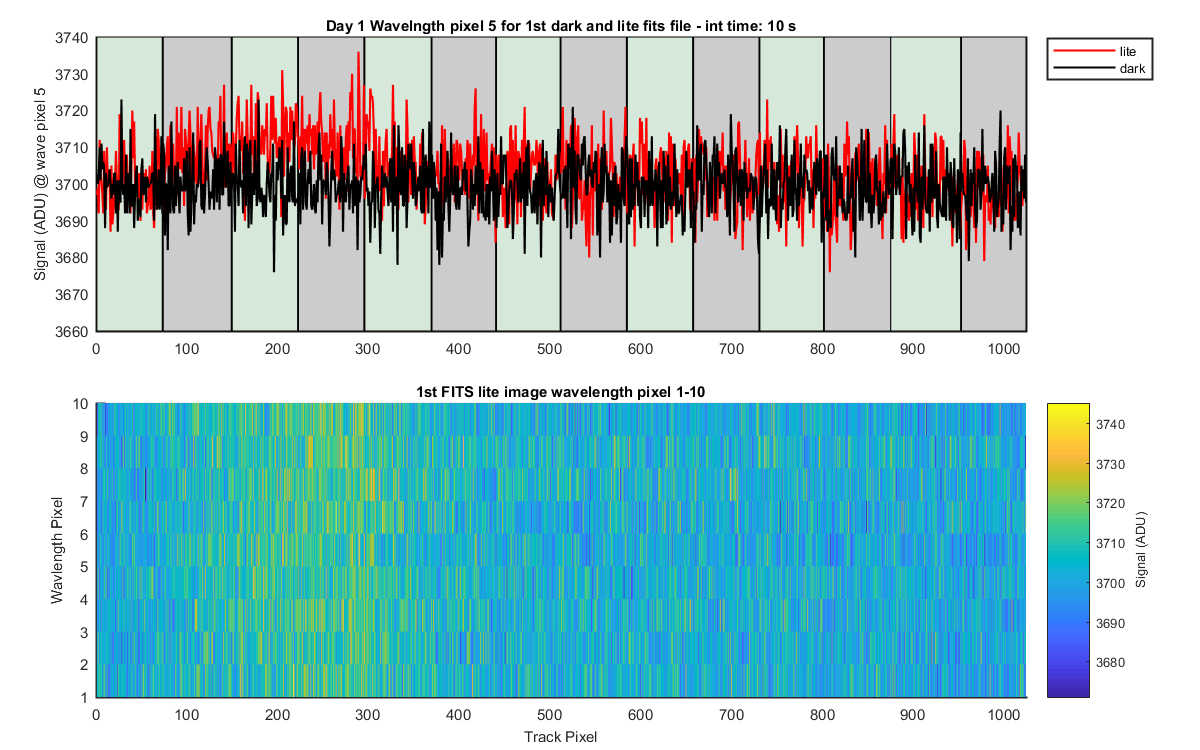
Figure 5 : The top panel shows the cross track values at pixel 5. THis would be wavelength pixel 5 so the line goes across the tracks. For the first days you can barely see the dip in the light track (track 6). The bottom panels is a cutout of one (the first) full fits image file (fits file _001). I pulled out the first 10 pixels (wavelength) the tracks go left to right, wavelength up to down. You can see the dip better here. It gets much bigger when we start taking data on track 9 on day 5.
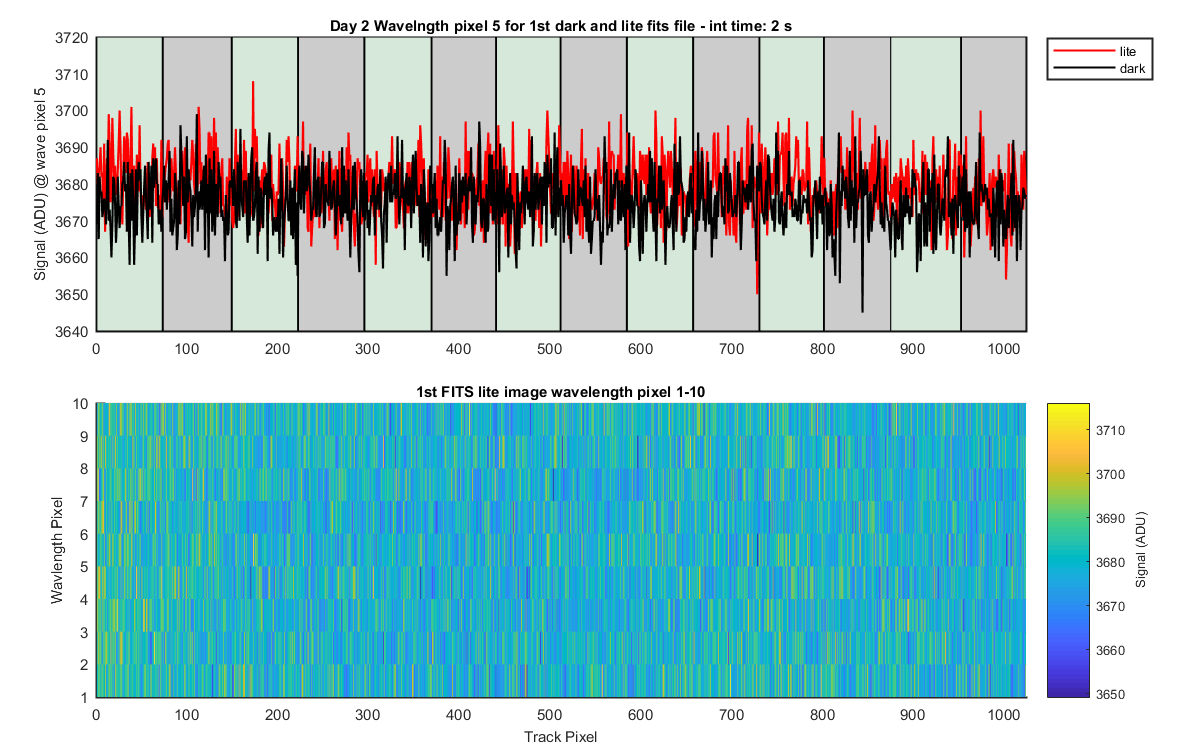
Figure 6 : The top panel shows the cross track values at pixel 5. THis would be wavelength pixel 5 so the line goes across the tracks. For the first days you can barely see the dip in the light track (track 6). The bottom panels is a cutout of one (the first) full fits image file (fits file _001). I pulled out the first 10 pixels (wavelength) the tracks go left to right, wavelength up to down. You can see the dip better here. It gets much bigger when we start taking data on track 9 on day 5.
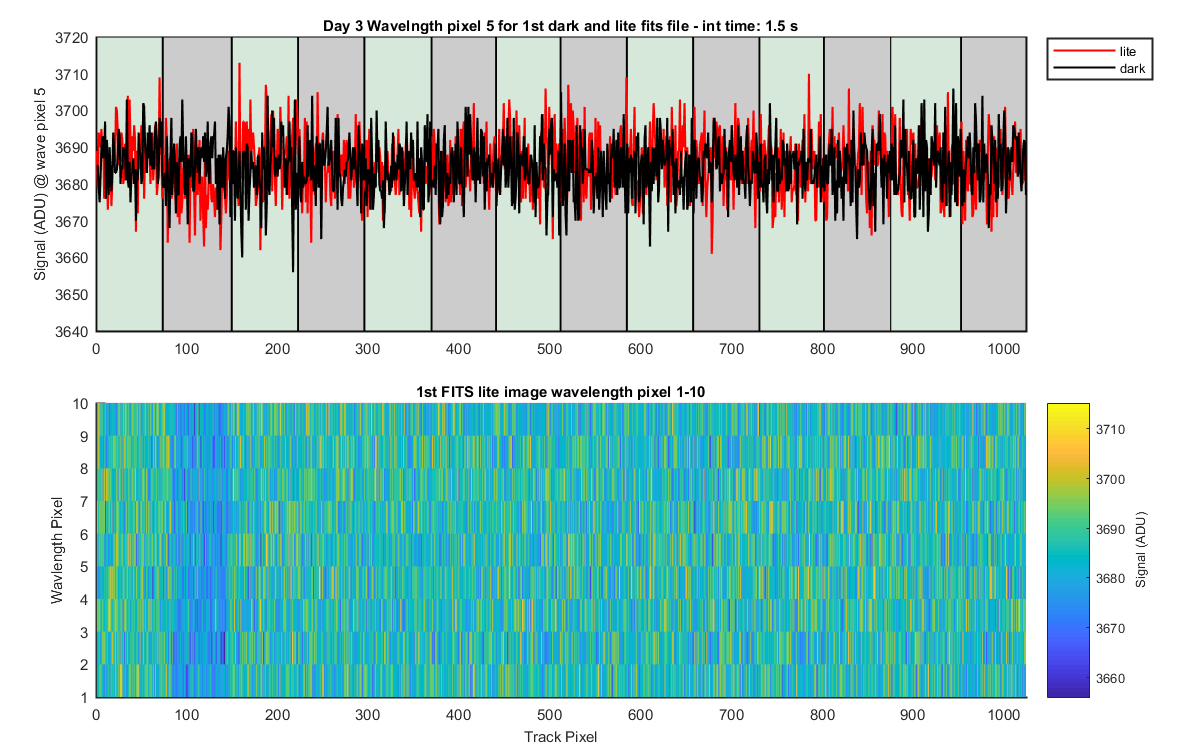
Figure 7 : The top panel shows the cross track values at pixel 5. THis would be wavelength pixel 5 so the line goes across the tracks. For the first days you can barely see the dip in the light track (track 6). The bottom panels is a cutout of one (the first) full fits image file (fits file _001). I pulled out the first 10 pixels (wavelength) the tracks go left to right, wavelength up to down. You can see the dip better here. It gets much bigger when we start taking data on track 9 on day 5.
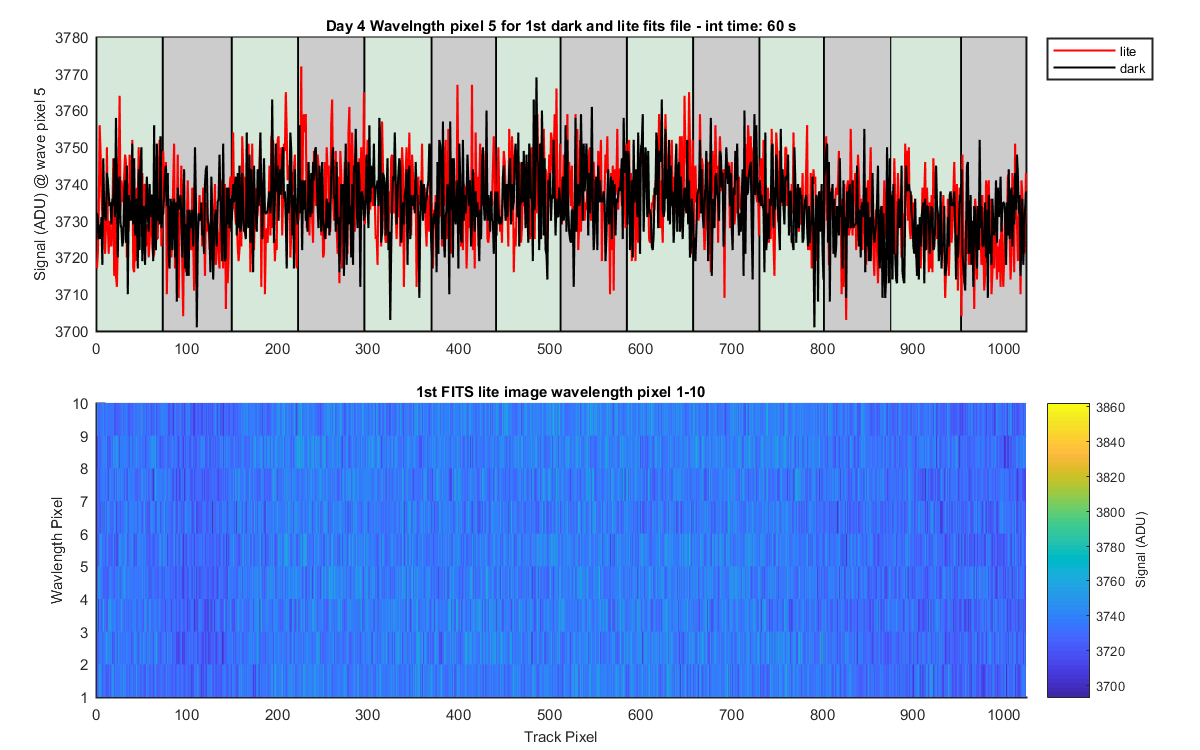
Figure 8 : The top panel shows the cross track values at pixel 5. THis would be wavelength pixel 5 so the line goes across the tracks. For the first days you can barely see the dip in the light track (track 6). The bottom panels is a cutout of one (the first) full fits image file (fits file _001). I pulled out the first 10 pixels (wavelength) the tracks go left to right, wavelength up to down. You can see the dip better here. It gets much bigger when we start taking data on track 9 on day 5.
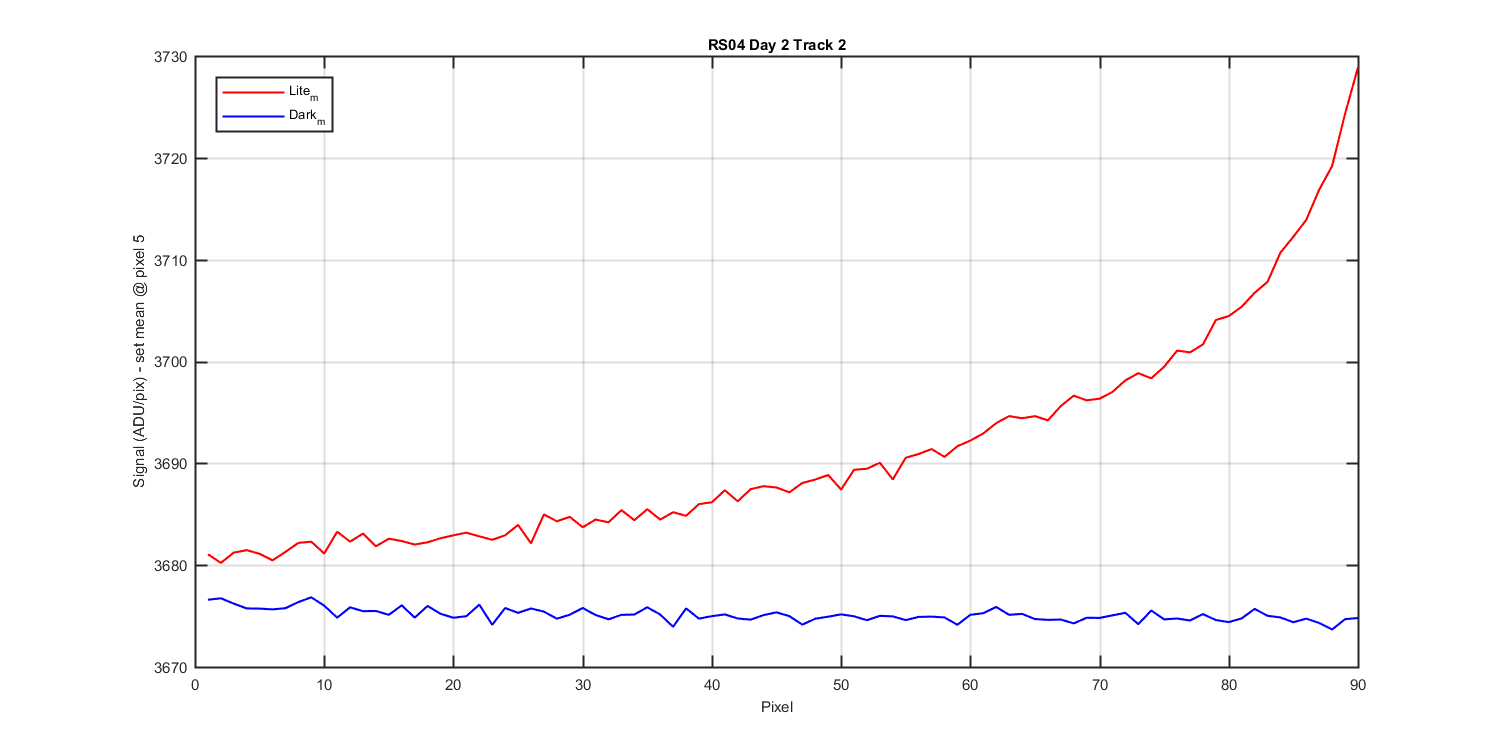
Figure 9 : Shows the mean dark and lite for each data set you can see why the net files are negative at the lower pixels. They get even lower on day 5 when we start using track 9. What is going on?
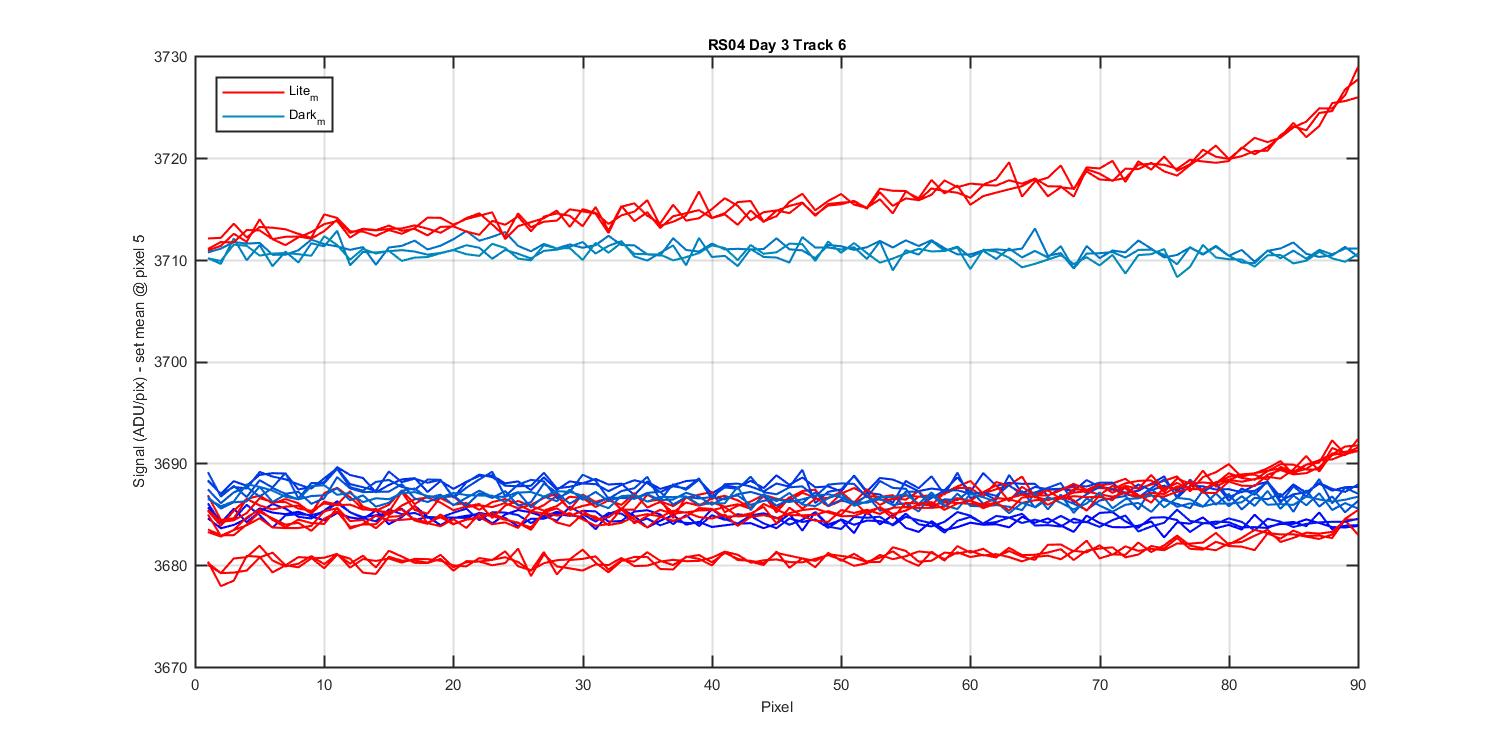
Figure 10 : Shows the mean dark and lite for each data set you can see why the net files are negative at the lower pixels. They get even lower on day 5 when we start using track 9. What is going on?
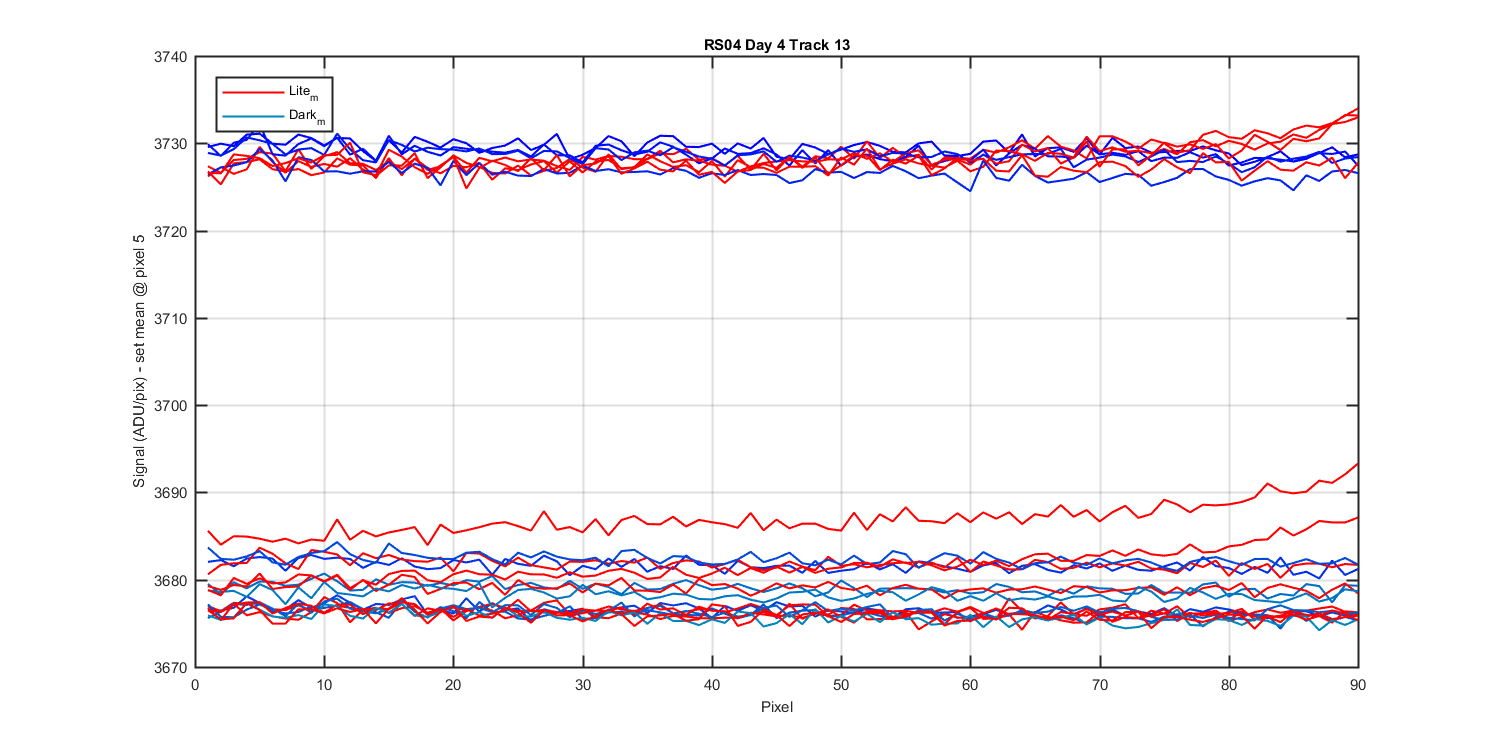
Figure 11 : Shows the mean dark and lite for each data set you can see why the net files are negative at the lower pixels. They get even lower on day 5 when we start using track 9. What is going on?