REVISION DATE: 05-May-2016 16:40:32
Comparing the Solar Fraunhofer lines before and after the BS01 was shipped to Miami. Hawaii-2016-02 is the BS01 data before shipping to Miamii (als H1602 or Haw-2016-02 in the title and legend)
Using the wavecal from Hawaii-2016-02 I have plotted the two date sets. They are on VERY different scale so for most of the graphs I have normaized the data to the max value for the track. I have also only plotted the track 8 data since the Hawaii-2016-02 solar data is for track 8 only. I have to not use three fraunhofer lines because you can not see them in the Miami data.
| Fraun | M1601 pixel | H1602 pixel | Movement (pixel) |
|---|---|---|---|
| 486.1 | 427 | 429 | -2 |
| 517.2 | 515 | 517 | -2 |
| 589 | 721 | 722 | -1 |
| 589.6 | 721 | 722 | -1 |
| 656.3 | 909 | 910 | -1 |
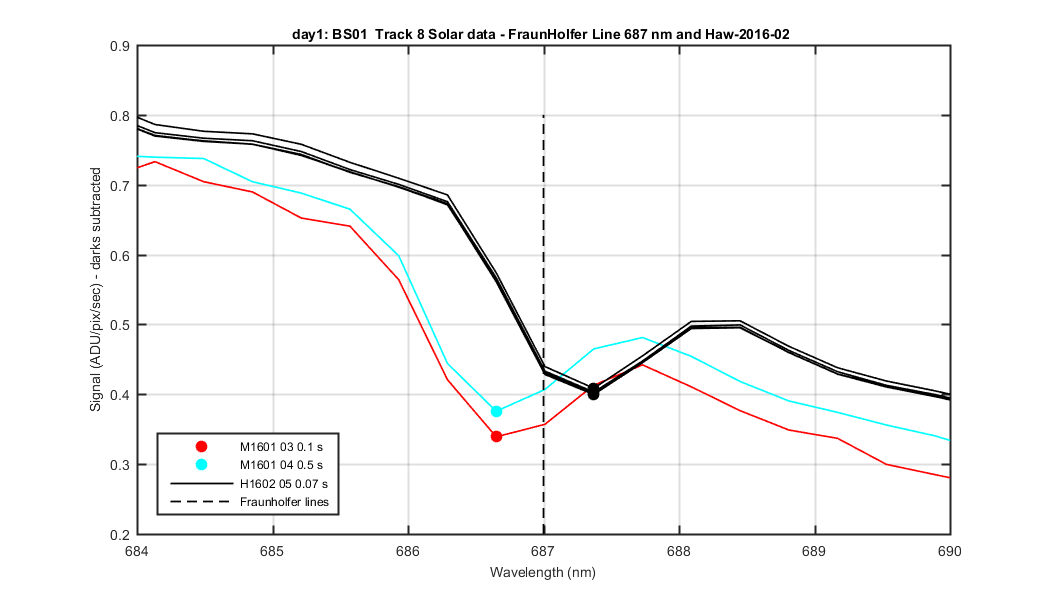
| 687 | 995 | 997 | -2 |
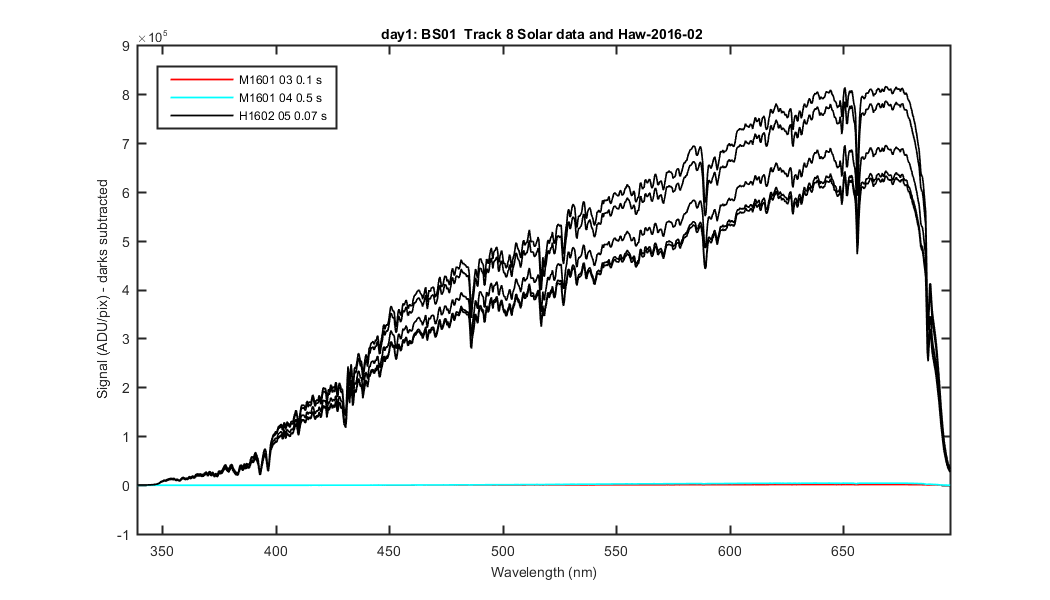
2 sets of solar data from Miami and 5 sets of Solar data from Hawaii. The data plotted are the track mean (hence the /pix) but is not divided by integration time. Darks are subtracted. The scales are VERY DIFFERENT.
Figure 1
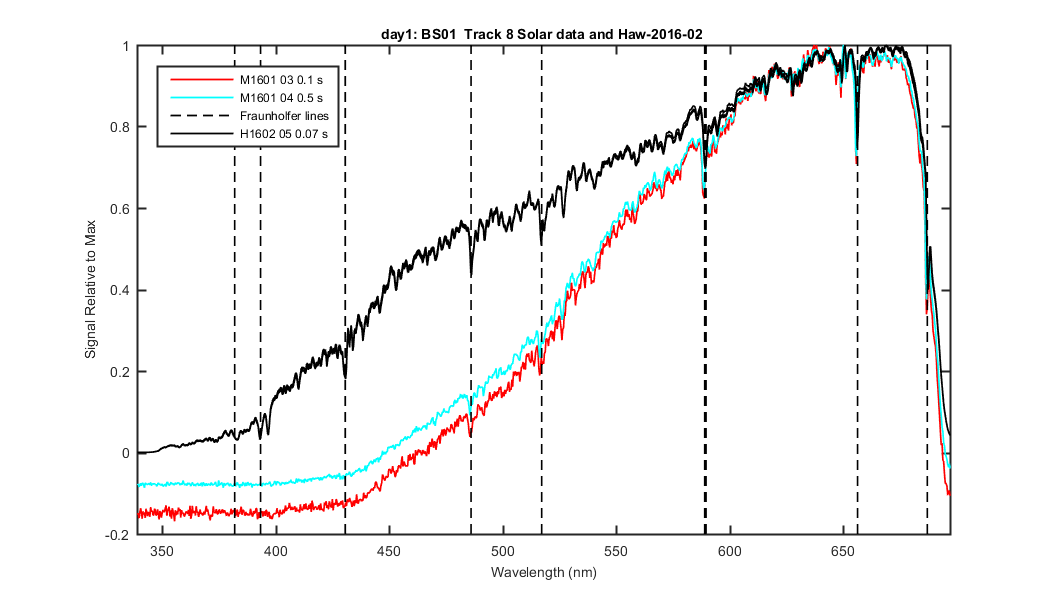
Same as above but divided by integration time and normalized to the max for the track. Looks like the response changed????
Figure 2
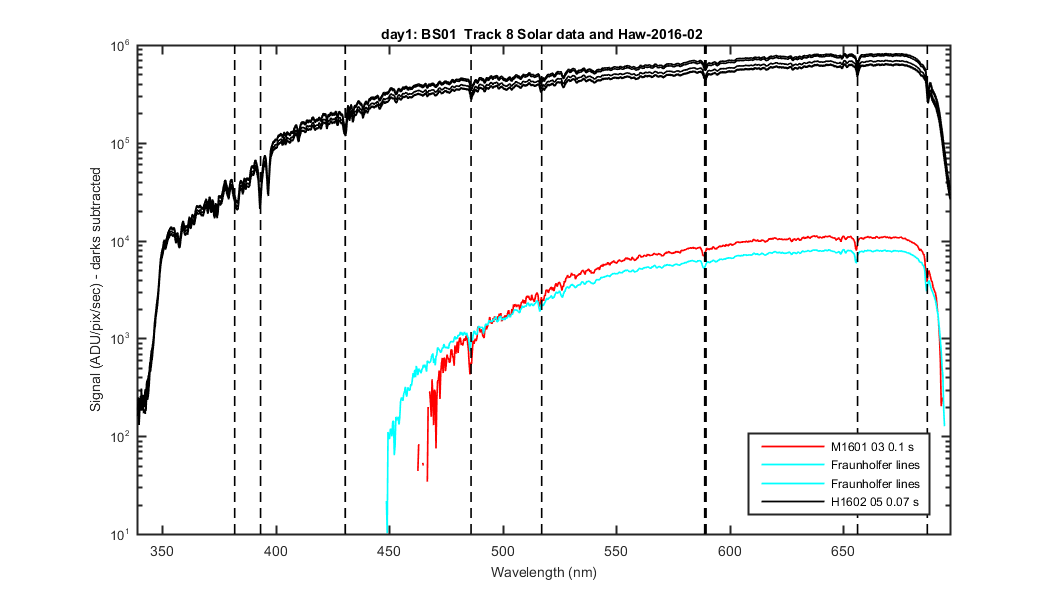
Same as above but logged, not normalized. you can see the scale difference
Figure 3
So these are the normalized data again but zoomed into each Fraunhofer line.
Figure 4
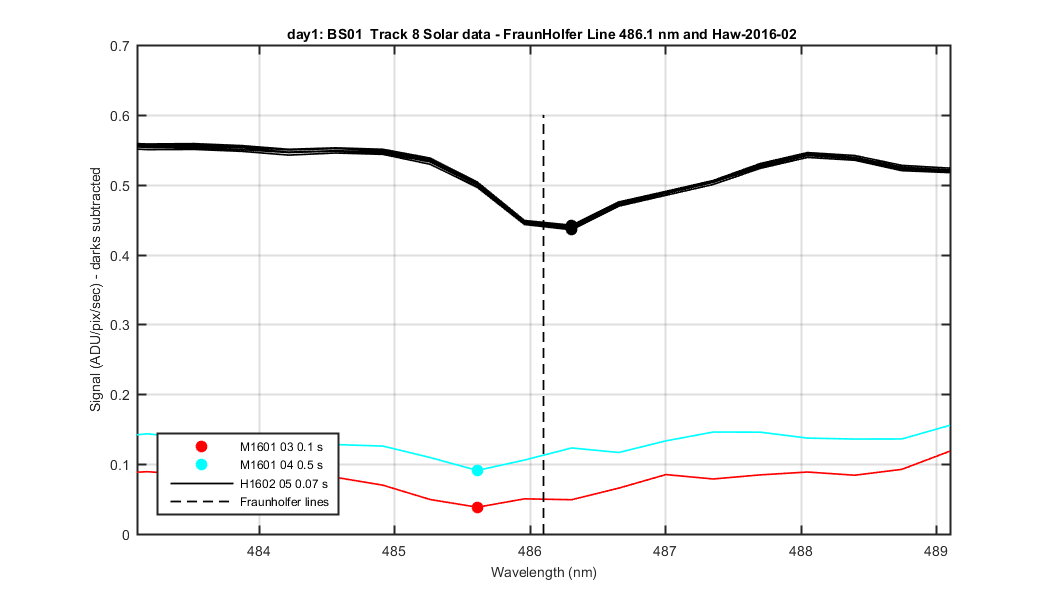
Figure 5
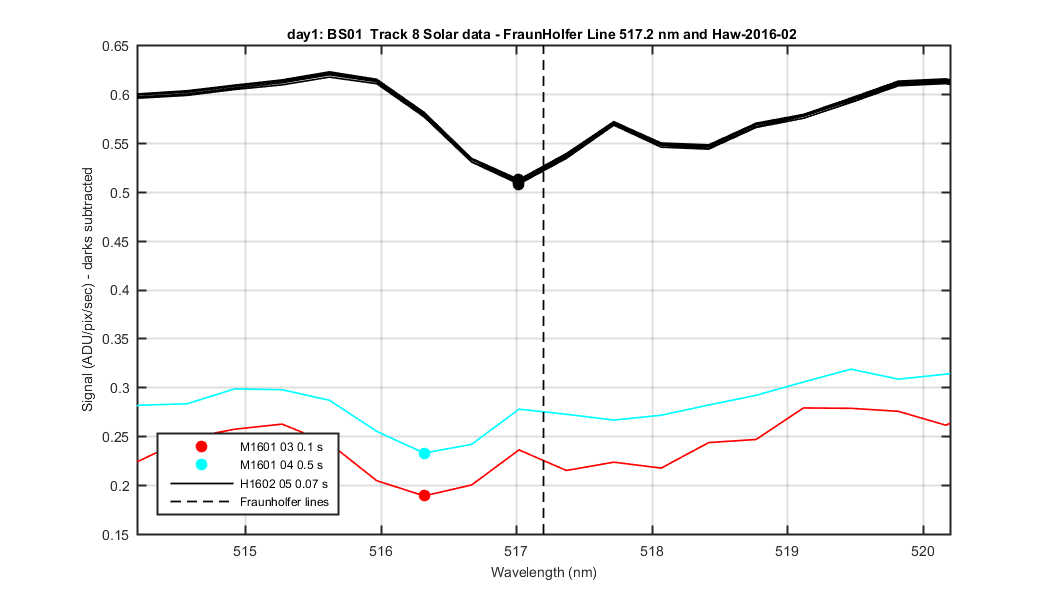
Figure 6
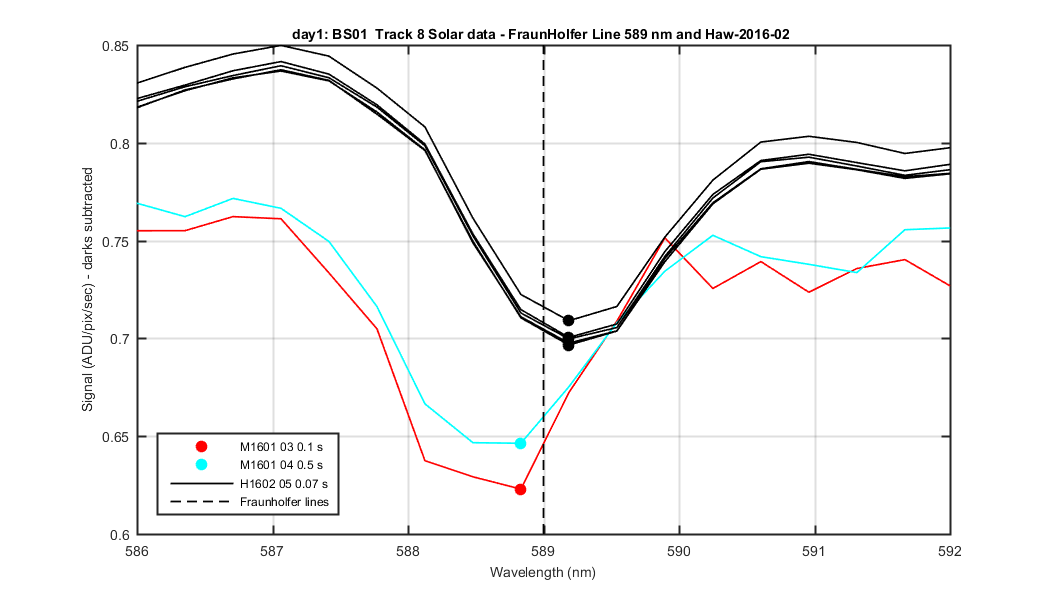
Figure 7
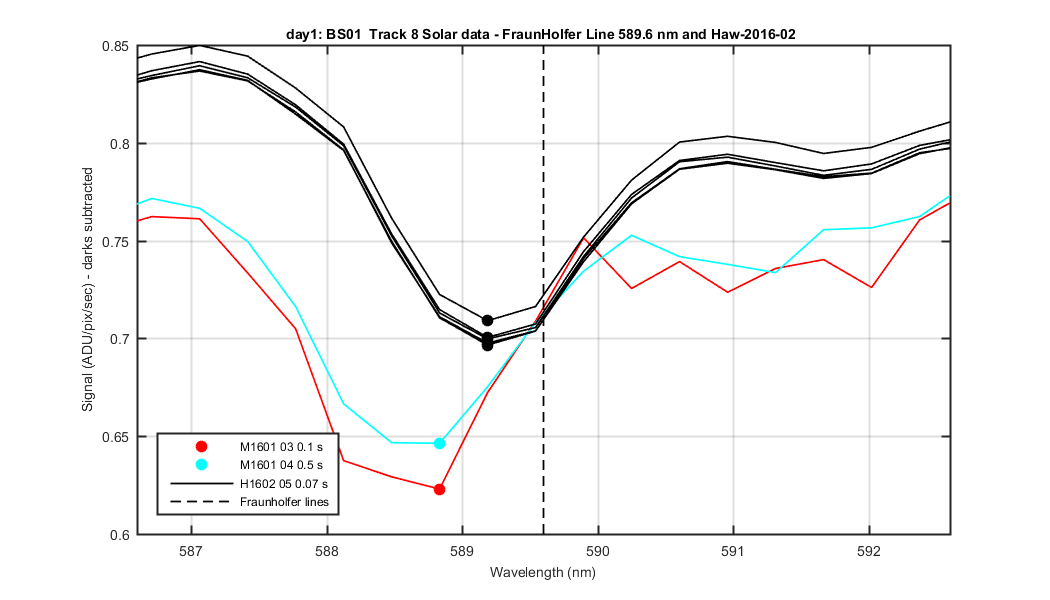
Figure 8
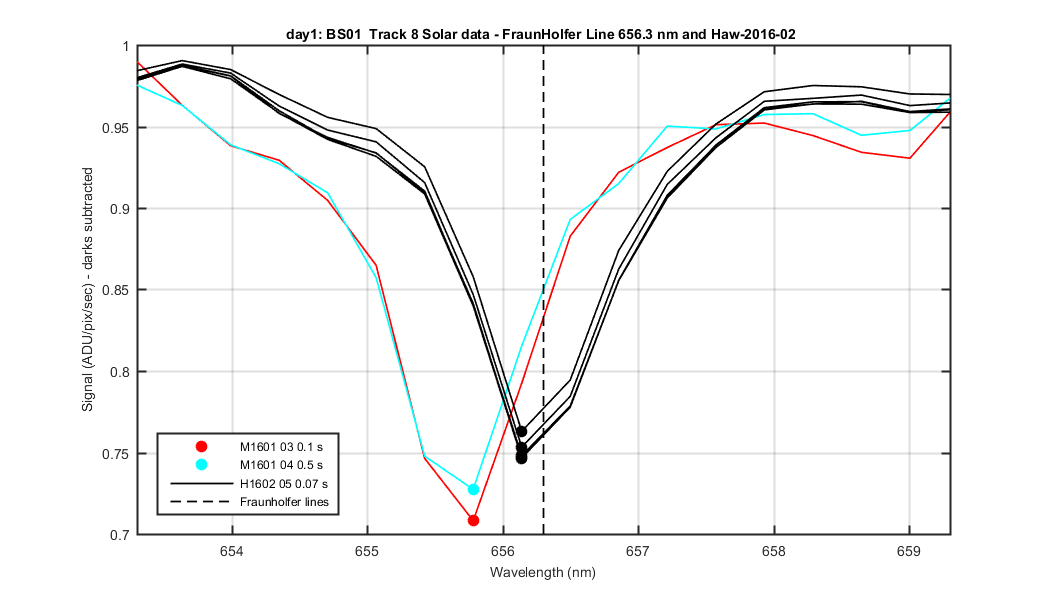
Figure 9