REVISION DATE: 05-May-2016 14:56:01
Solar scans from Miami. The darks are off by a lot. But this is to look at the wavelength changes if any during shipping.
This is a copy of the page from Hawaii-2015-02 Page Number 7.01, if you want to compare the data
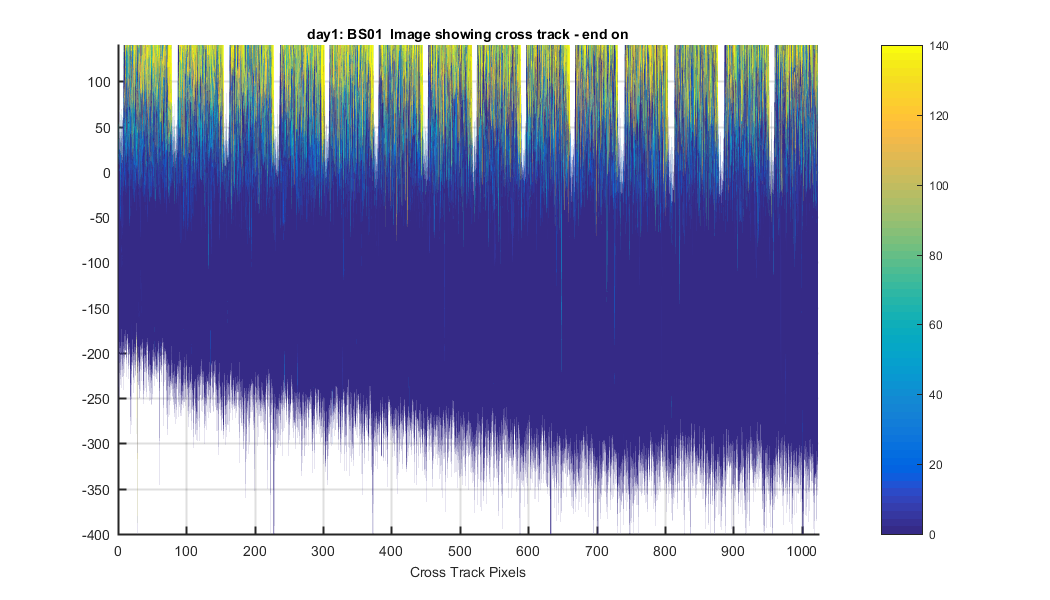
Figure 1
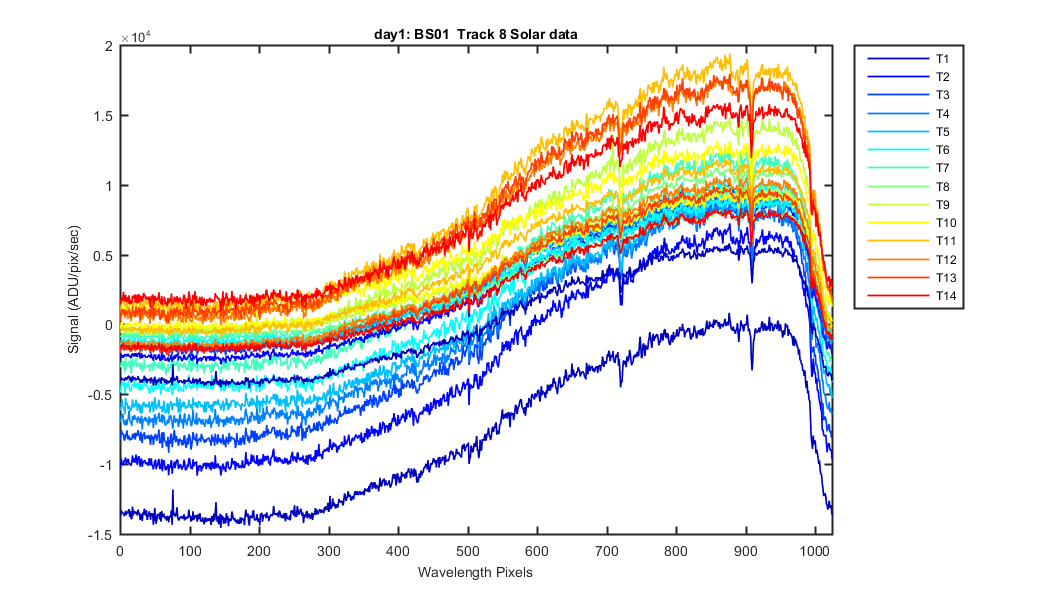
The Solar data with darks subtracted and these are track means but not divided by integration time.
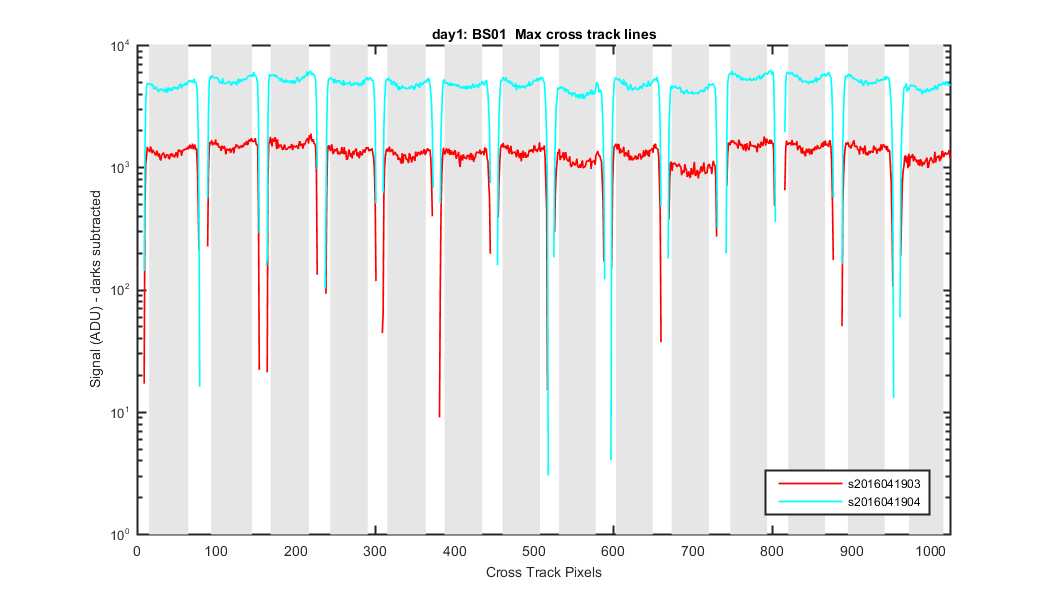
Figure 2
The Solar data divided by integration times.
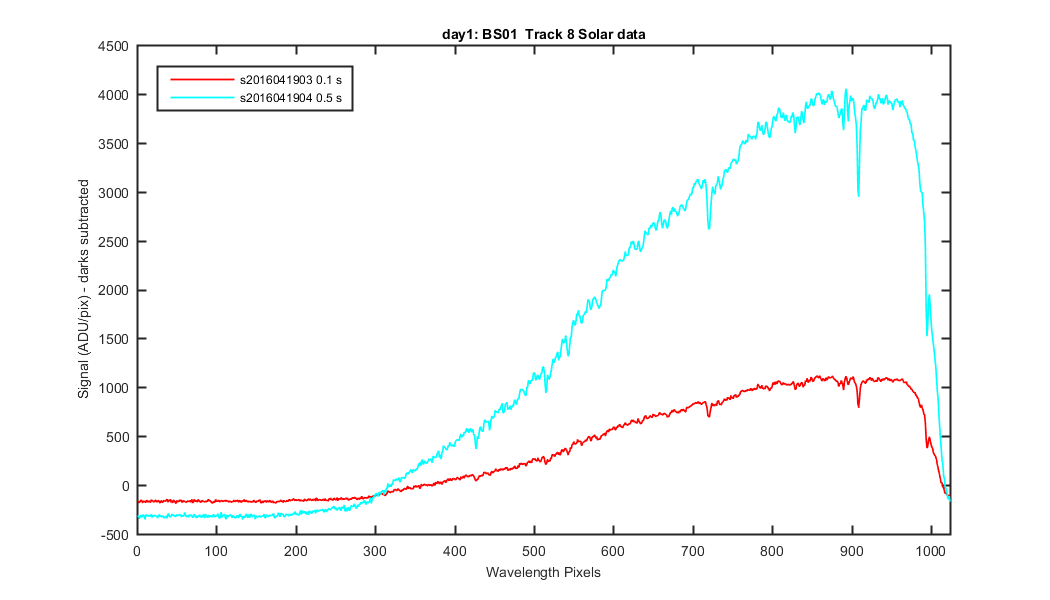
Figure 3
I also wanted to look at the other tracks data
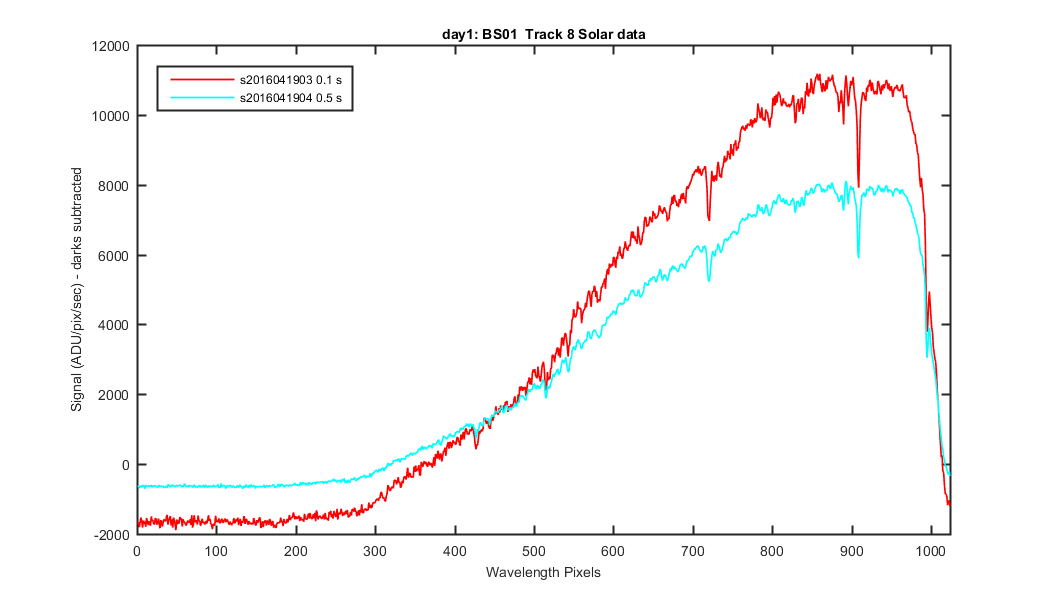
Figure 4
A zoom in of the image from the last file where you use to be able to see the IR artifact. All gone now.
Figure 5
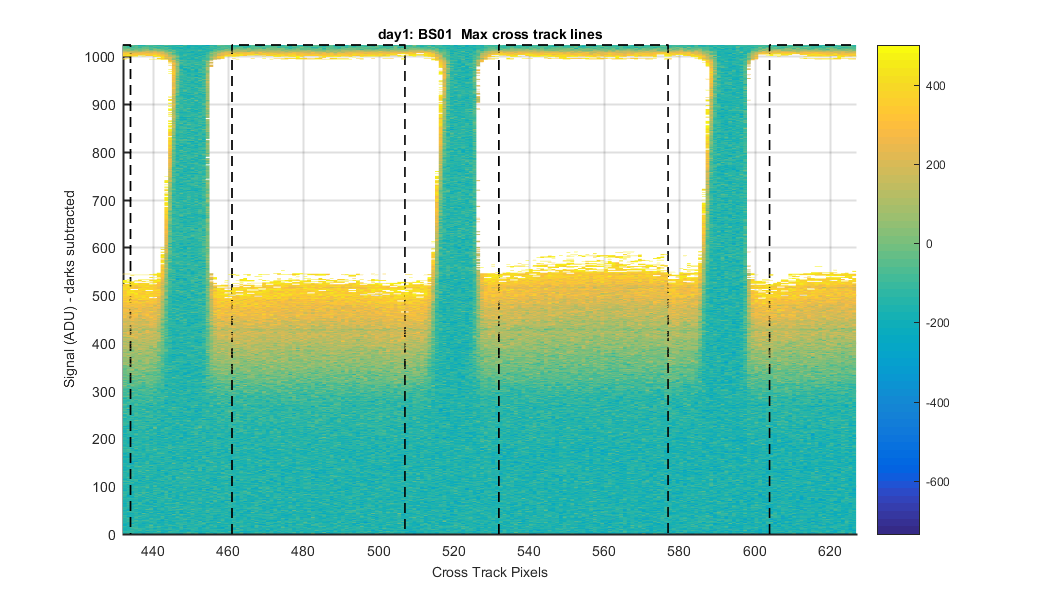
A zoom in of the image from the last file so you can see the feature on track 8 at pixel 0-30. Interetsing. Any idea what this is???? It increases the UV cross track by A LOT. Seems to appear only on track 7.
Figure 6
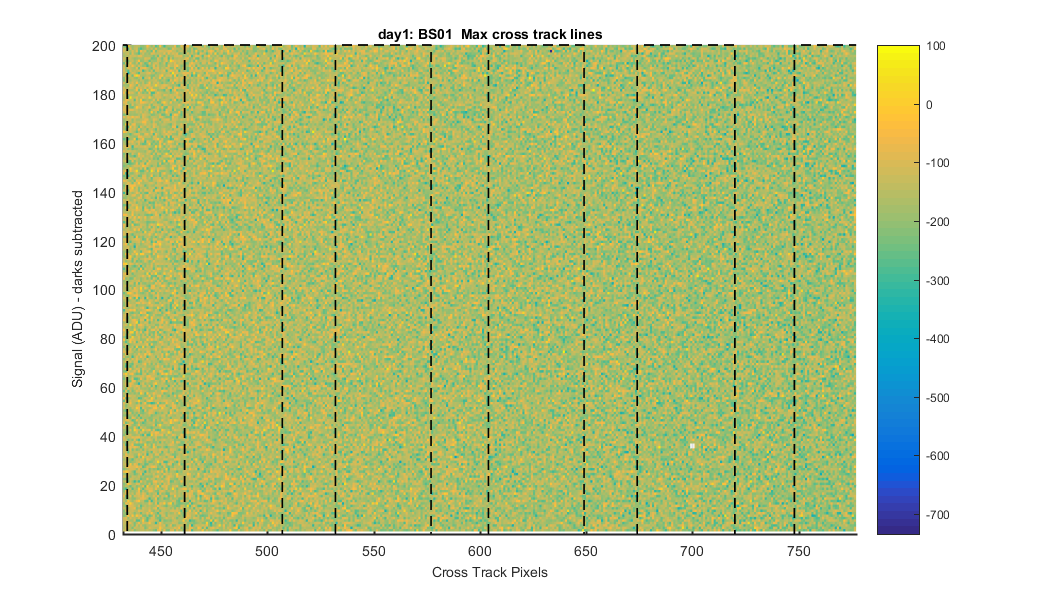
Figure 7
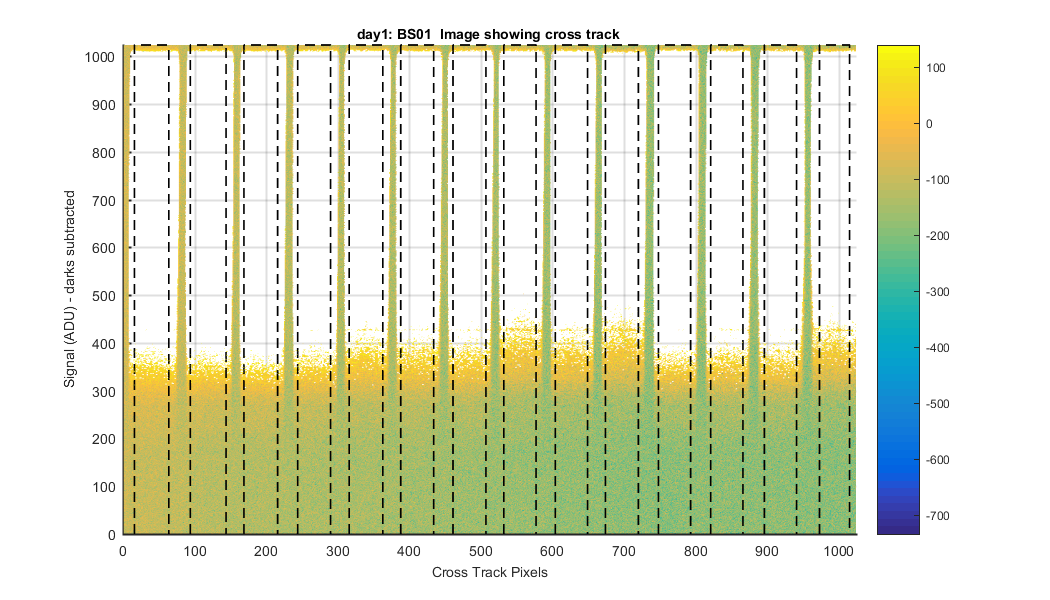
Figure 8