REVISION DATE: 27-Sep-2018 15:16:01
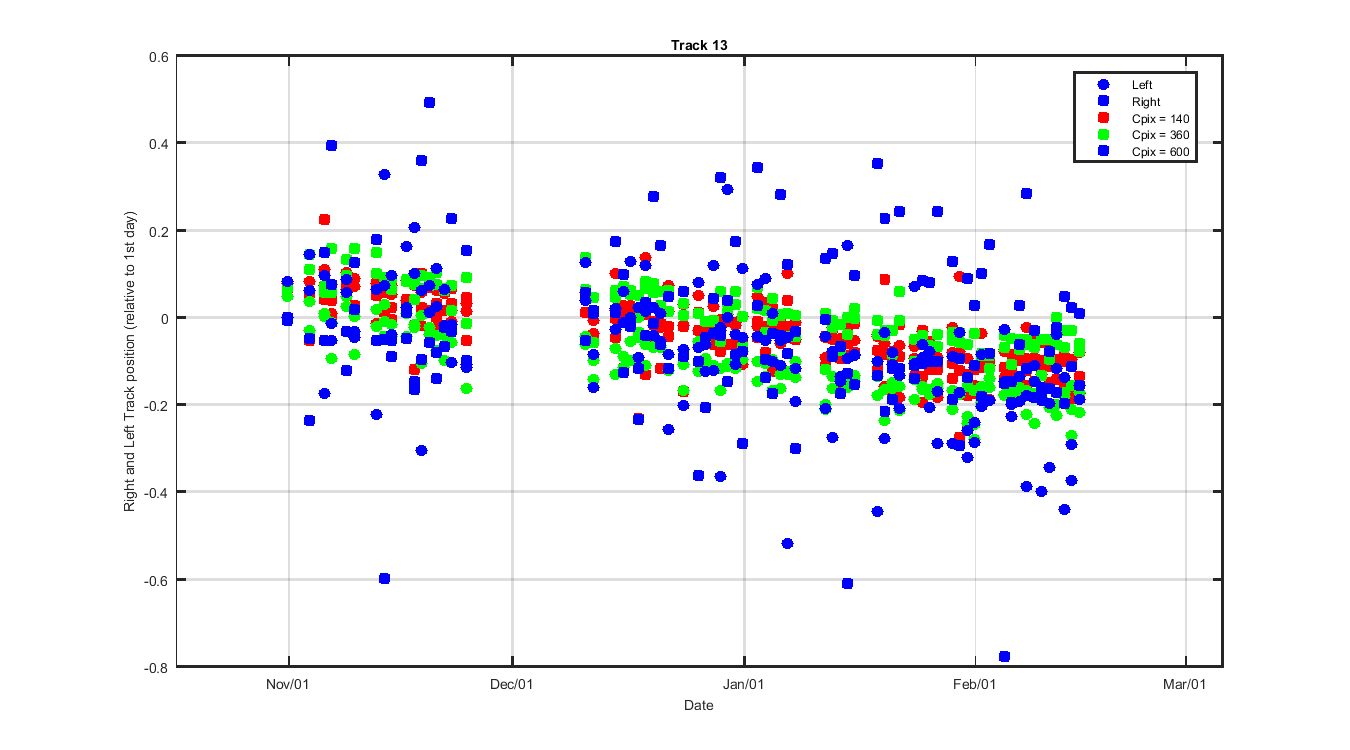
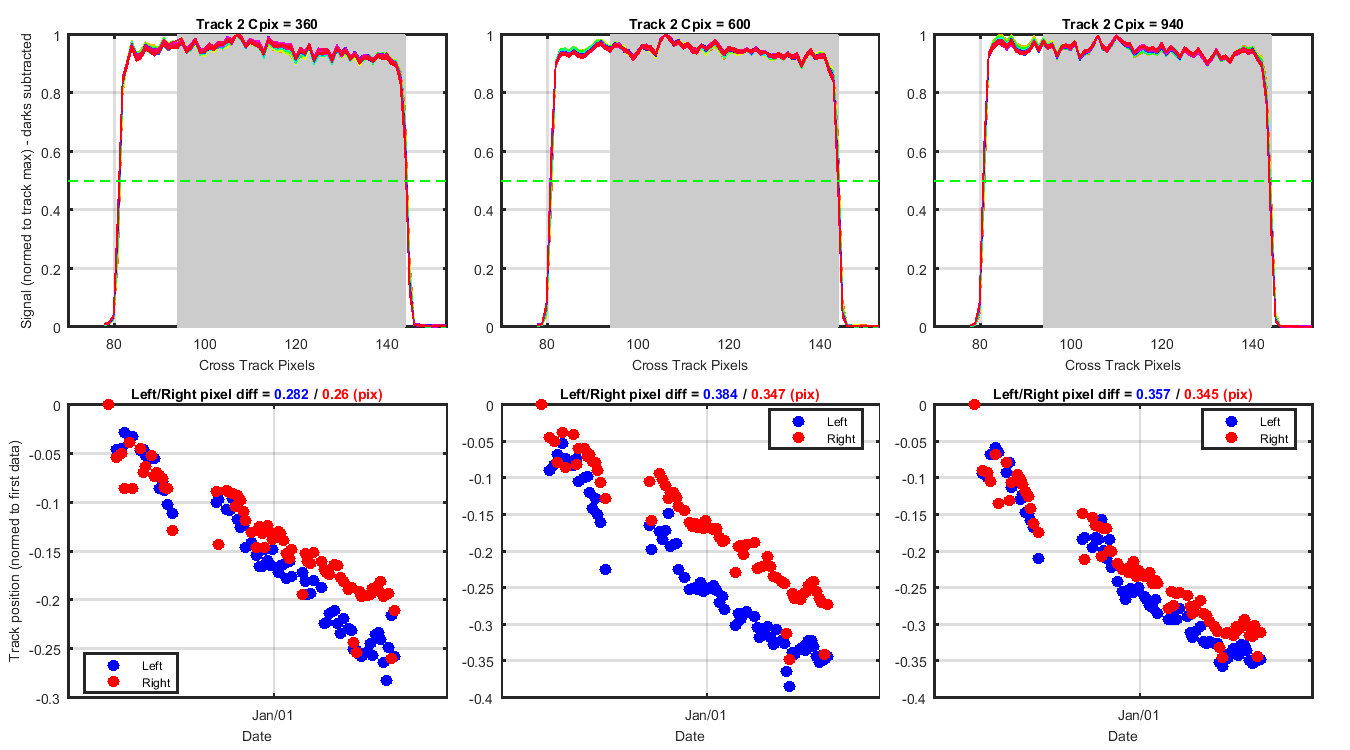
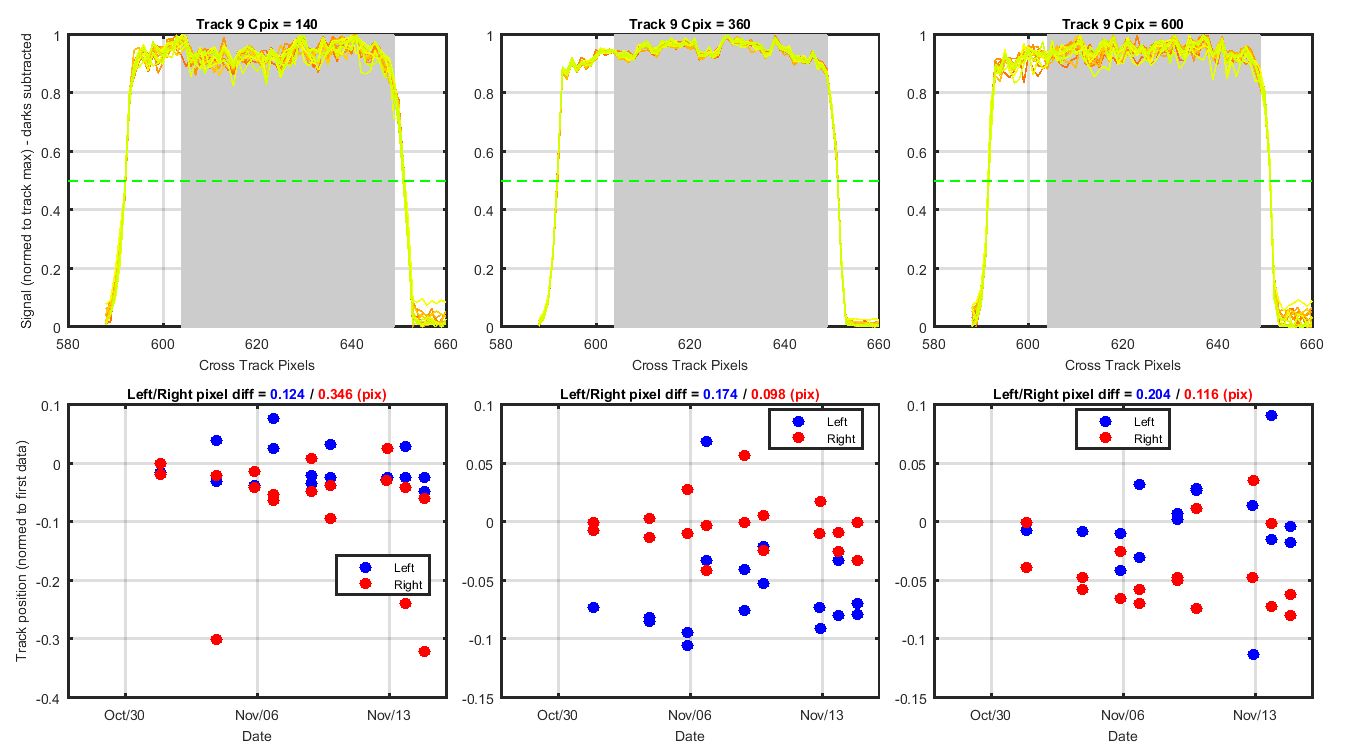
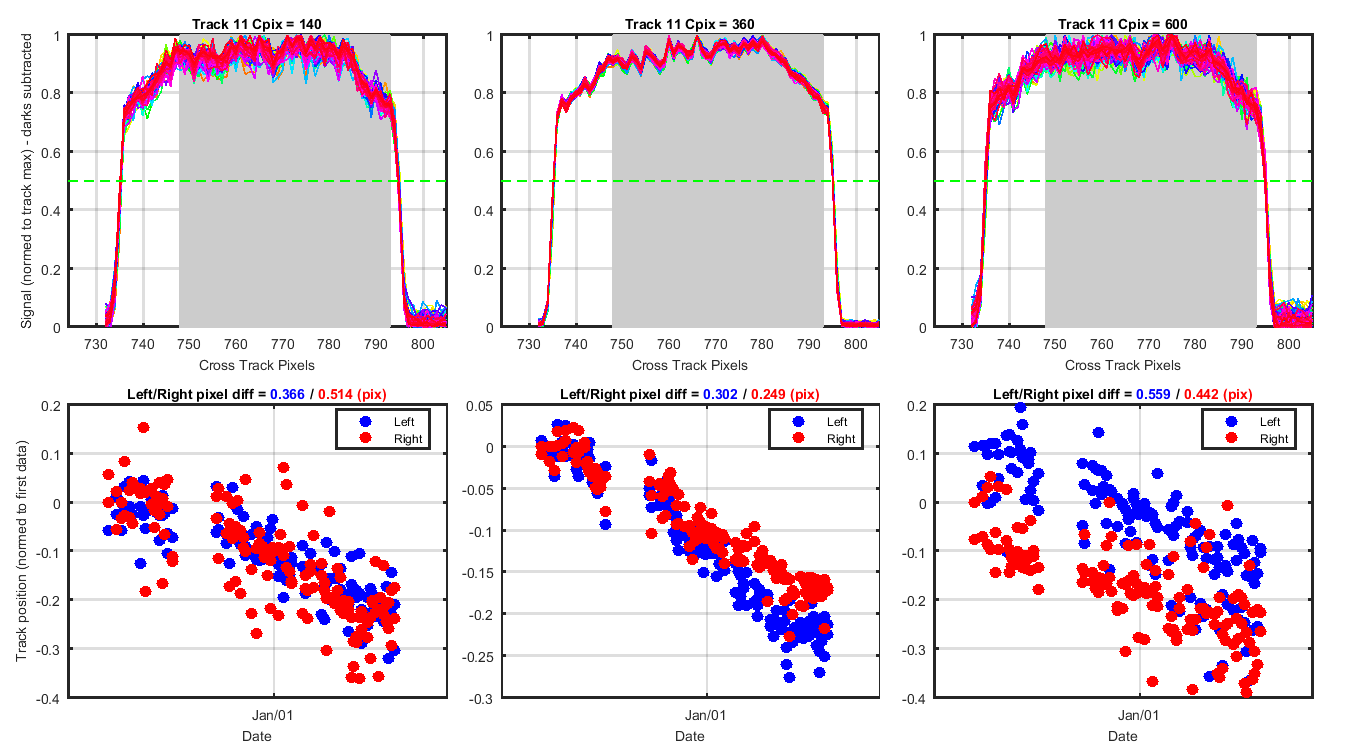
Looks at track movement for in-water data collected so far. This is only for the tracks with light on them so the unused tracks are not included. For each file and track I normalized the track to its max value and plotted this for each file. Then I found where the right and left edge of each track crossed the 50% line. These track positions are plotted on the right panel below. I removed track with the shutters closed and tracks that where saturated (if any).
Track Defintions (grey patchs below):
Track #: Left Right
1: 16 64
2: 94 144
3: 169 216
4: 244 290
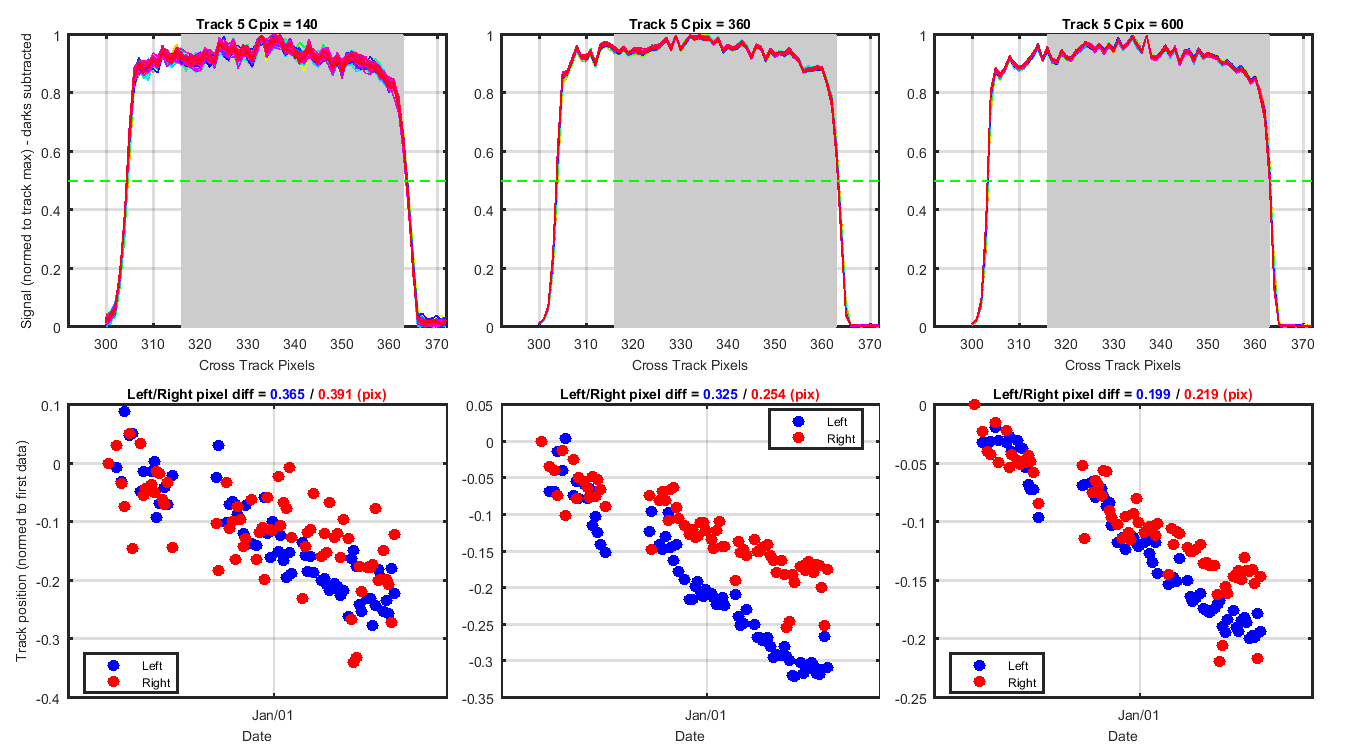
5: 316 363
6: 388 434
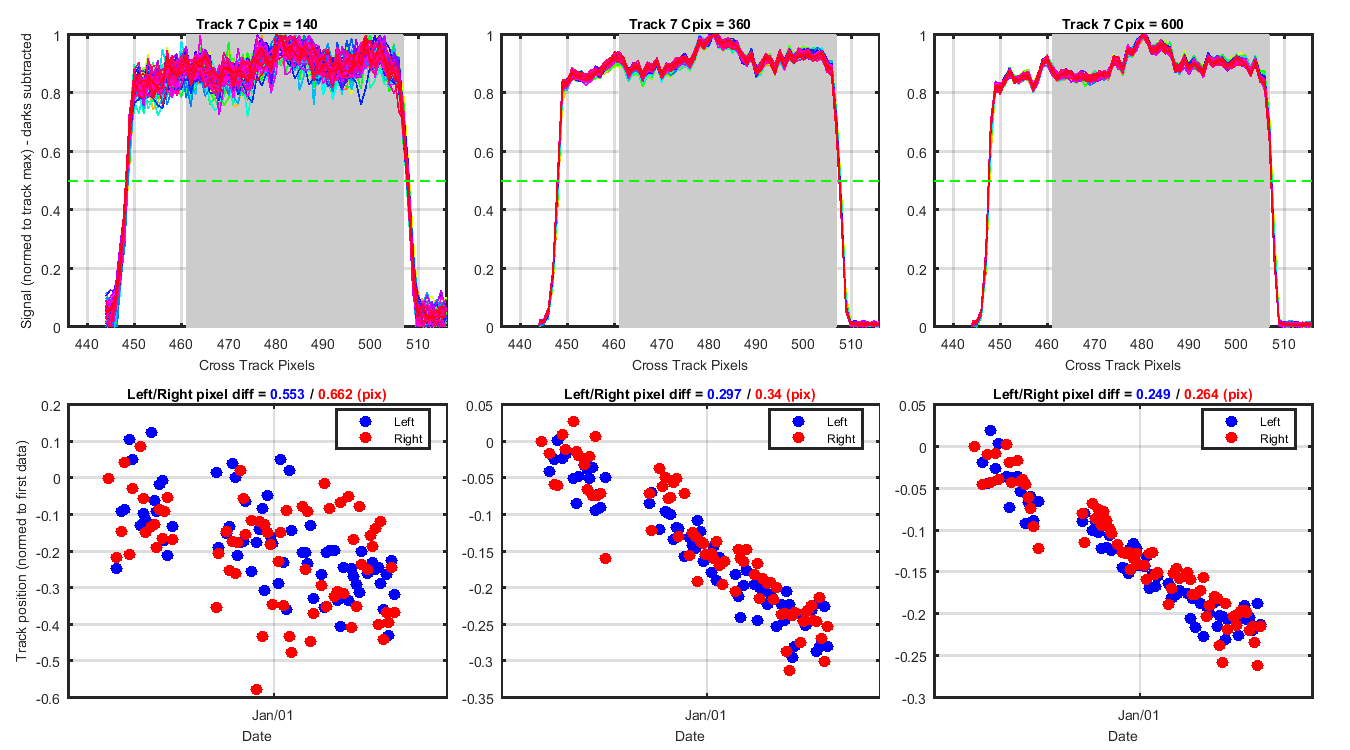
7: 461 507
8: 532 577
9: 604 649
10: 674 720
11: 748 793
12: 821 866
13: 896 941
14: 973 1015
Figure 1
EdMid - Track 5 - Track movement for 3 cross track pixels.
Figure 2
EdBot - Track 7 - Track movement for 3 cross track pixels.
Figure 3
LuTop - Track 9 - Track movement for 3 cross track pixels.
Figure 4
LuMid - Track 11 - Track movement for 3 cross track pixels.
Figure 5
LuBot - Track 13 - Track movement for 3 cross track pixels.
Figure 6
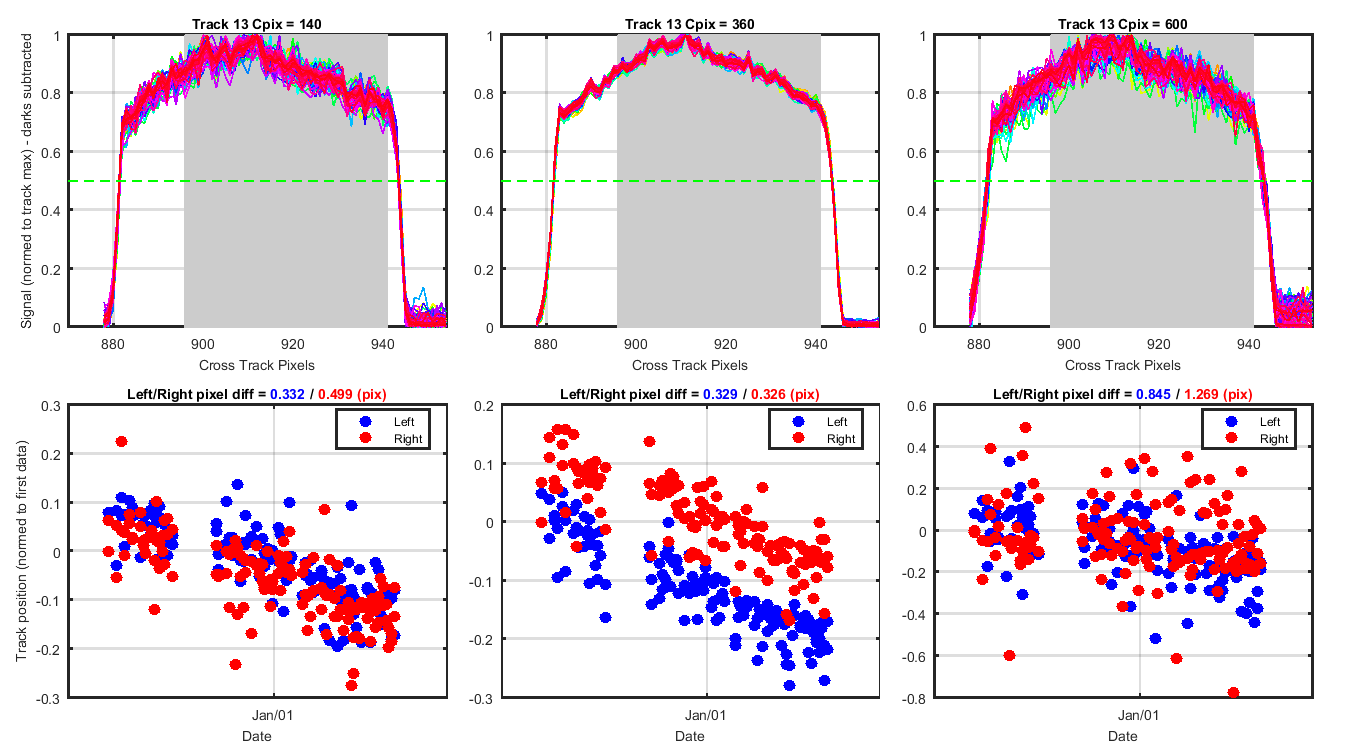
Figure 7
Figure 8
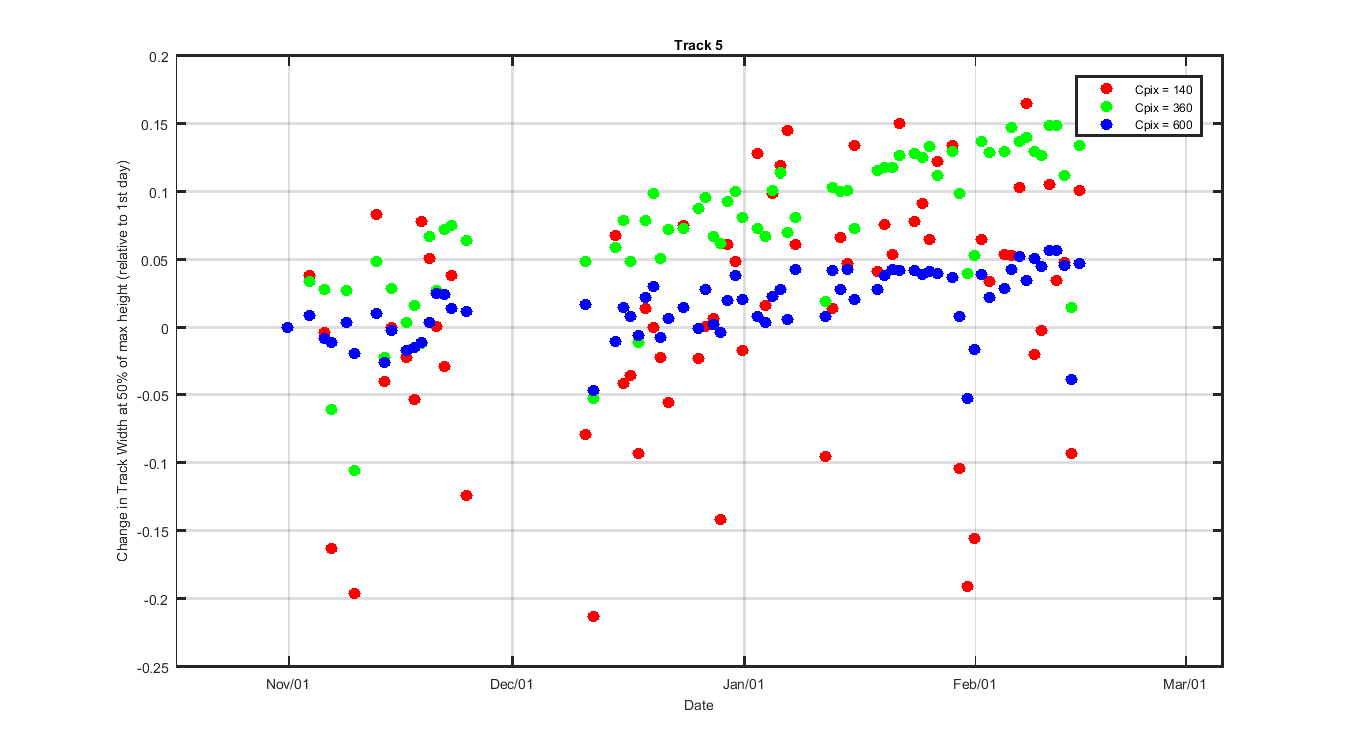
Figure 9
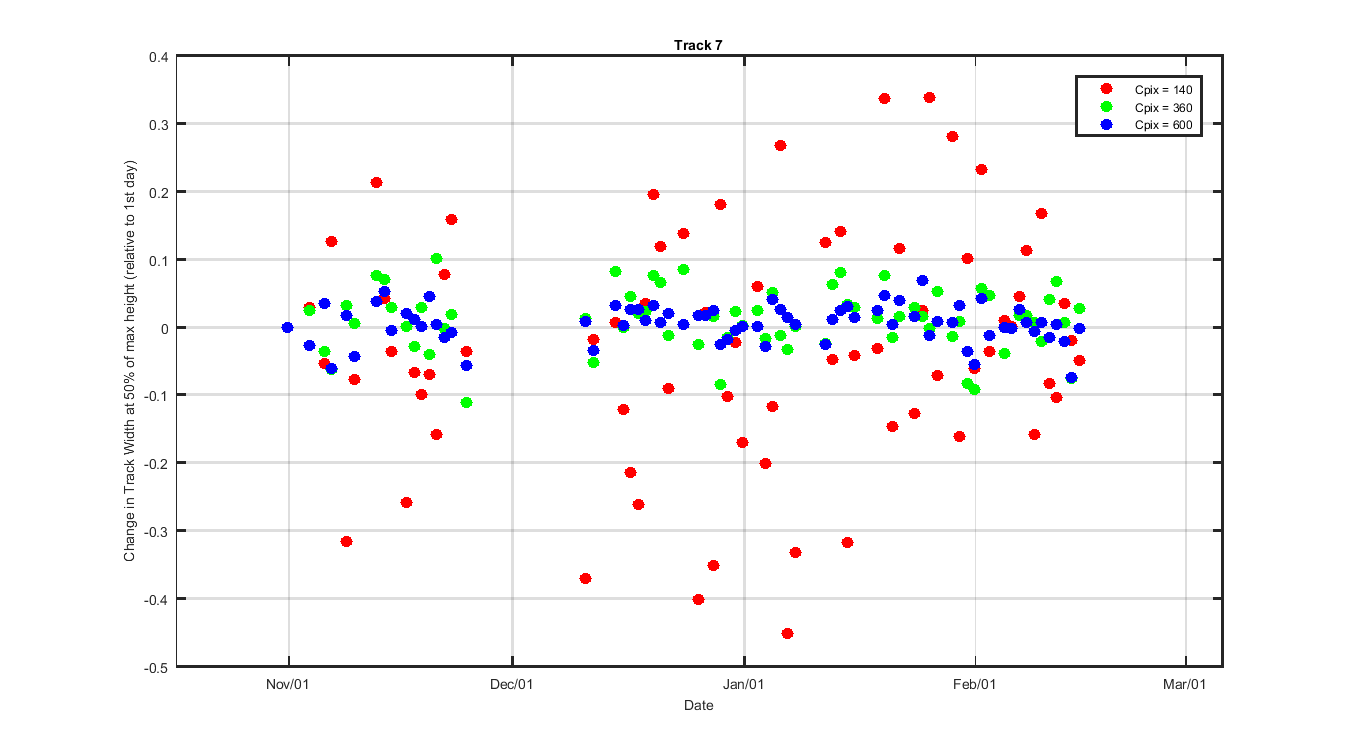
Figure 10
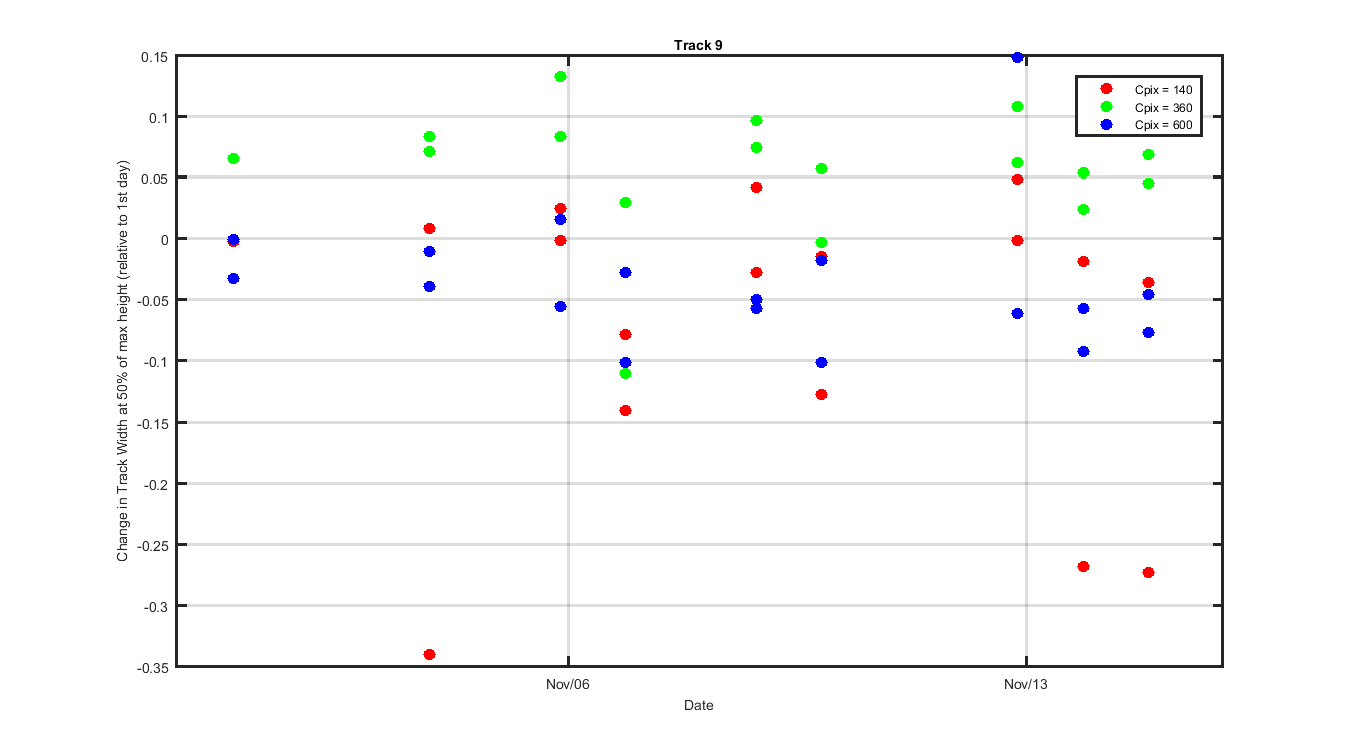
Figure 11
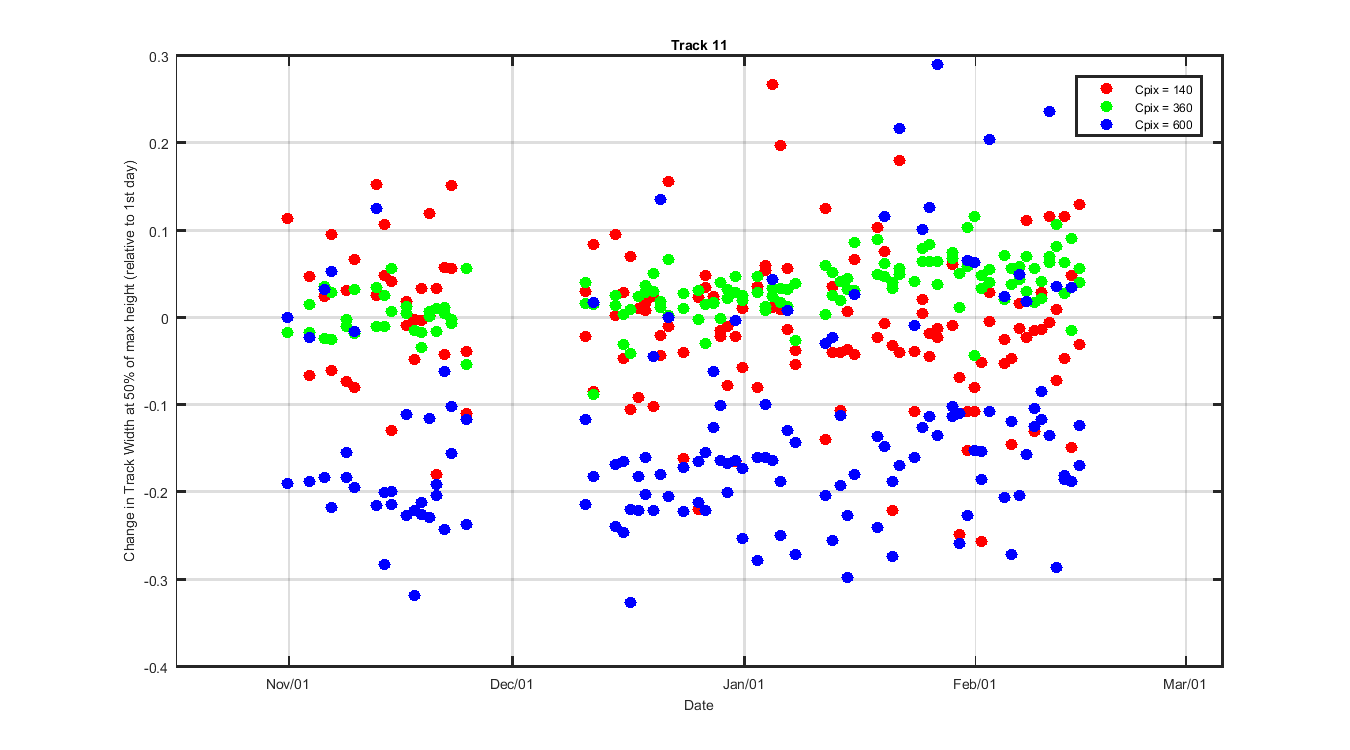
Figure 12
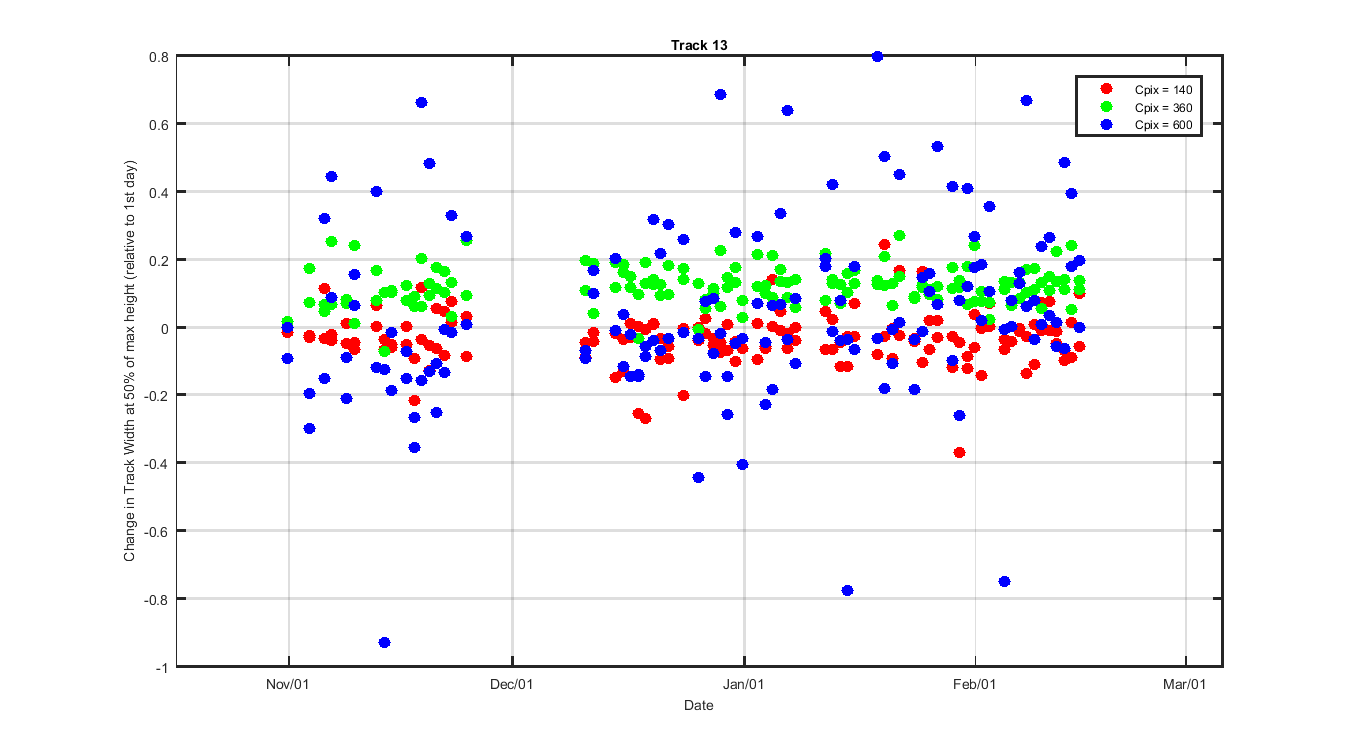
Figure 13
Figure 14
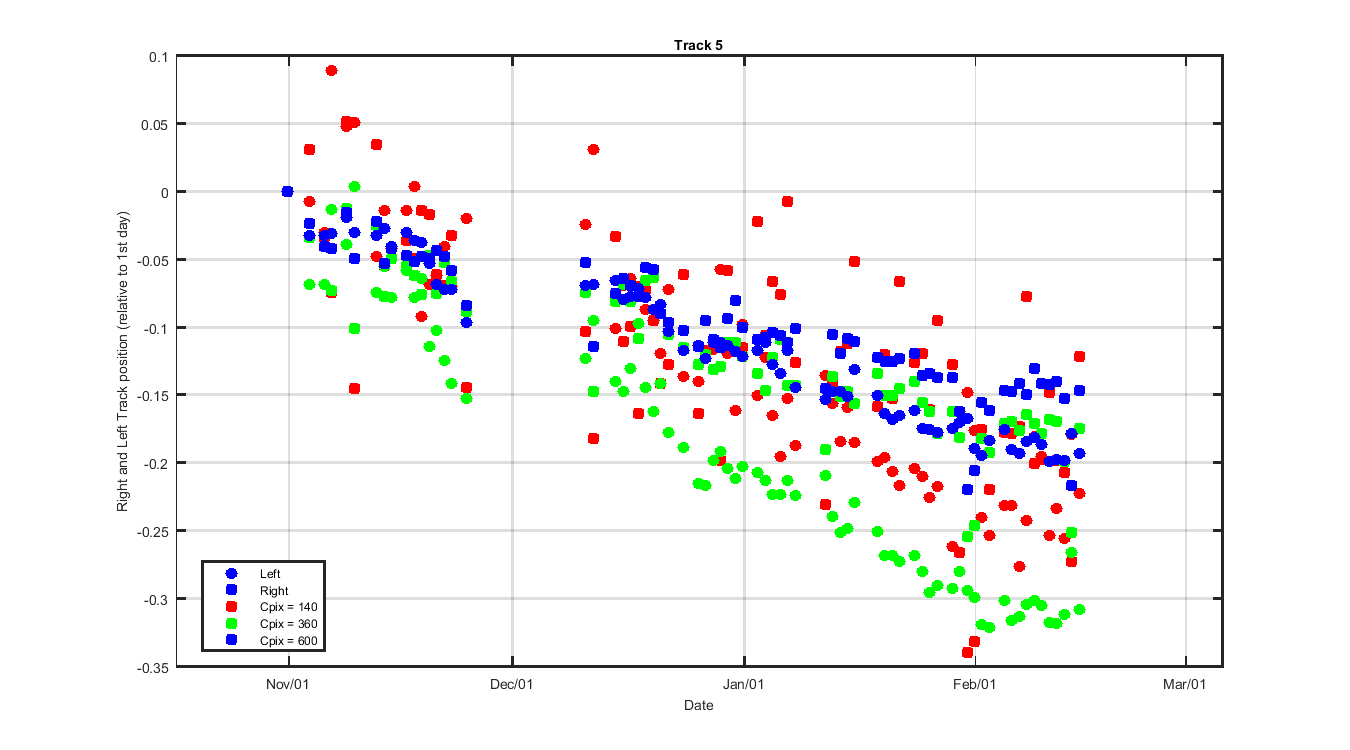
Figure 15
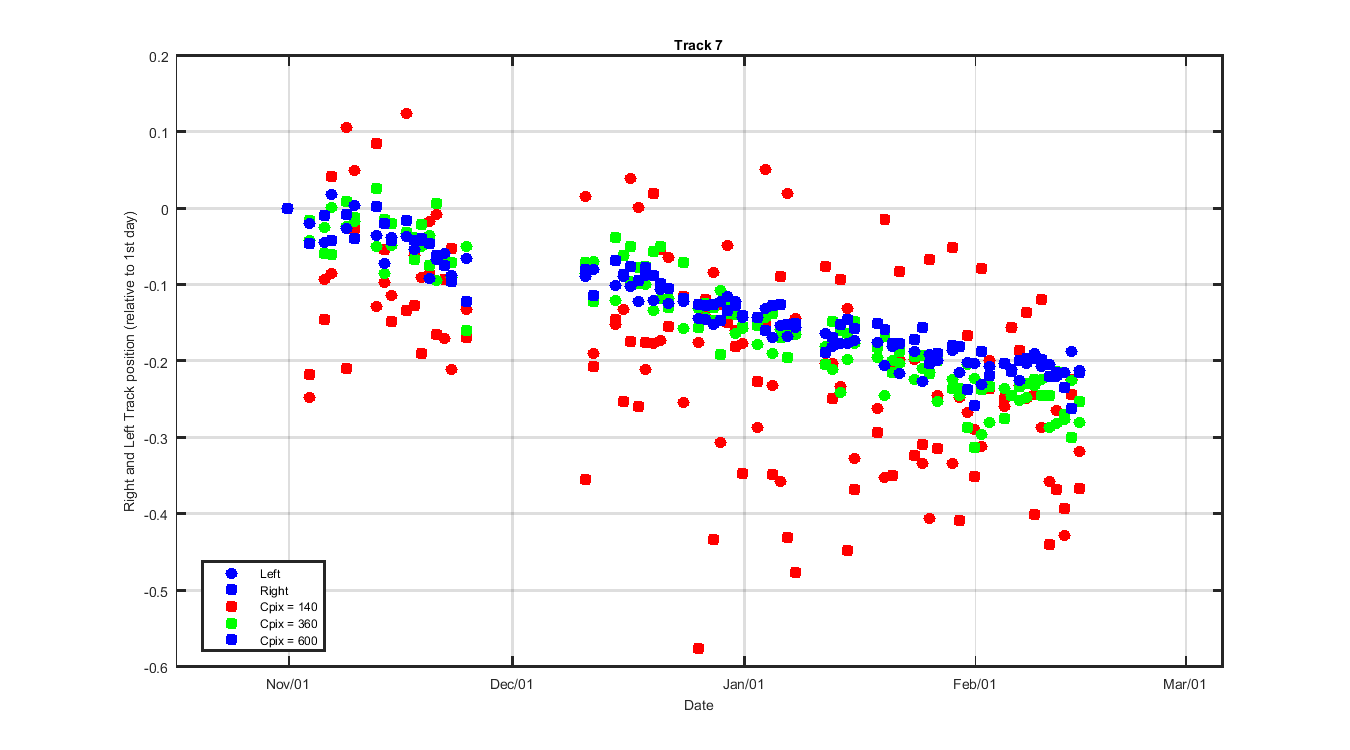
Figure 16
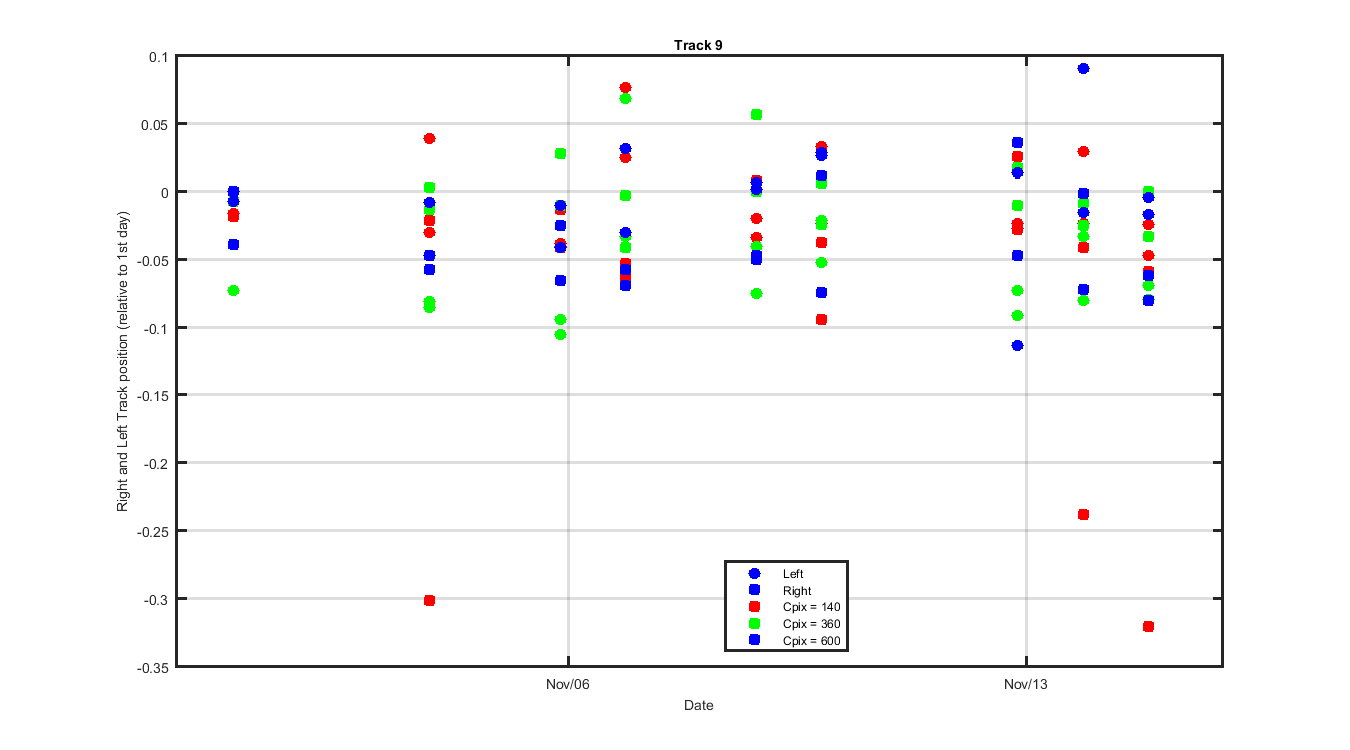
Figure 17
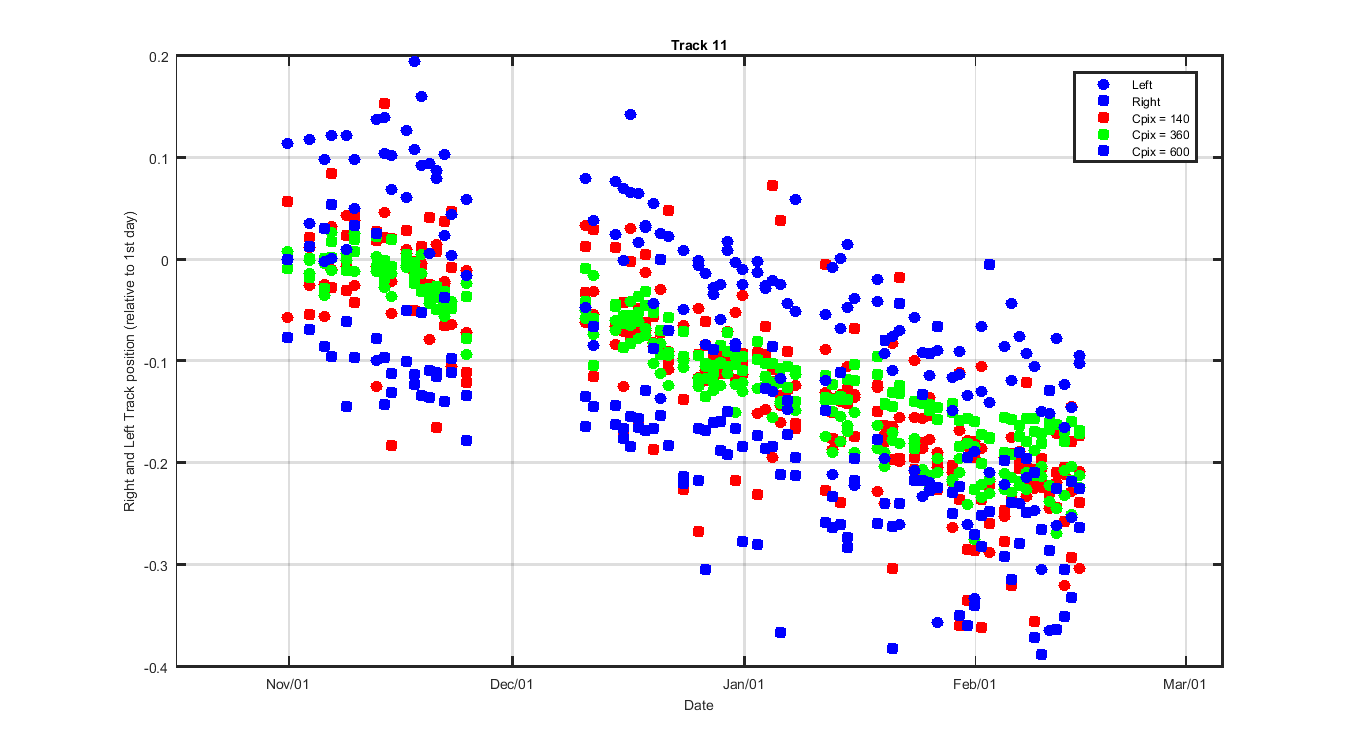
Figure 18