REVISION DATE: 03-Aug-2016 16:29:07
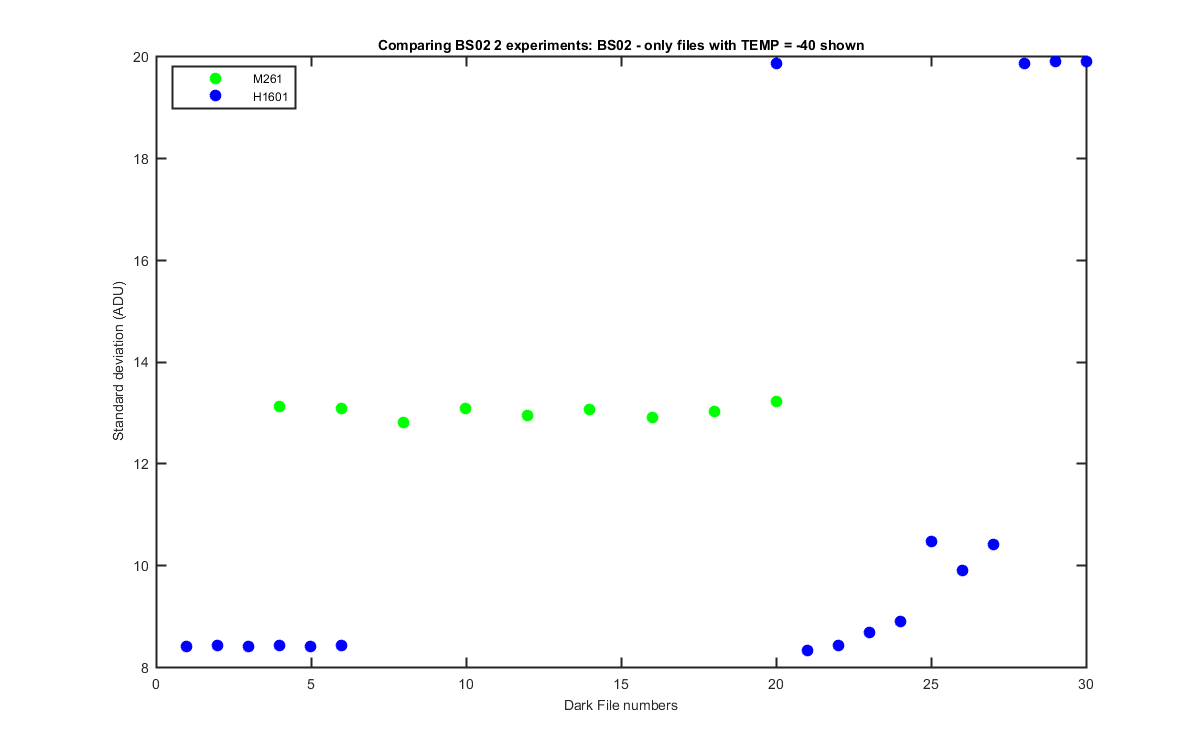
This data where collected on MOBY261 with the BS02 installed in the buoys can. Mark says "The sole purpose of these images is to look at noise level in the images. We want to make sure the Andor CCD is operating on batteries as well as it was previously in the lab." My idea is to compare the current data to the Hawaii-2016-01 BS02 data collected in Feb-May 2016. Slight problem is the two data sets have very different dark ADUs. The current data is around 300 and the old data is closer to 3600 ADU. Not sure why the Pre Amplifier Gain is the same in both Read times are difference the Hawaii-2016-01 read time is 3.3333e-07 and the old read time is 2e-07. There are a few other differences in some odd variables but it is hard to tell if these matter. I only plotted the darks with had the temperature control on. The other data was not useable. Seems like the current data set also does not change with int time change
The first graphs is just a spectral plot of track 8 for the current data. The second are the background data for the Hawaii-2016-01 day1 data. The following two graphs are the mean and std of the entire image for the two data sets. And the second to last compares the percent difference of the standard deviation between the two data sets. ANd the last compares the std.
Figure 1
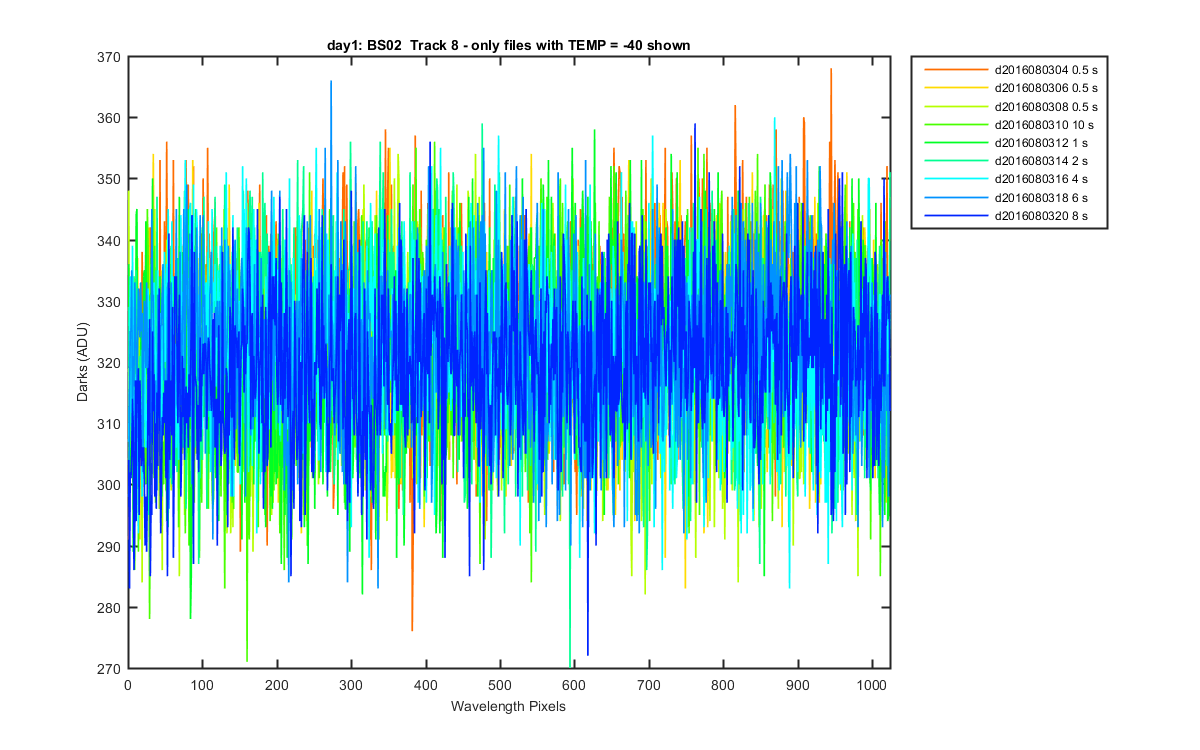
Figure 2
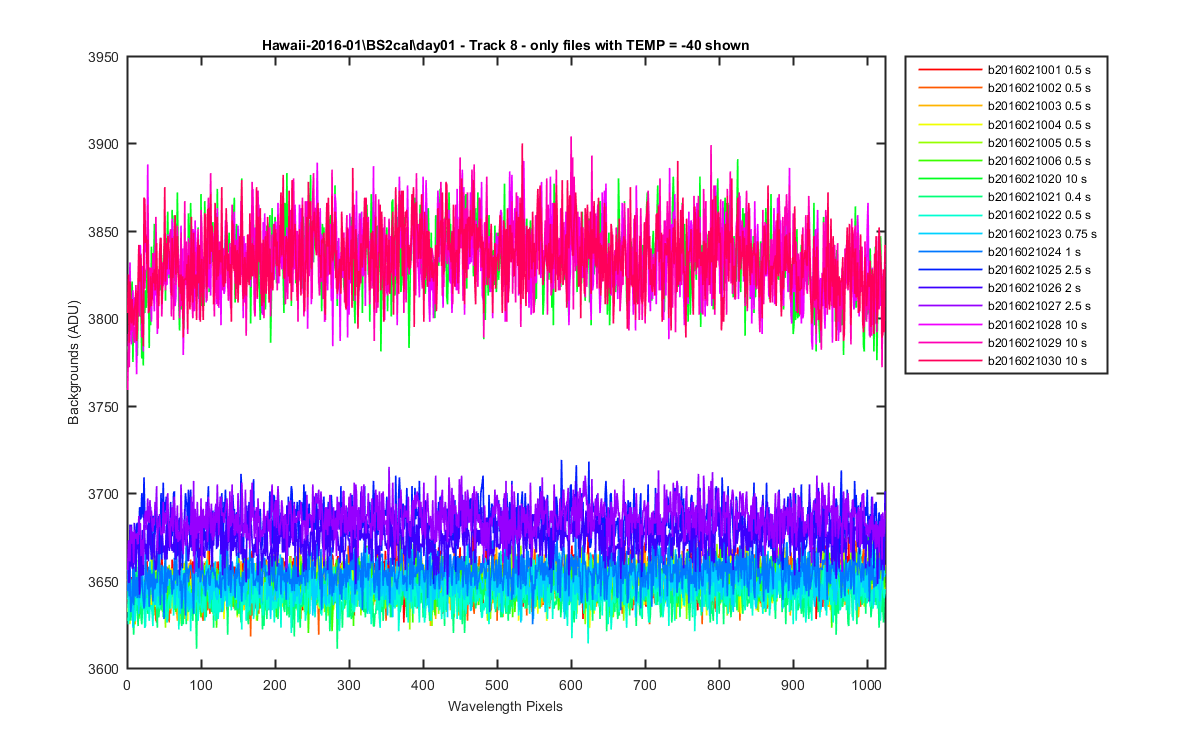
Figure 3
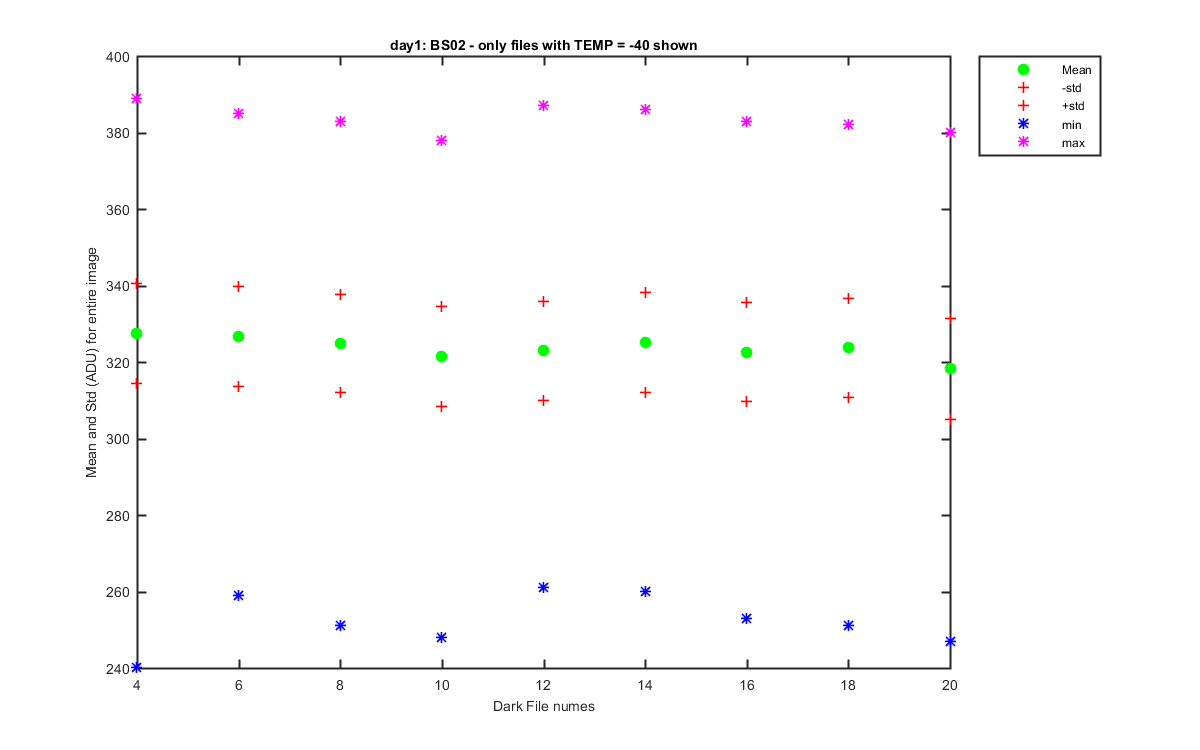
Figure 4
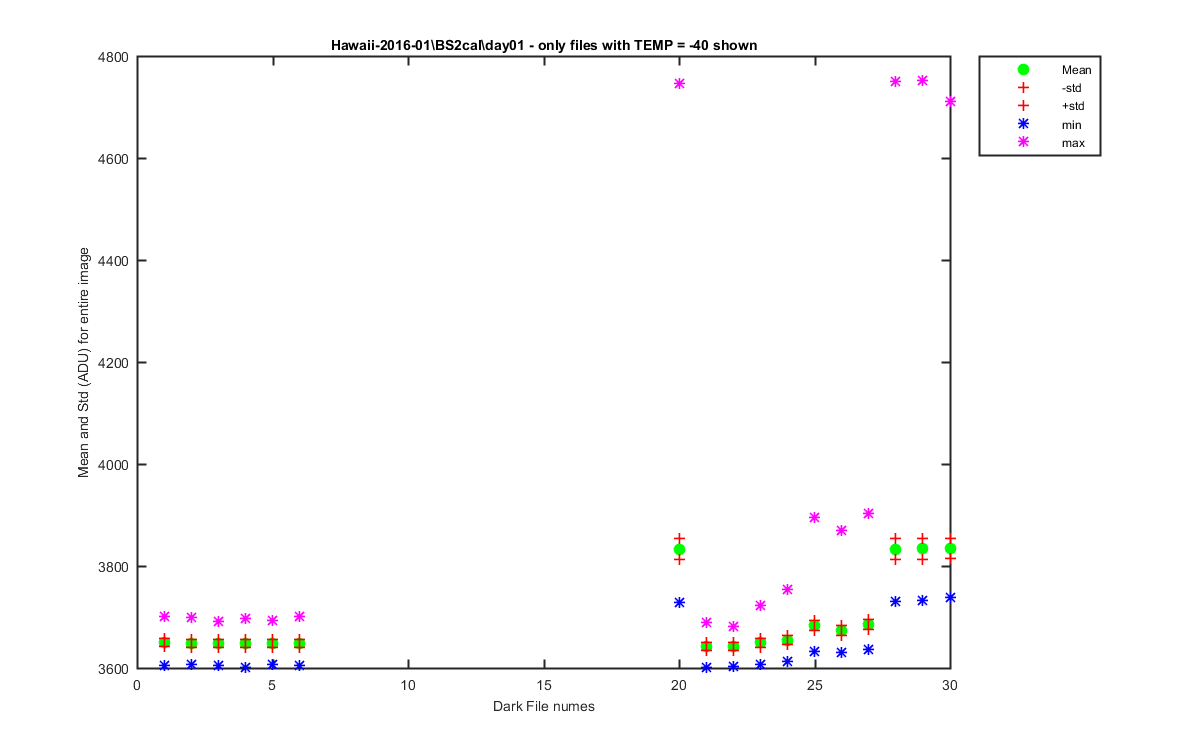
Figure 5
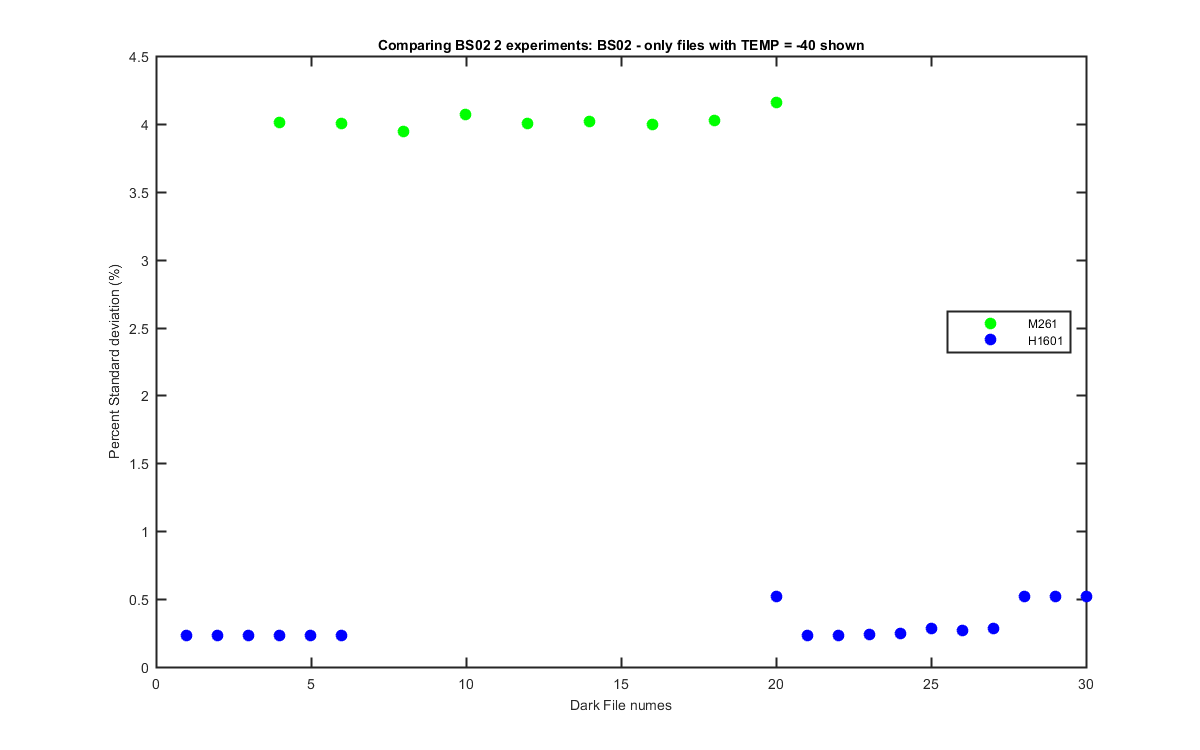
Figure 6