REVISION DATE: 26-Dec-2016 19:07:37
The files below are the darks and background collected during the lastest in-water tests, these are from an automated program . Darks and backgrounds where collected in groups of 3. 3 backgrounds, 3 dark, 5 lites (not shown), 3 dark and 3 backgrounds and then the process is repeated a second time. See the file numbering below.
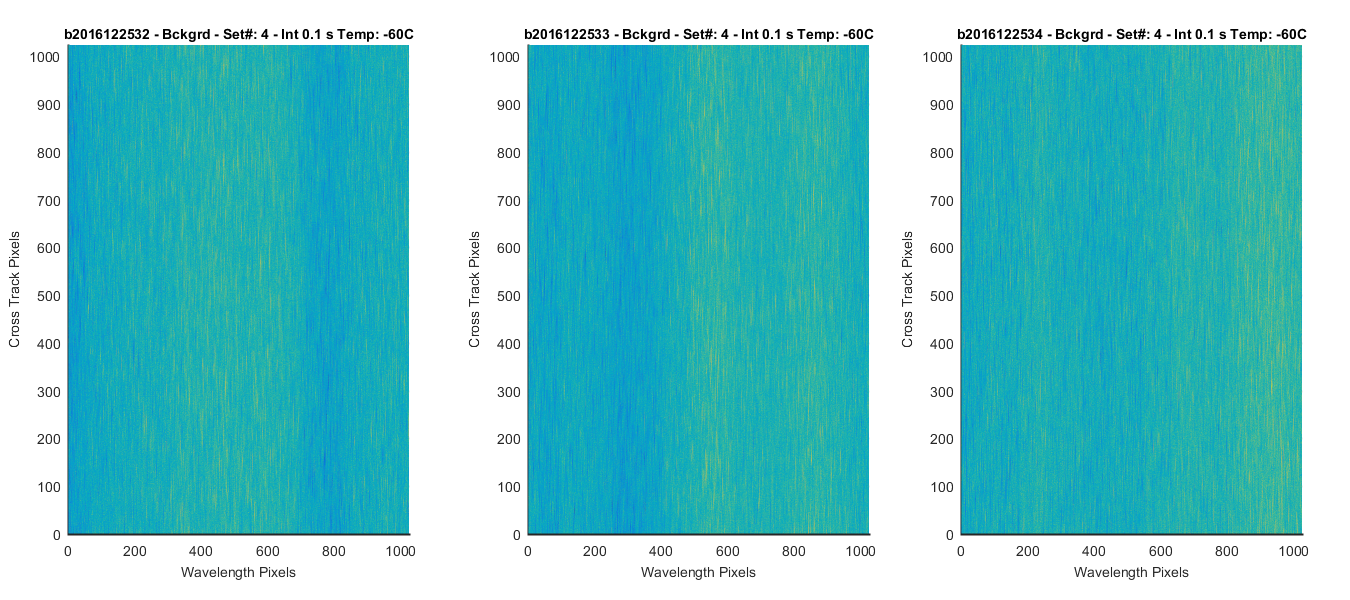
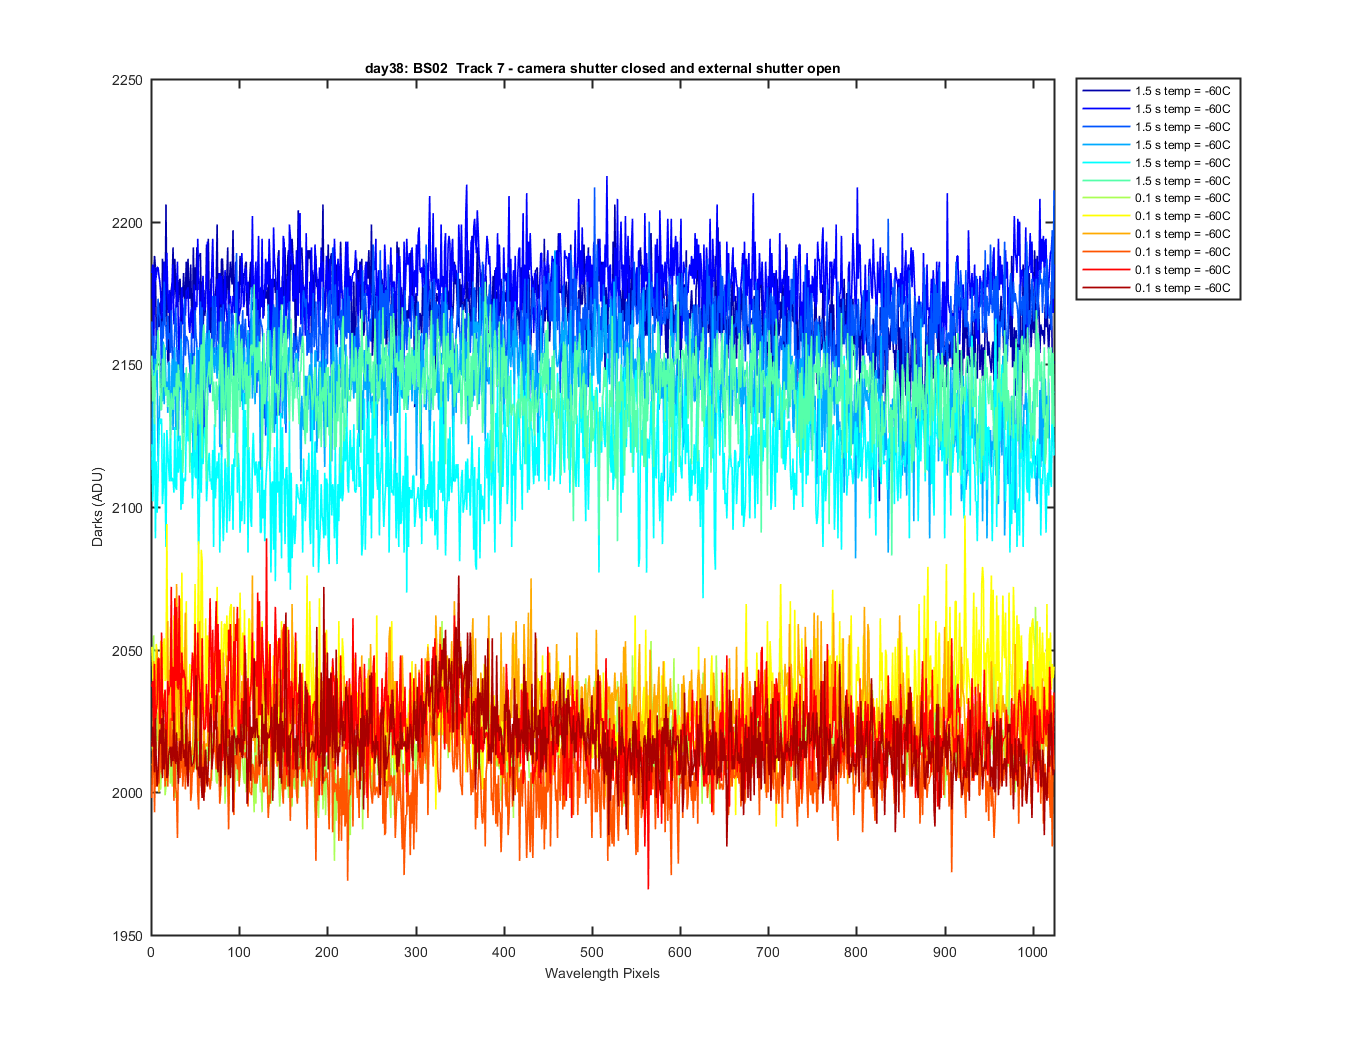
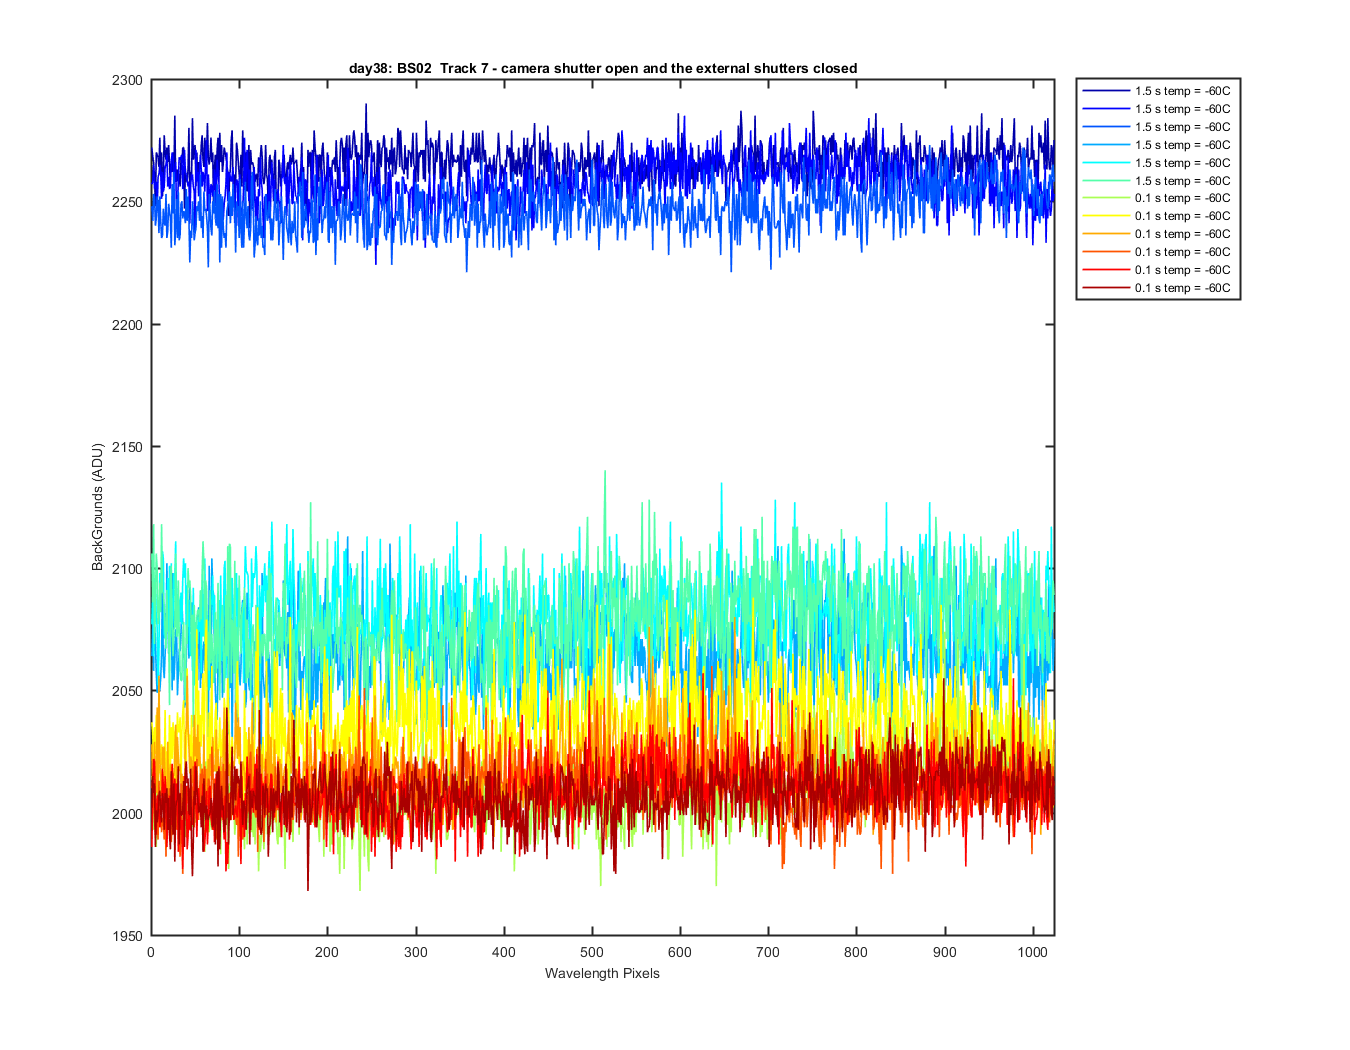
The files I am calling darks where taken with the camera shutter closed and external shutter open. Backgournd files where collected with the camera shutter open and the external shutters closed. /
The first graph is the track 7 darks for all the files. The second is the track 7 backgrounds. All are in ADU. Figues 3-6 are the dark pixels for 3 pixels on the array. One line is the wavelength direction and the other is the track direction. The 7th graph is the track 7 mean for all the files against time. So you can see how long it is between data collections and any decrease in darks with time. The 8th graph is the darks and backgrounds in ADU data verse int time. The 9th graph is the same ADU data but this time divided by int time. The final set of graphs shows the first 3 dark or background images for each of the repeats Art did.
File numbers for the data sets collected
1  Background
2  Background
3  Background
4  Dark
5  Dark
6  Dark
7  Signal - Lu tracks only
8  Signal - Lu tracks only
9  Signal - Lu tracks only
10 Signal - Lu tracks only
11 Signal - Lu tracks only
12 Dark
13 Dark
14 Dark
15 Background
16 Background
17 Background
%--------------------------------
18 Background
19 Background
20 Background
21 Dark
22 Dark
23 Dark
24 Signal - Es, Ed and Lu Tracks
25 Signal - Es, Ed and Lu Tracks
26 Signal - Es, Ed and Lu Tracks
27 Signal - Es, Ed and Lu Tracks
28 Signal - Es, Ed and Lu Tracks
29 Dark
30 Dark
31 Dark
32 Background
33 Background
34 Background
Track 7 all the dark files.
Figure 1
Track 7 all the background files.
Figure 2
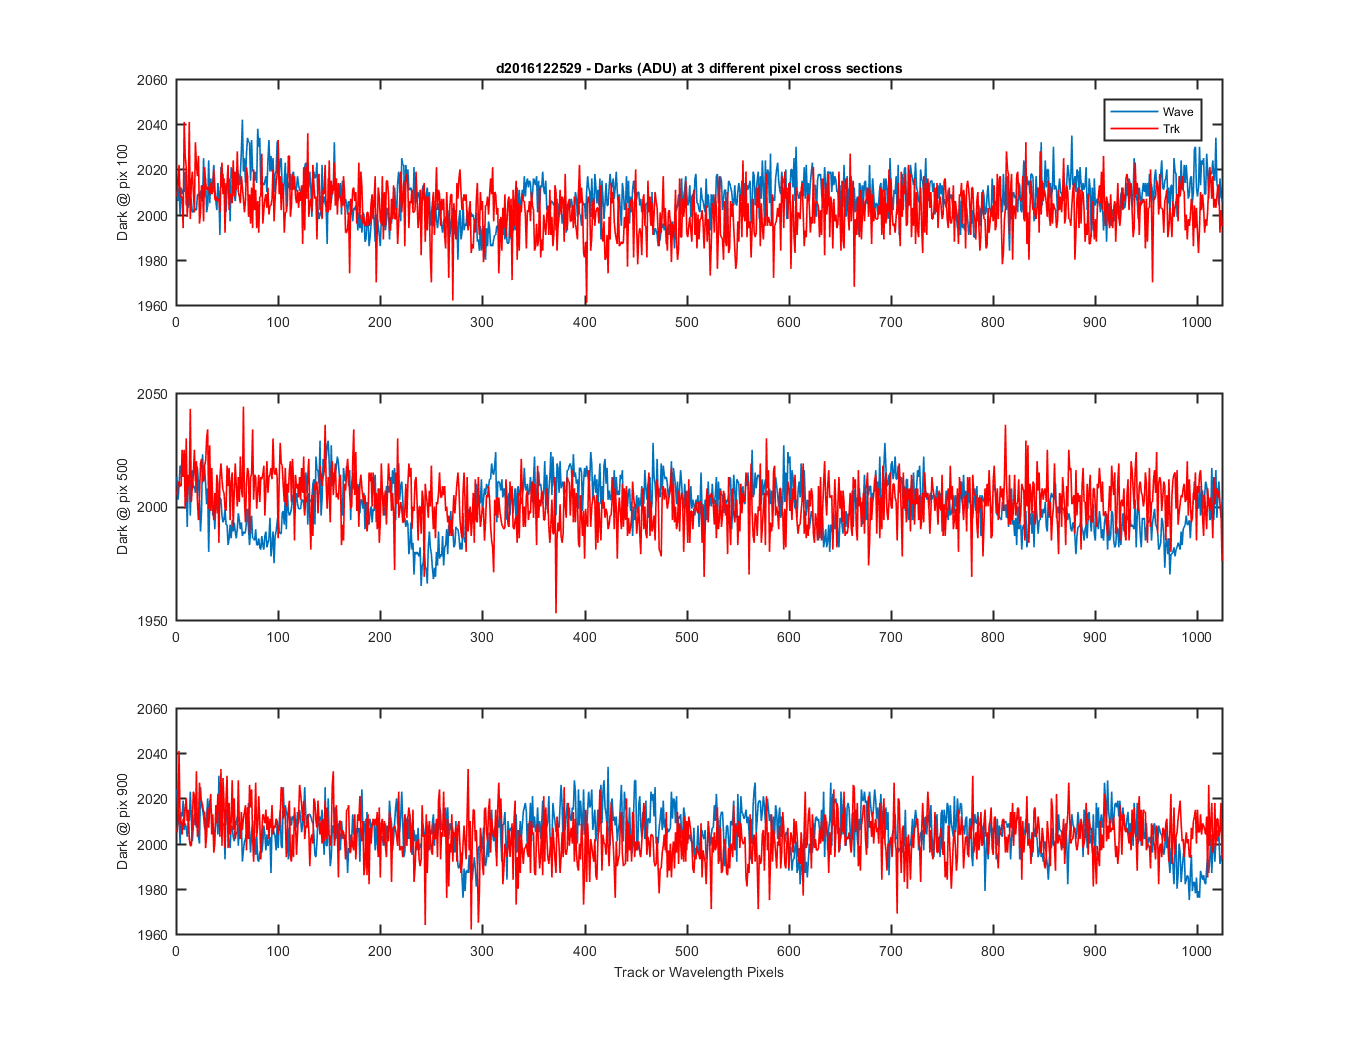
Darks showing for pixel x in the track and wavelength direction (every third dark file)
Figure 3
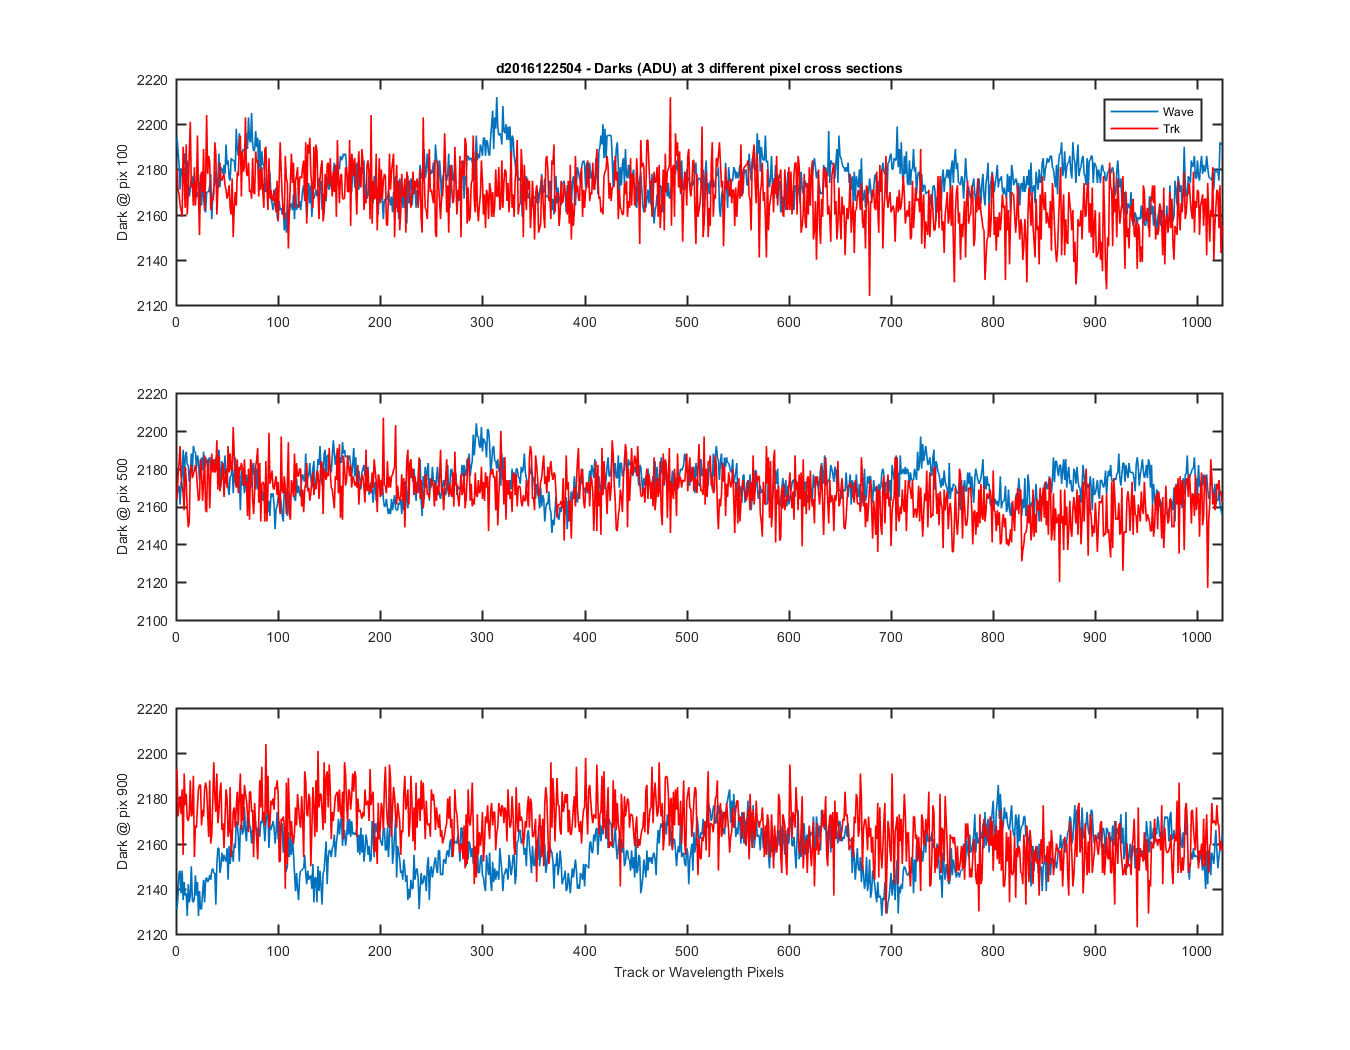
Figure 4
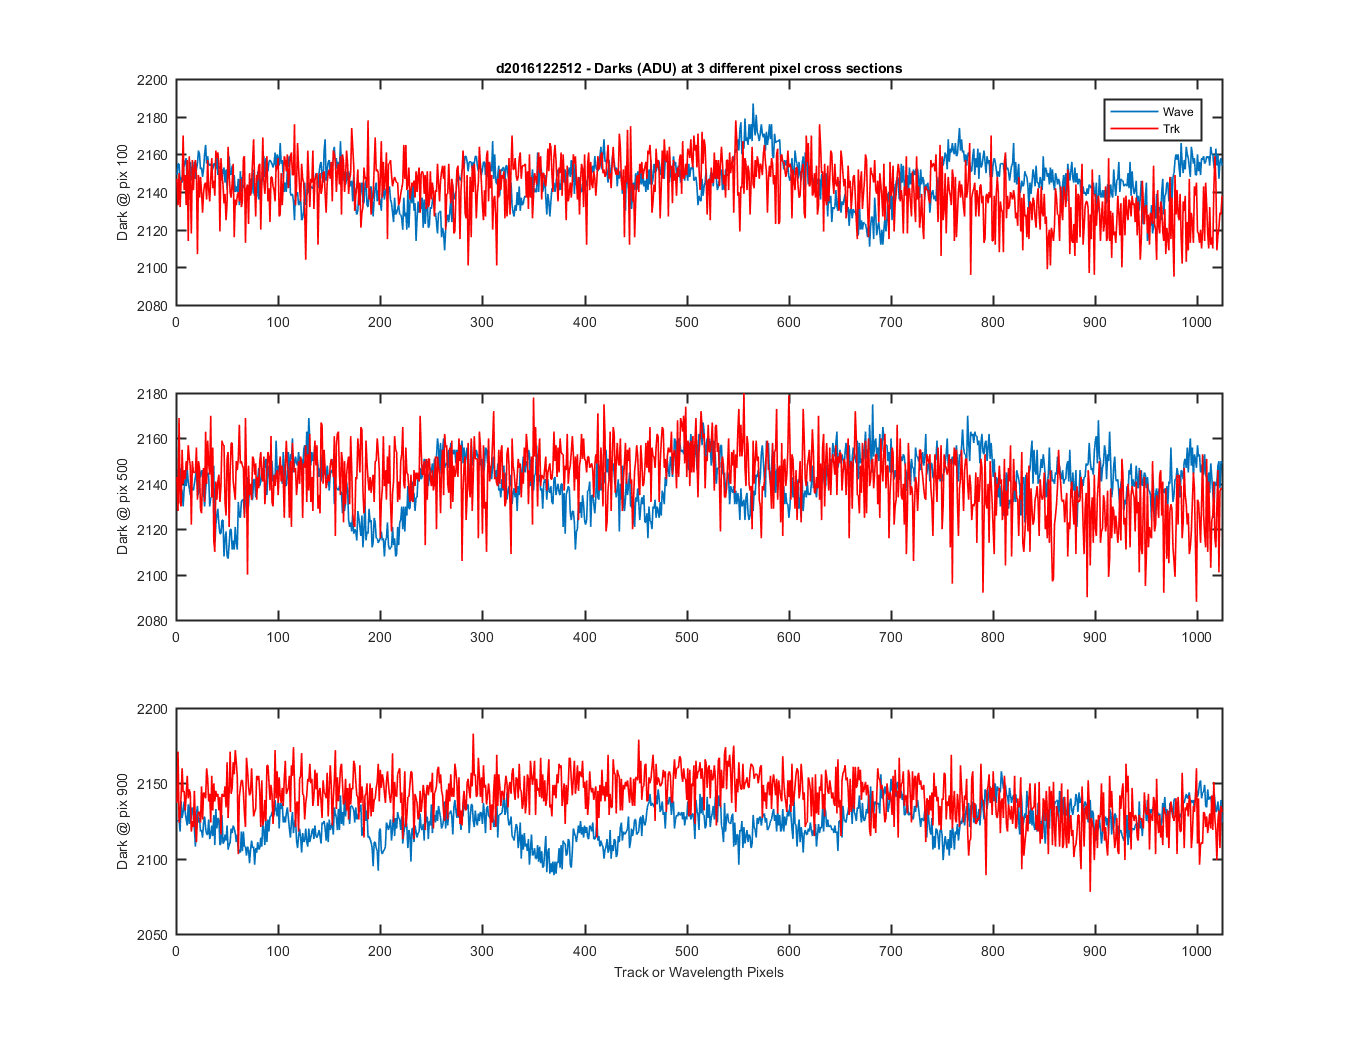
Figure 5
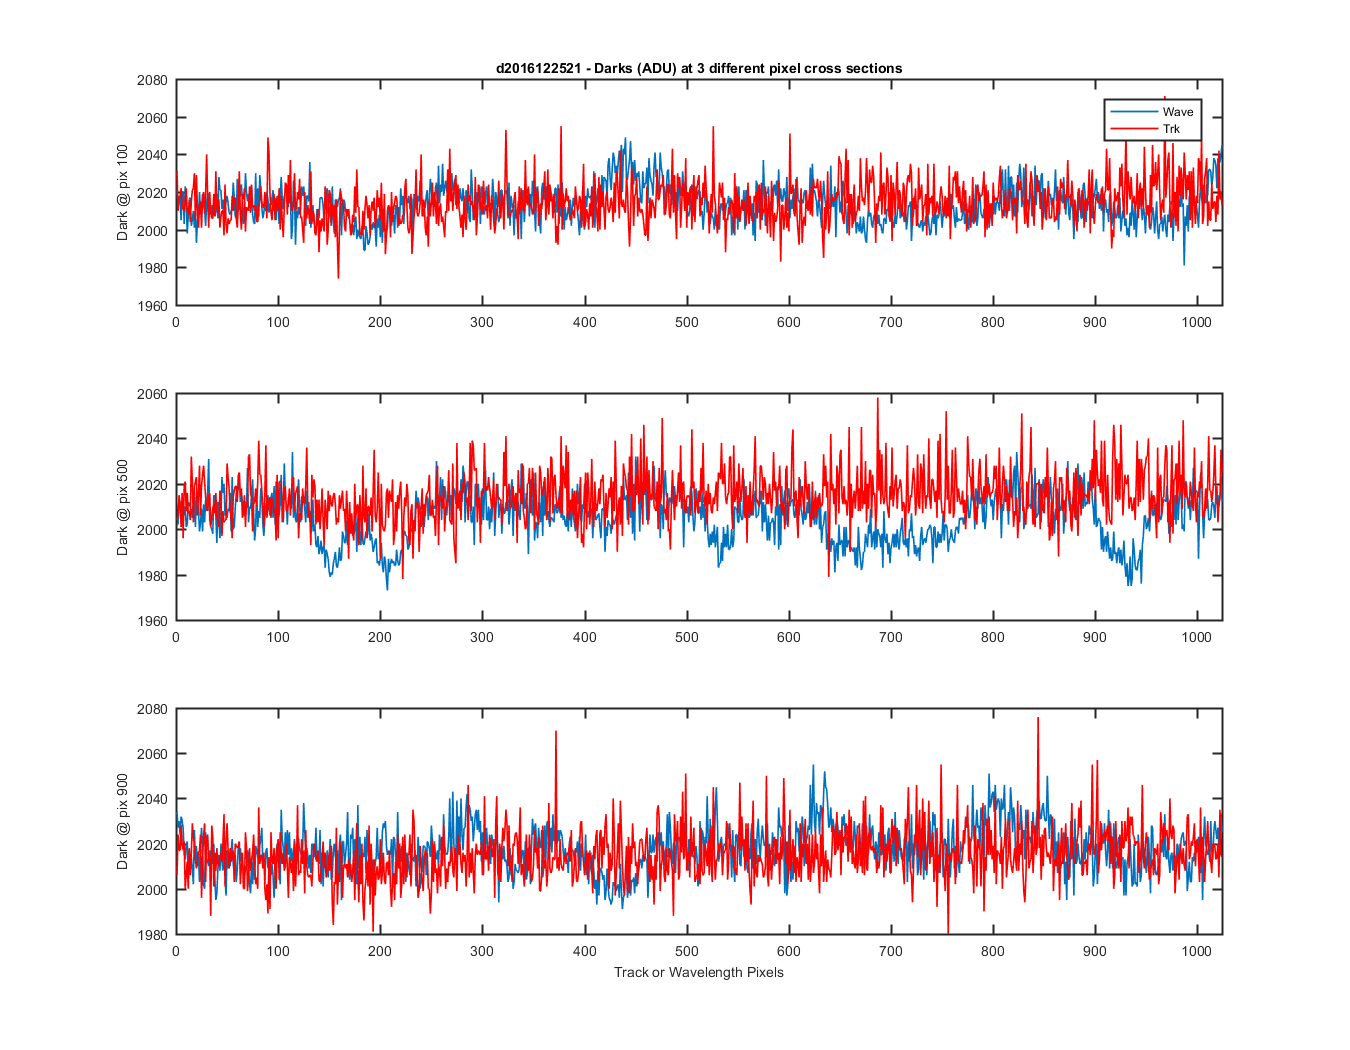
Figure 6
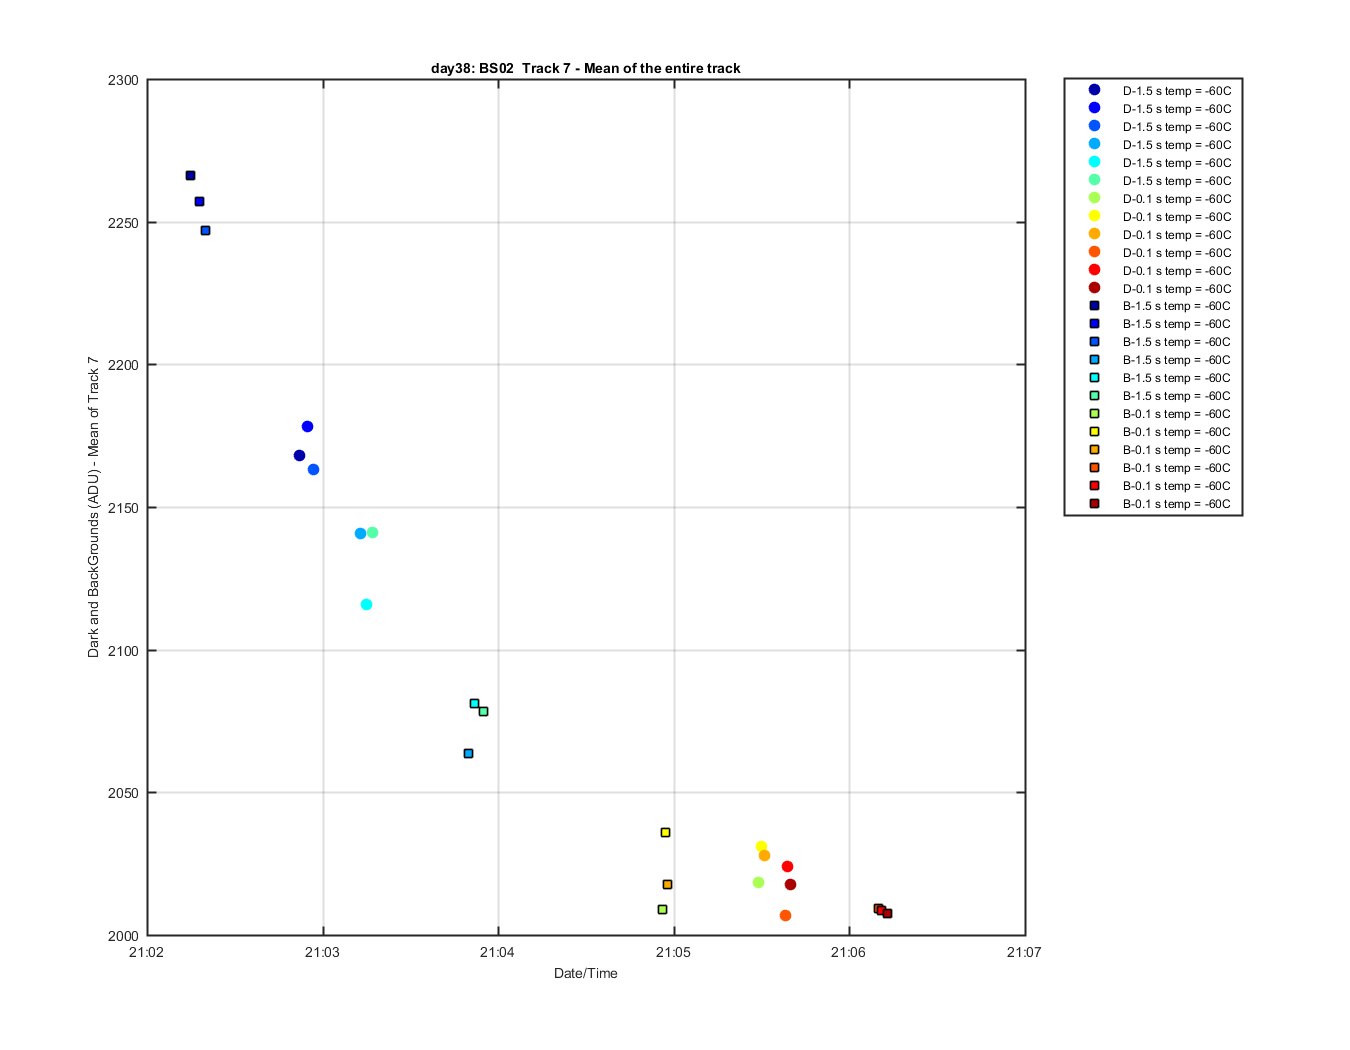
track 7 mean for every third file against time
Figure 7
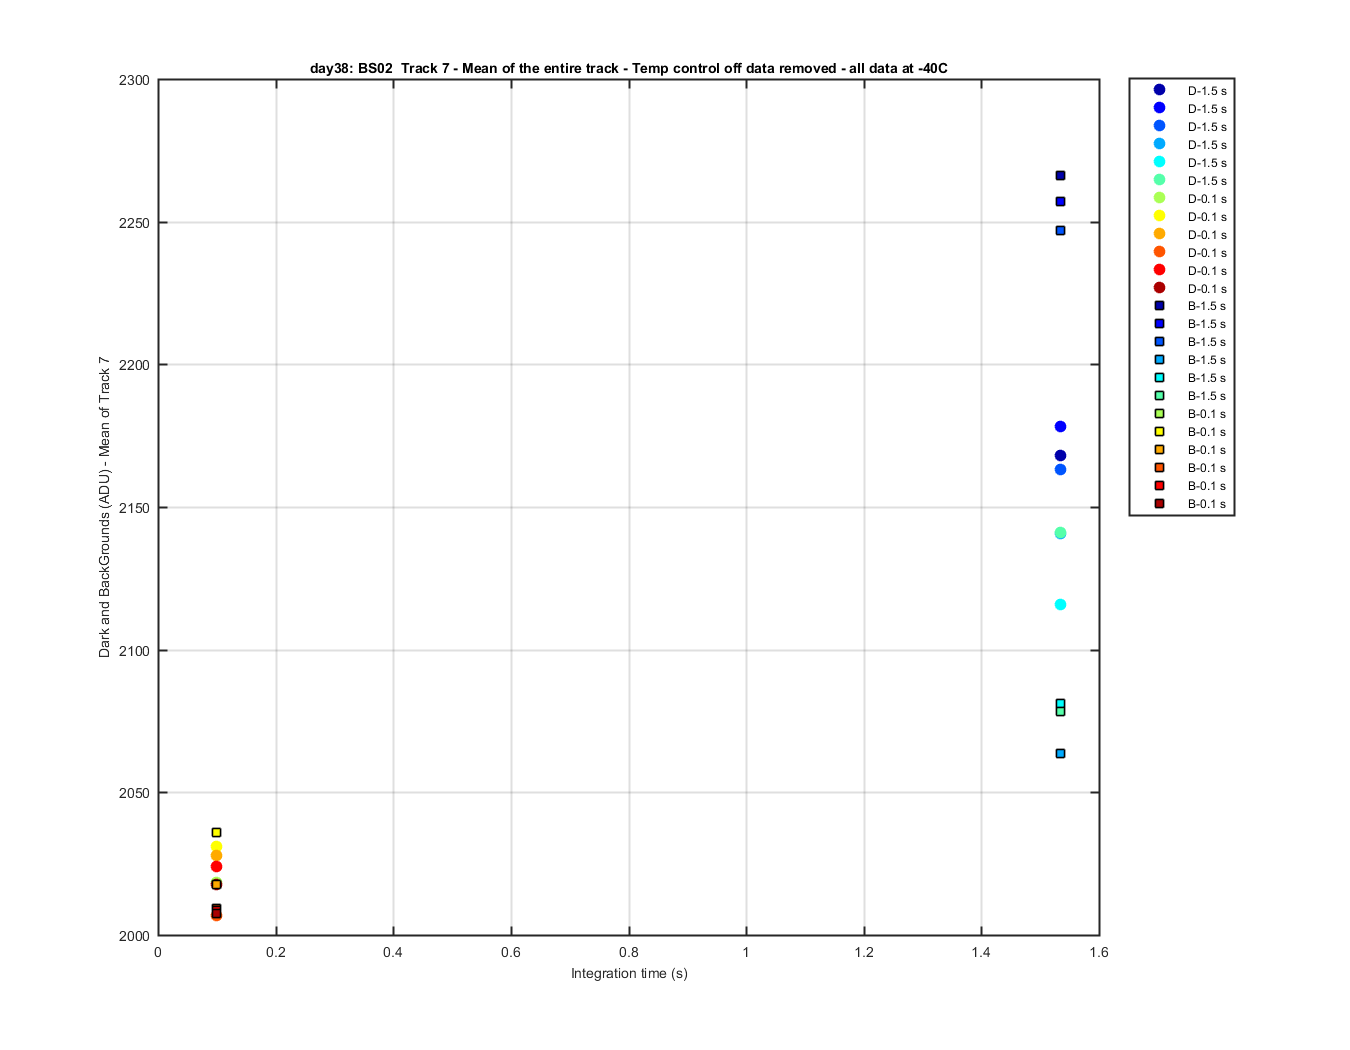
The same data verses int time
Figure 8
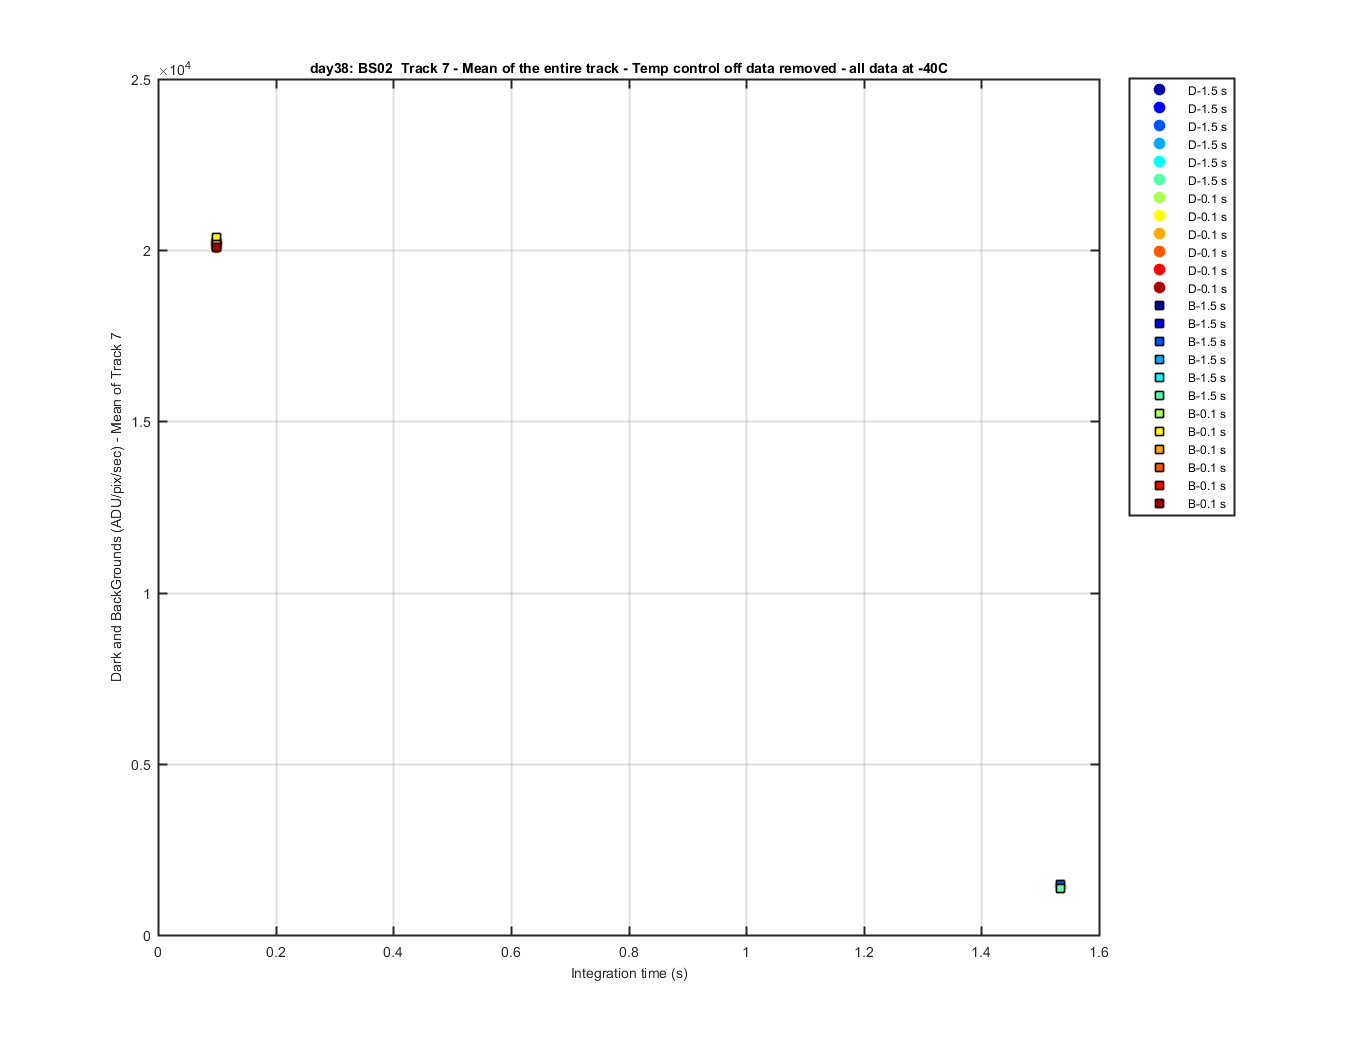
The same data divided by int time
Figure 9
Images of the dark and background repeats for this data set. All the darks had the temp control flag on.
Figure 1
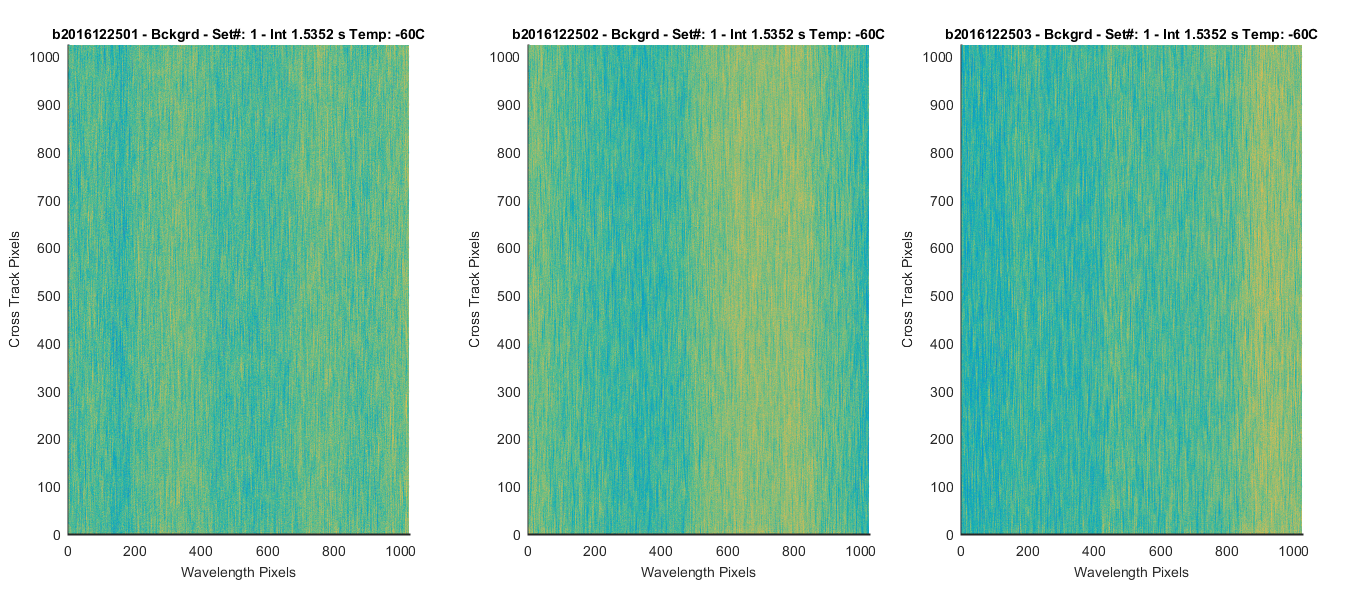
Figure 2
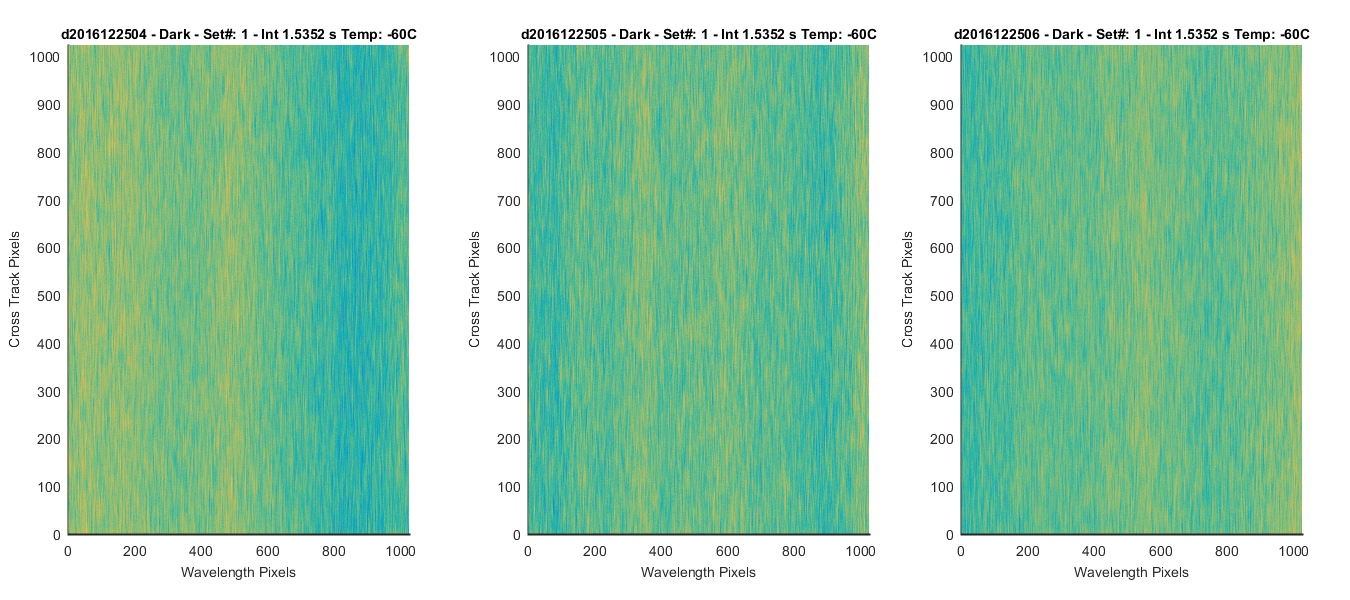
Figure 3
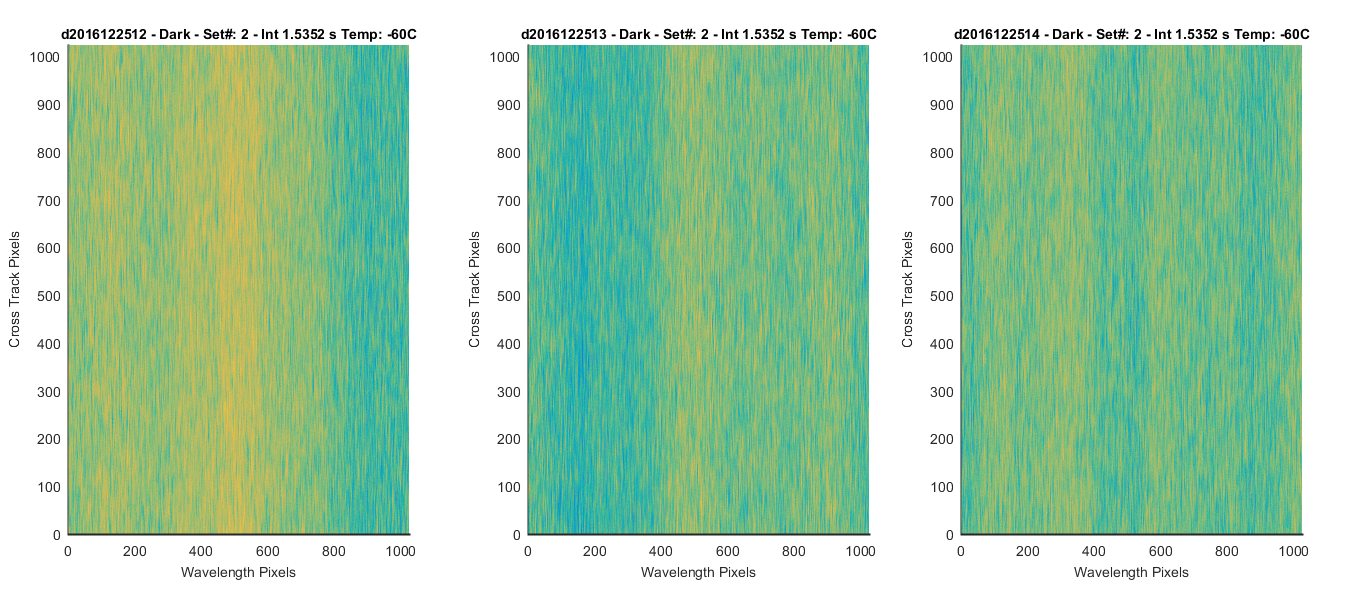
Figure 4
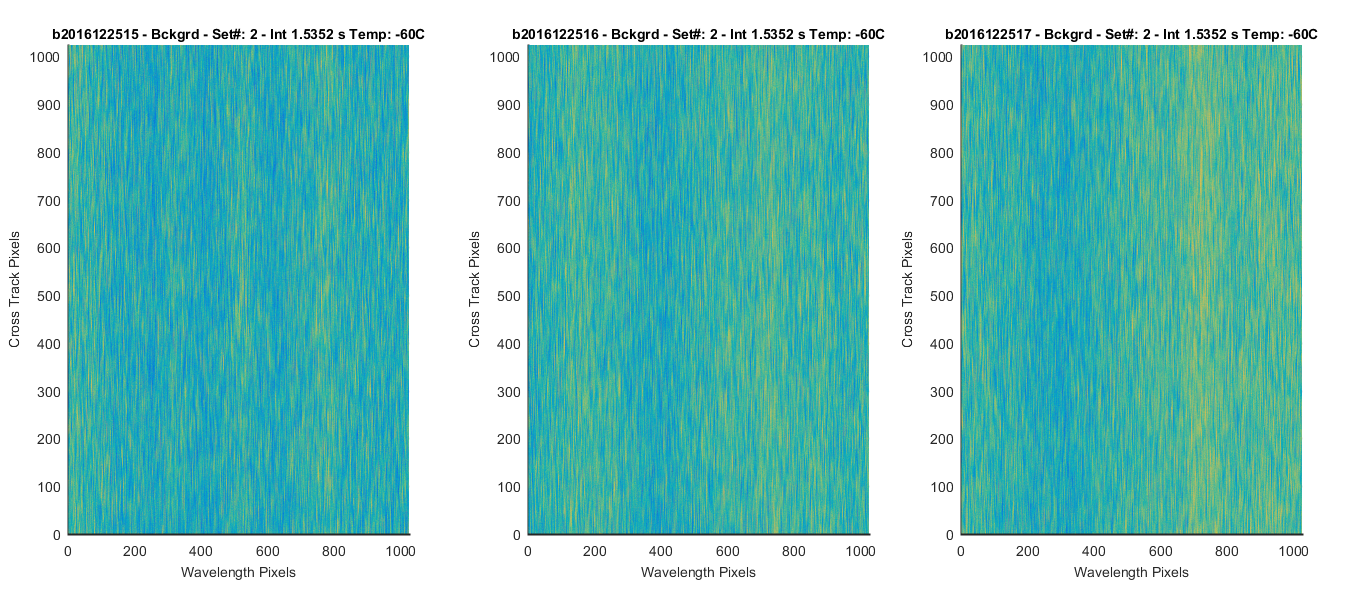
Figure 5
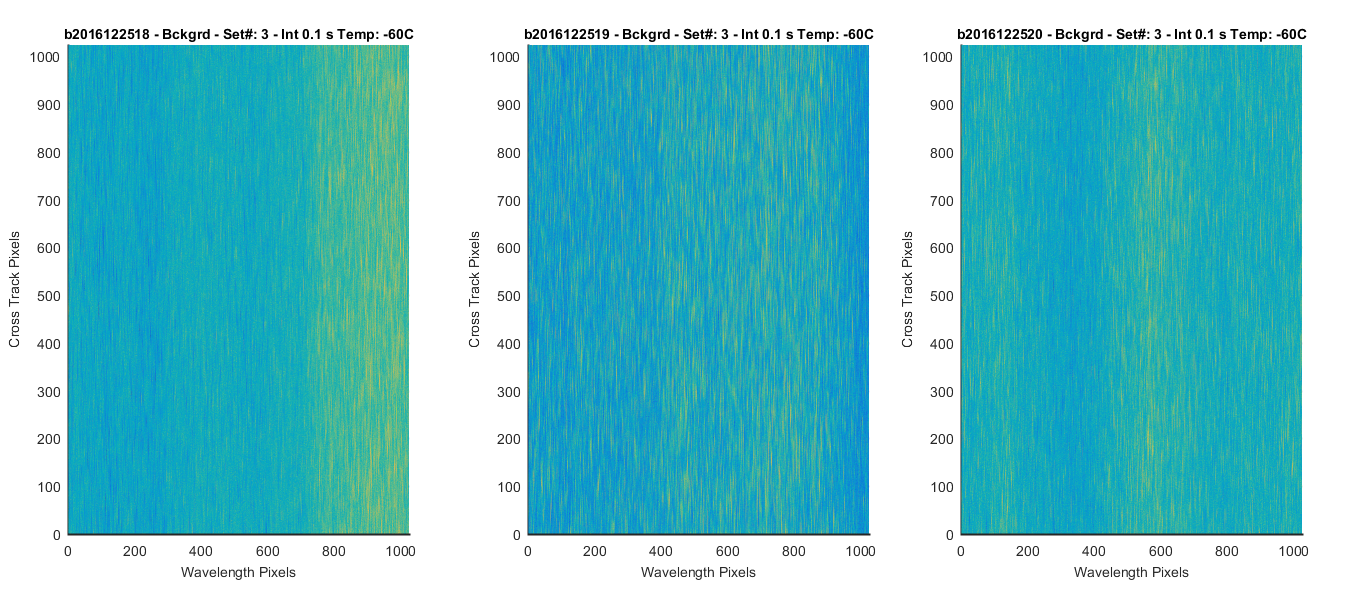
Figure 6
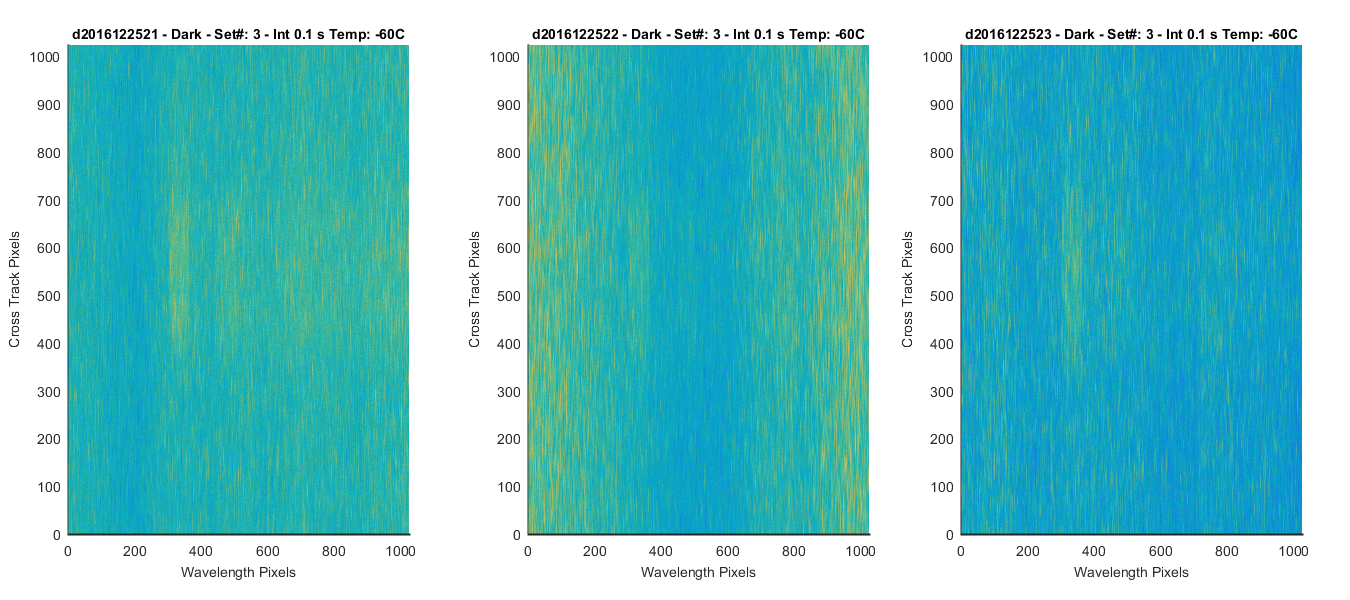
Figure 7
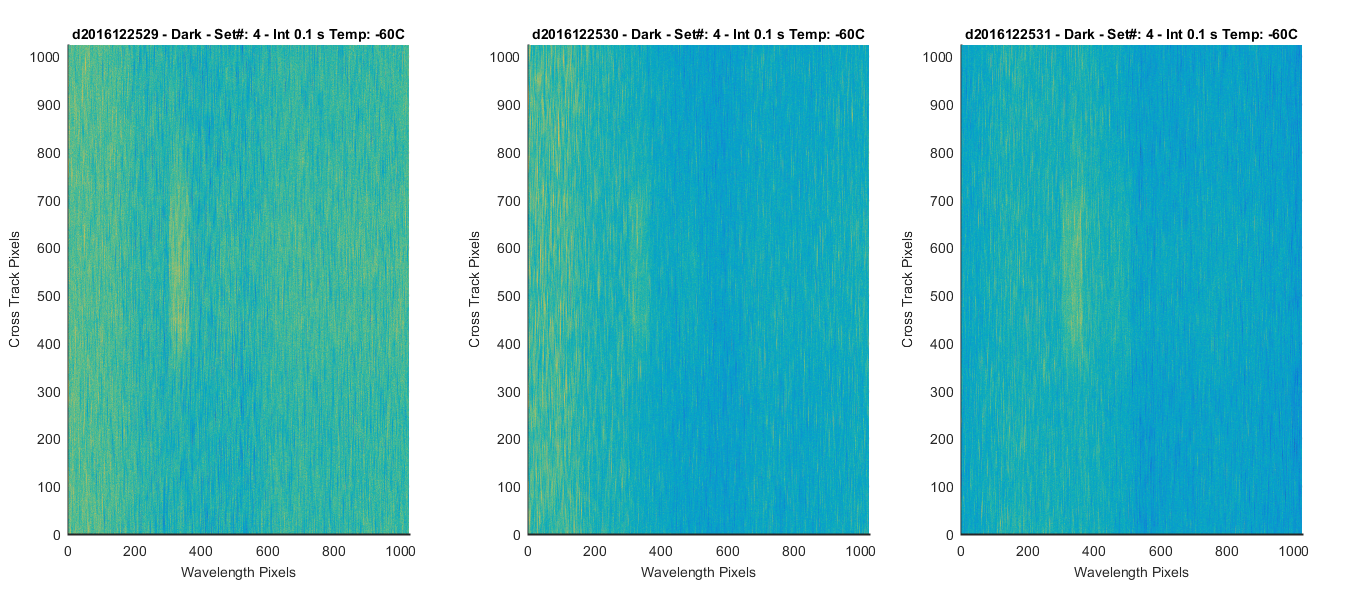
Figure 8