REVISION DATE: 23-Feb-2017 16:04:39
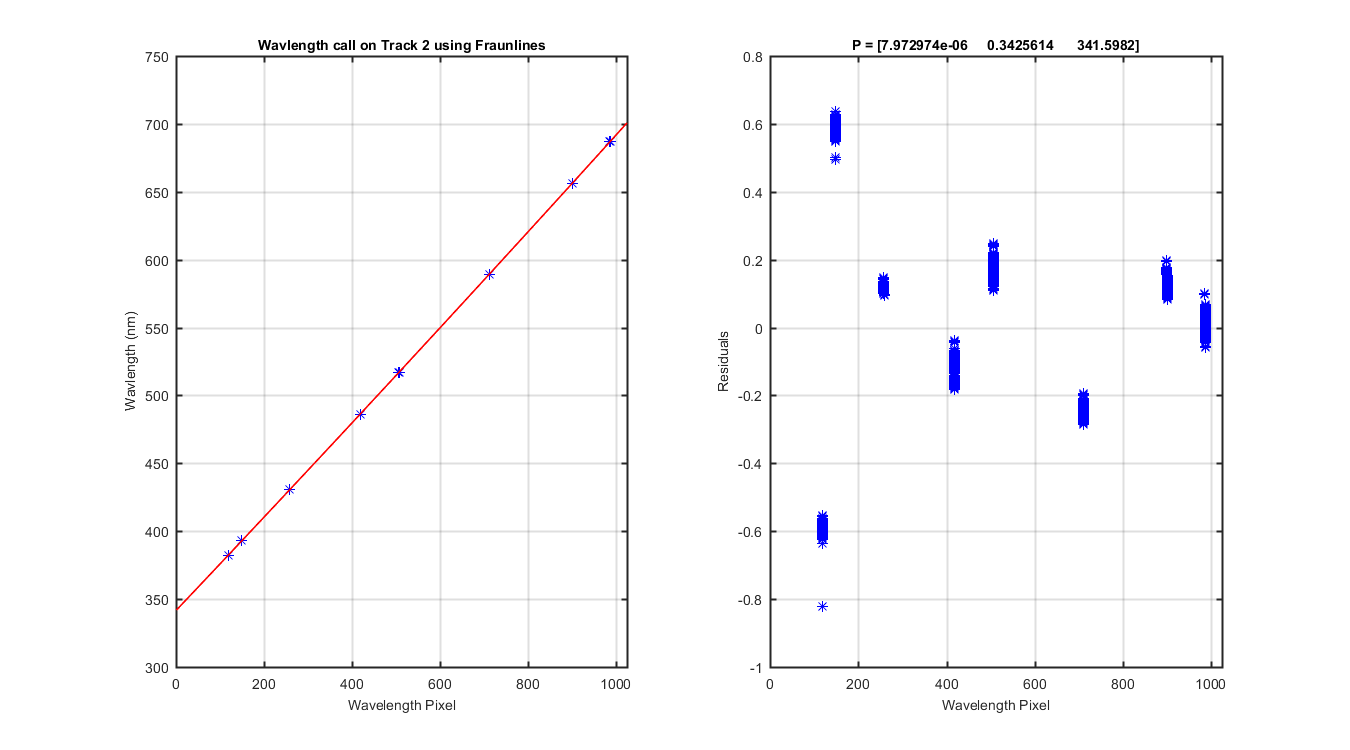
Looks at track 2 wavelength movement for in-water data, the are no data from before deployment so we can not compare that. This is only for track 2 with Es data other tracks are not included. For each Es the data are dark subtracted. There are 8 Fraunhofer lines I am monitoring. I pull out the +- 20 pixels around the fruan line and subtract off the. minumum and divide buy the max to normalize the data. I then used the diff function to calculate the "Difference and approximate derivative" and find where the top of the fraunhofer line is on both sides. I then use these points to pull the fraunhofer line out and make it a peak rather than a valley. I then use the gaussian fit to find the sub-pixel peak location. This method has some uncertainties but it works in an automated way. So I can apply this to all the files easily.
This page should answer Carols question number 2: 2) Use Fraunhofer lines to characterize the wavelength stability from Es (could do same for the MOS Es on 261 for comparison)
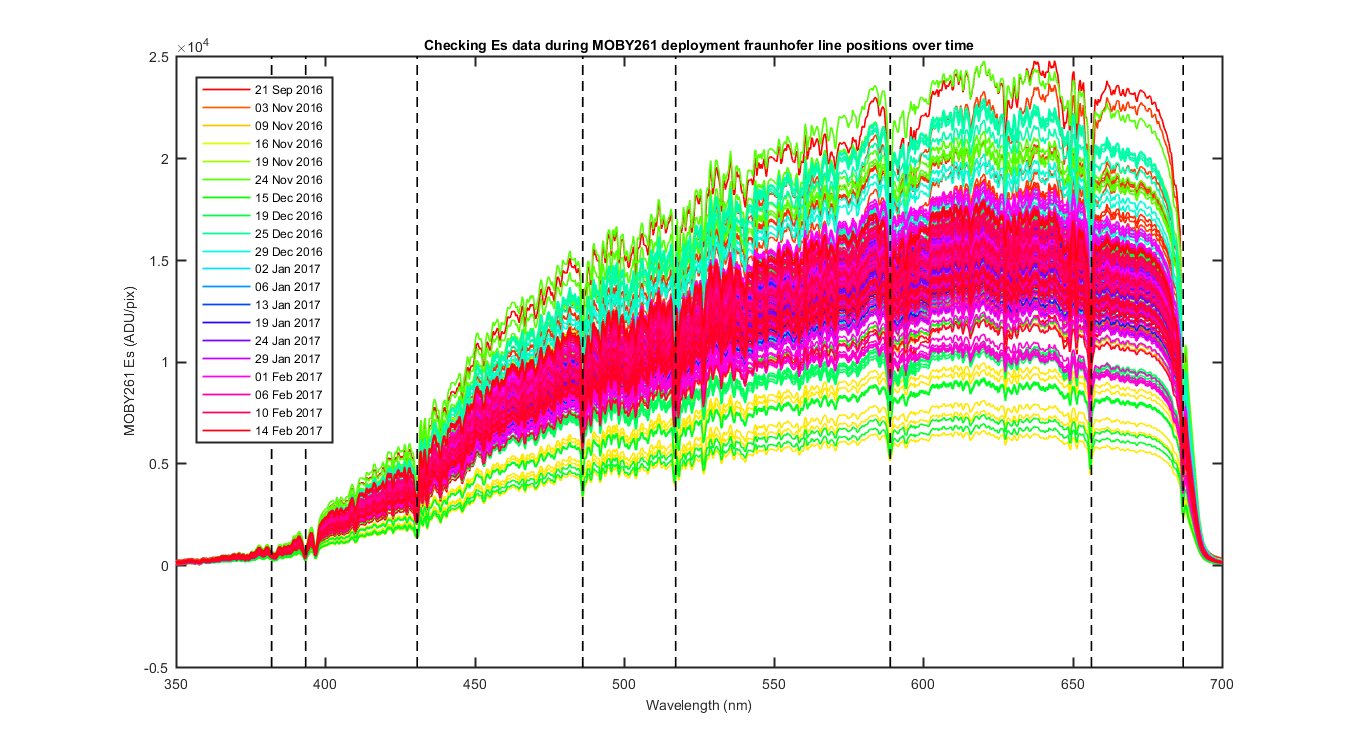
All the valid Es data with colors equalling day number
Figure 1
All the Fraunhofer lines that have been converted to peaks. These are the data use to do the Gaussian fit.
Fraunhofer line positions for each of the 8 lines analysed.
Figure 2
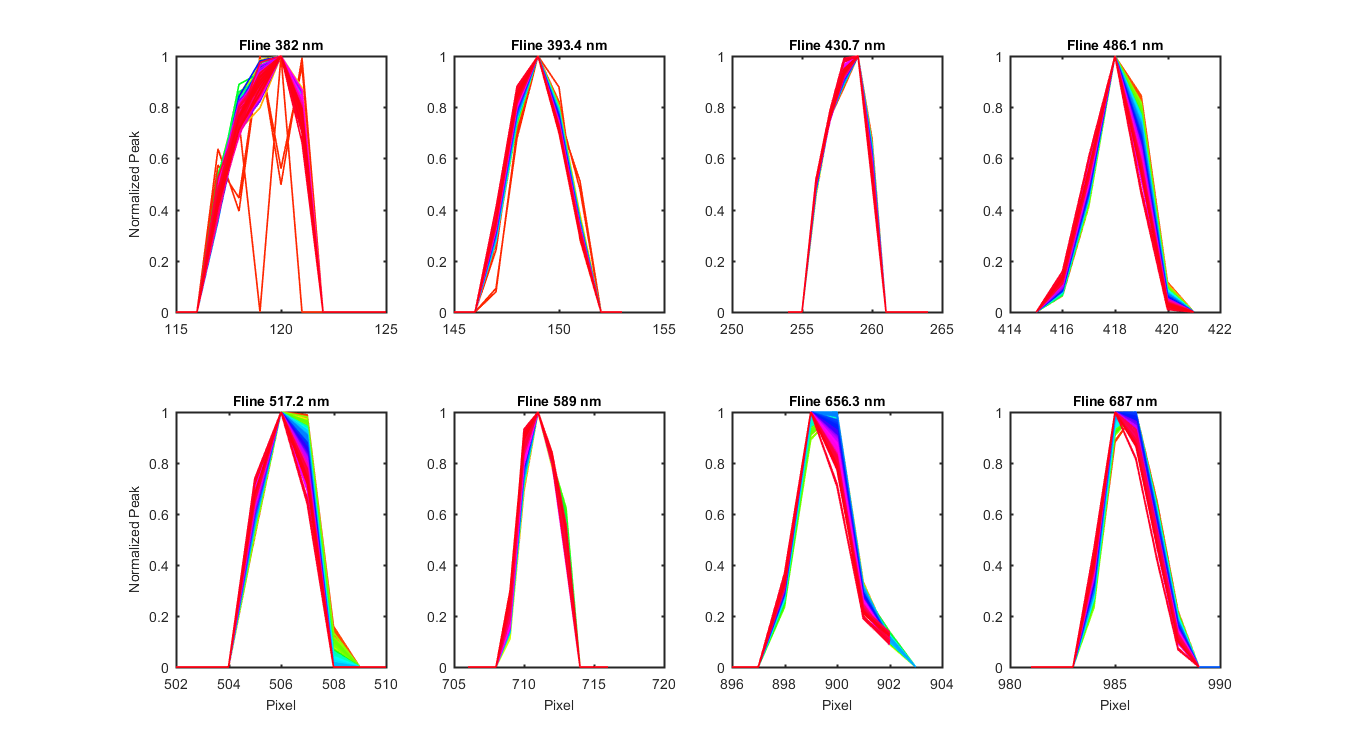
Figure 3
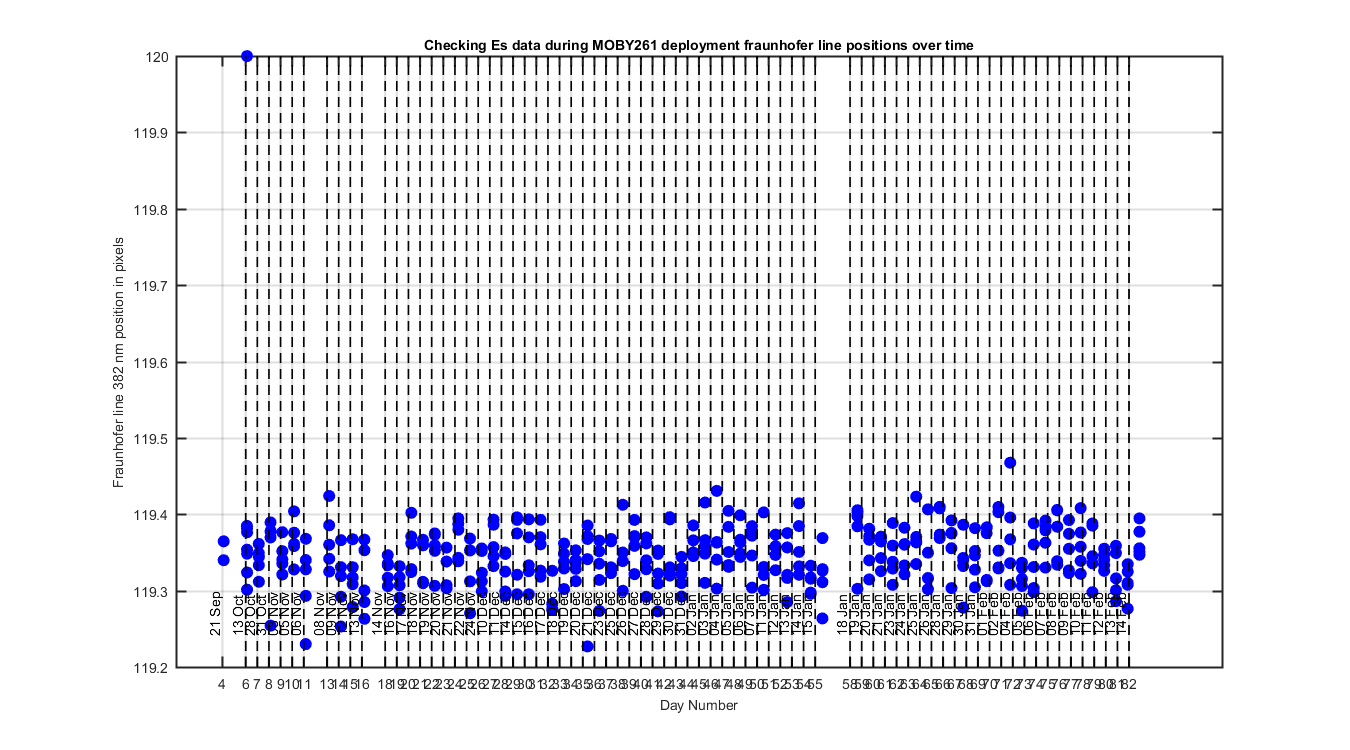
Figure 4
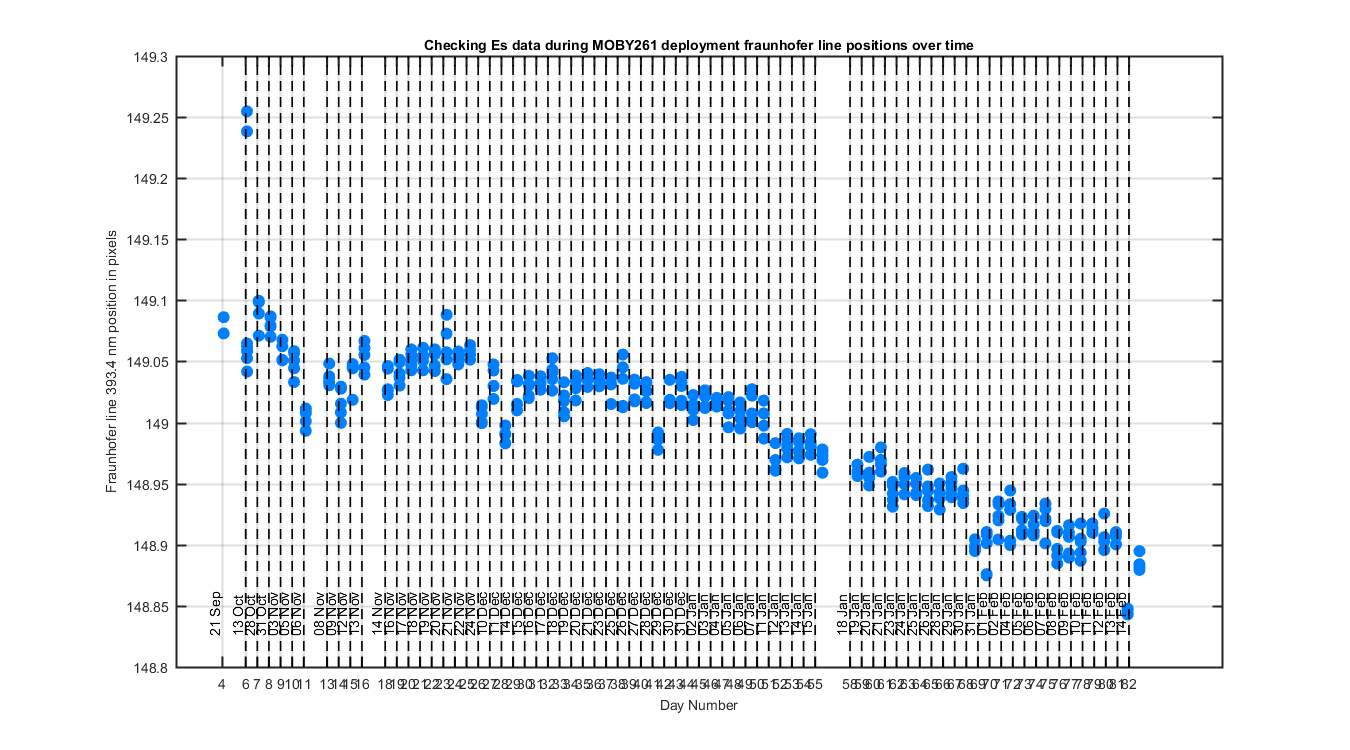
Figure 5
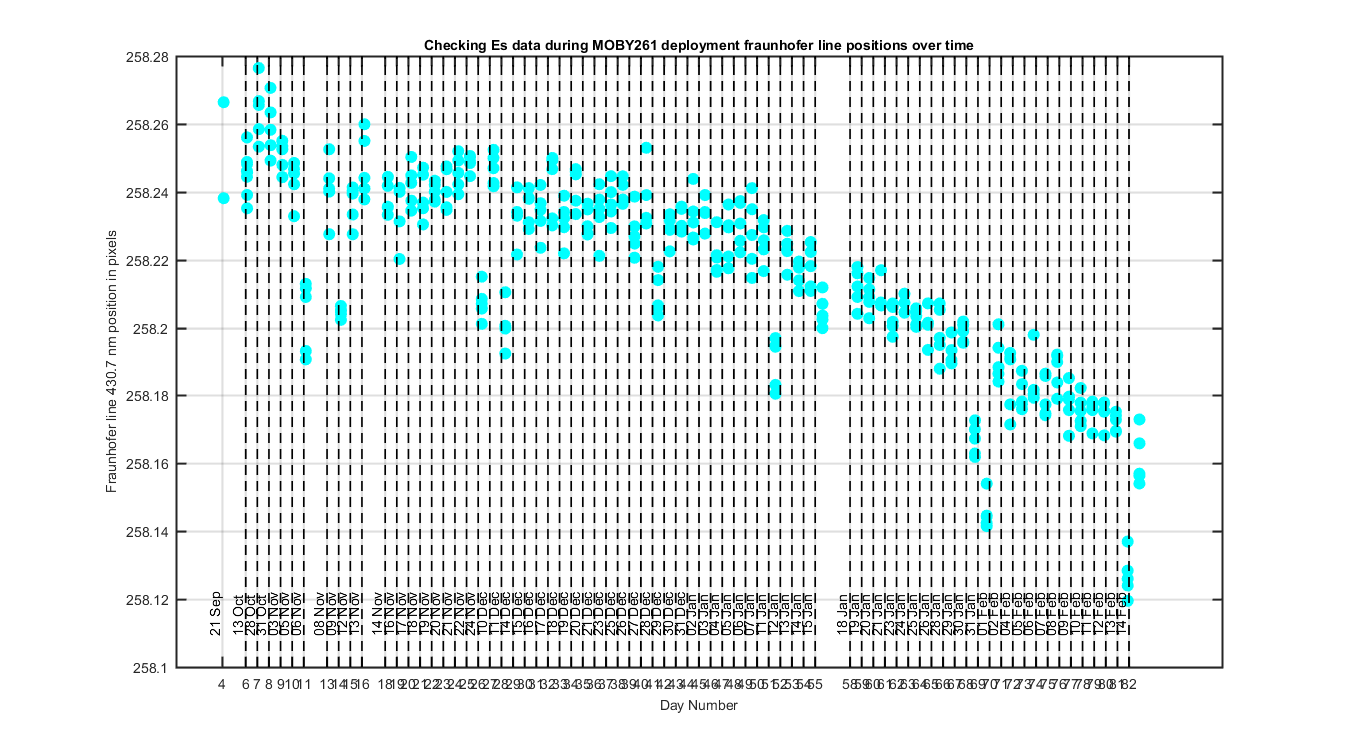
Figure 6
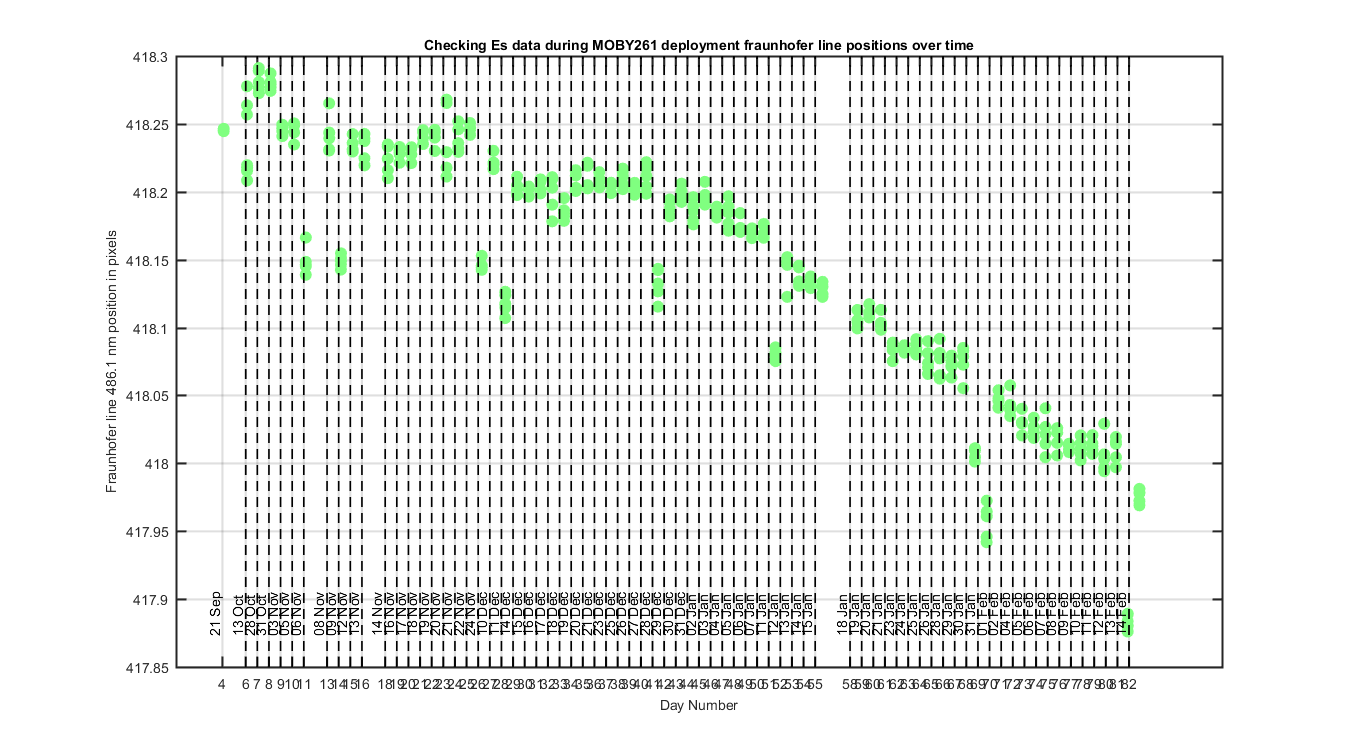
Figure 7
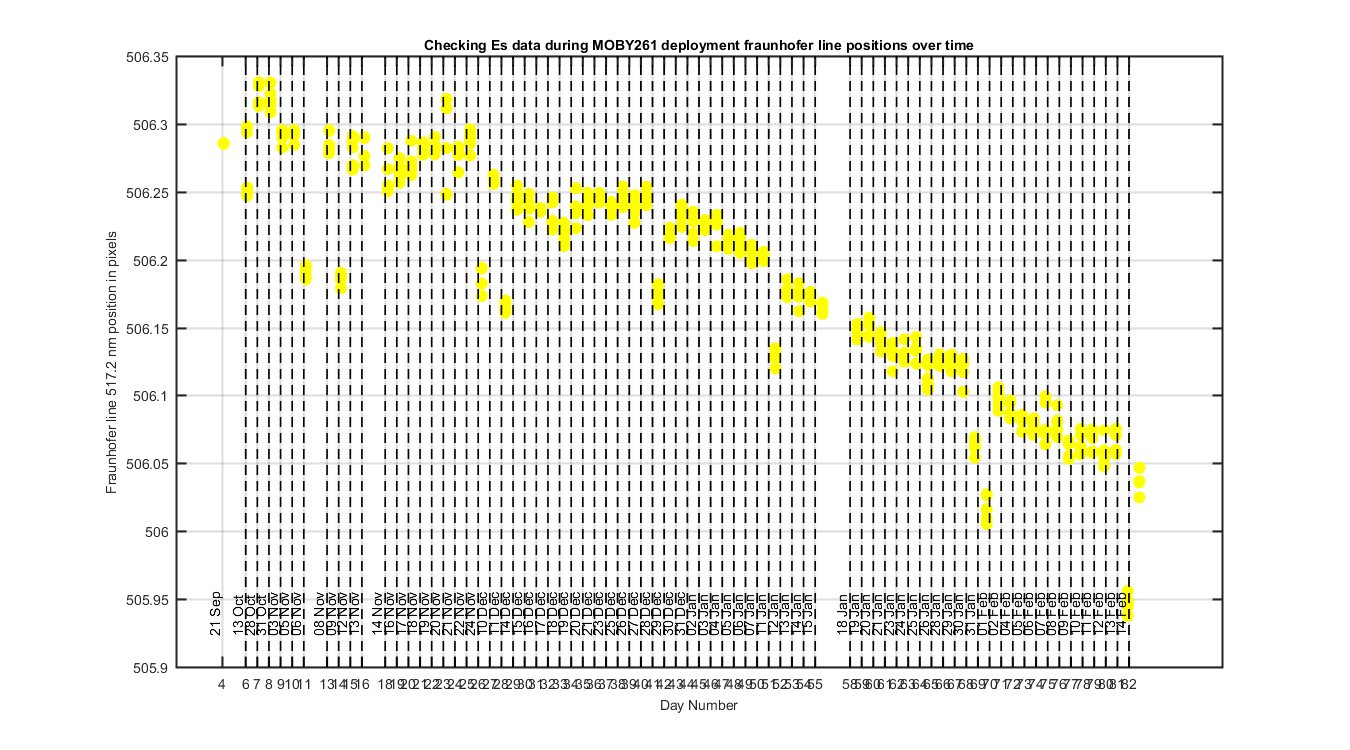
Figure 8
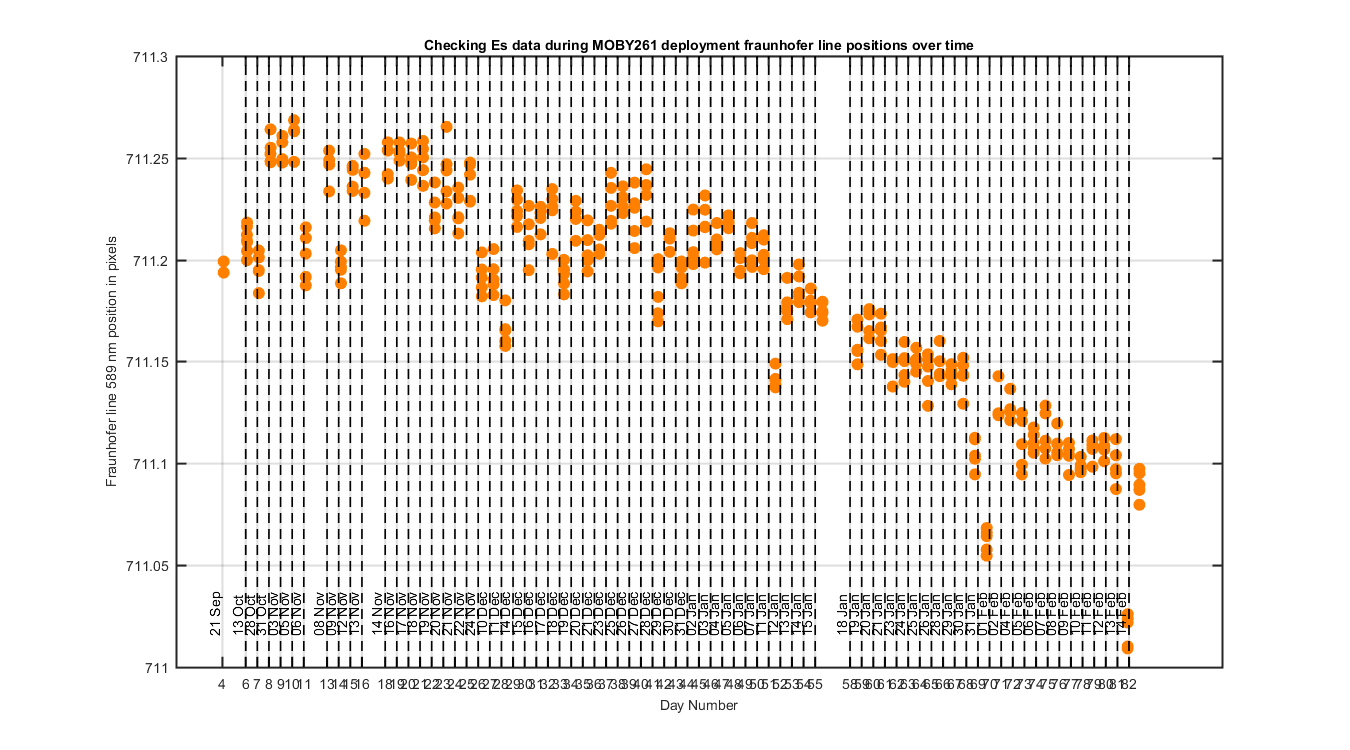
Figure 9
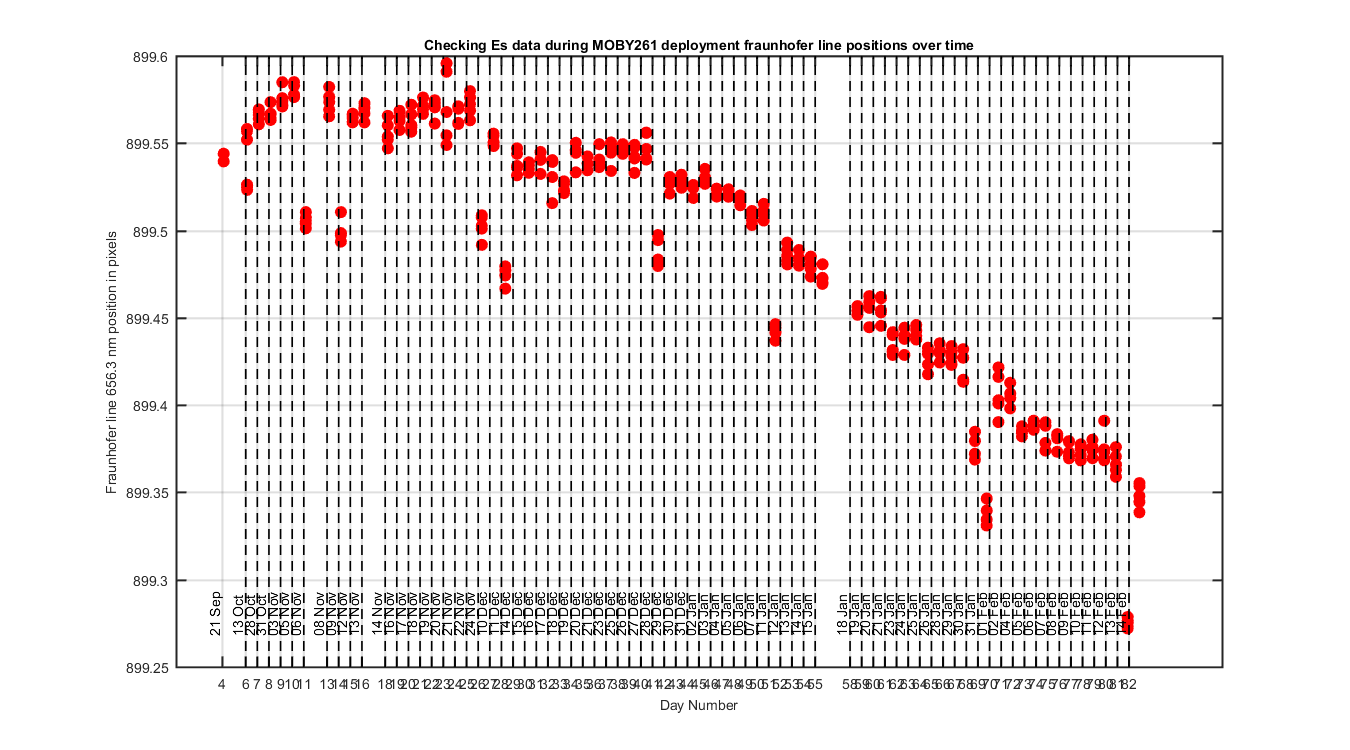
Figure 10
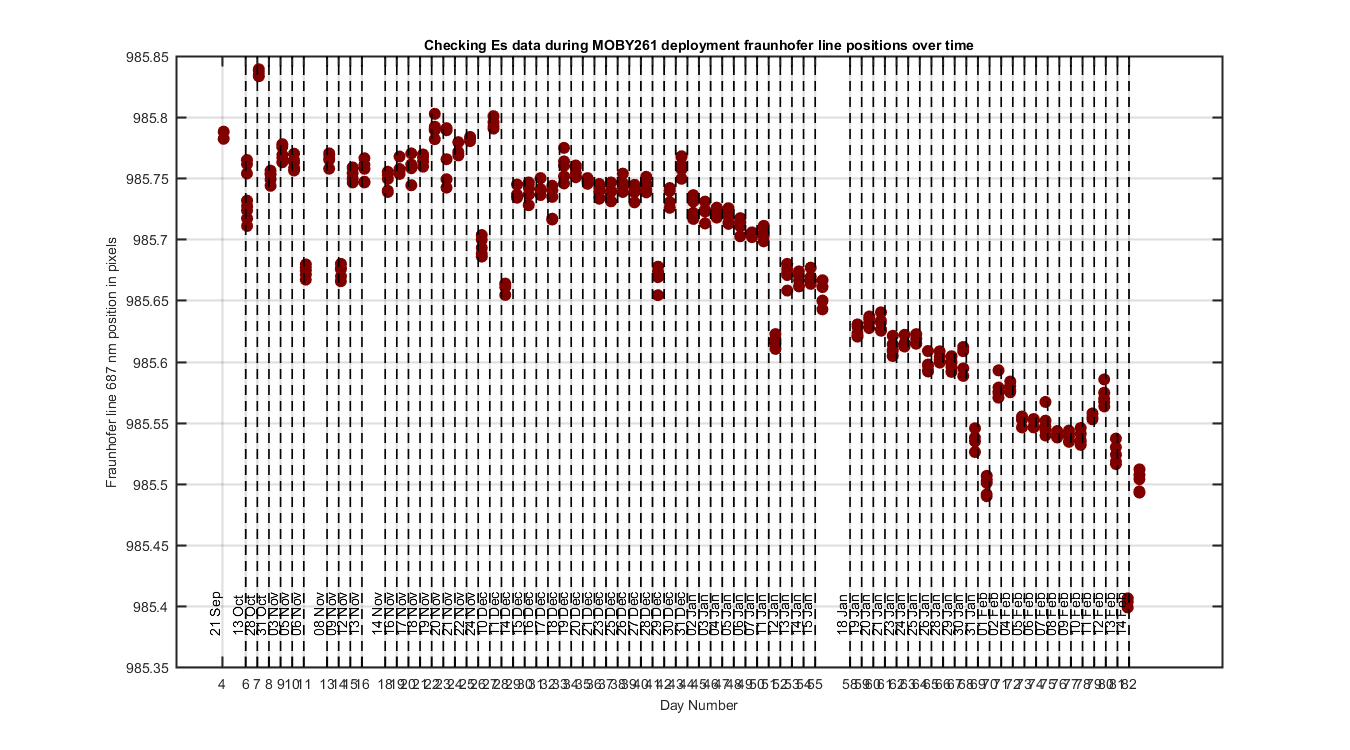
Figure 11
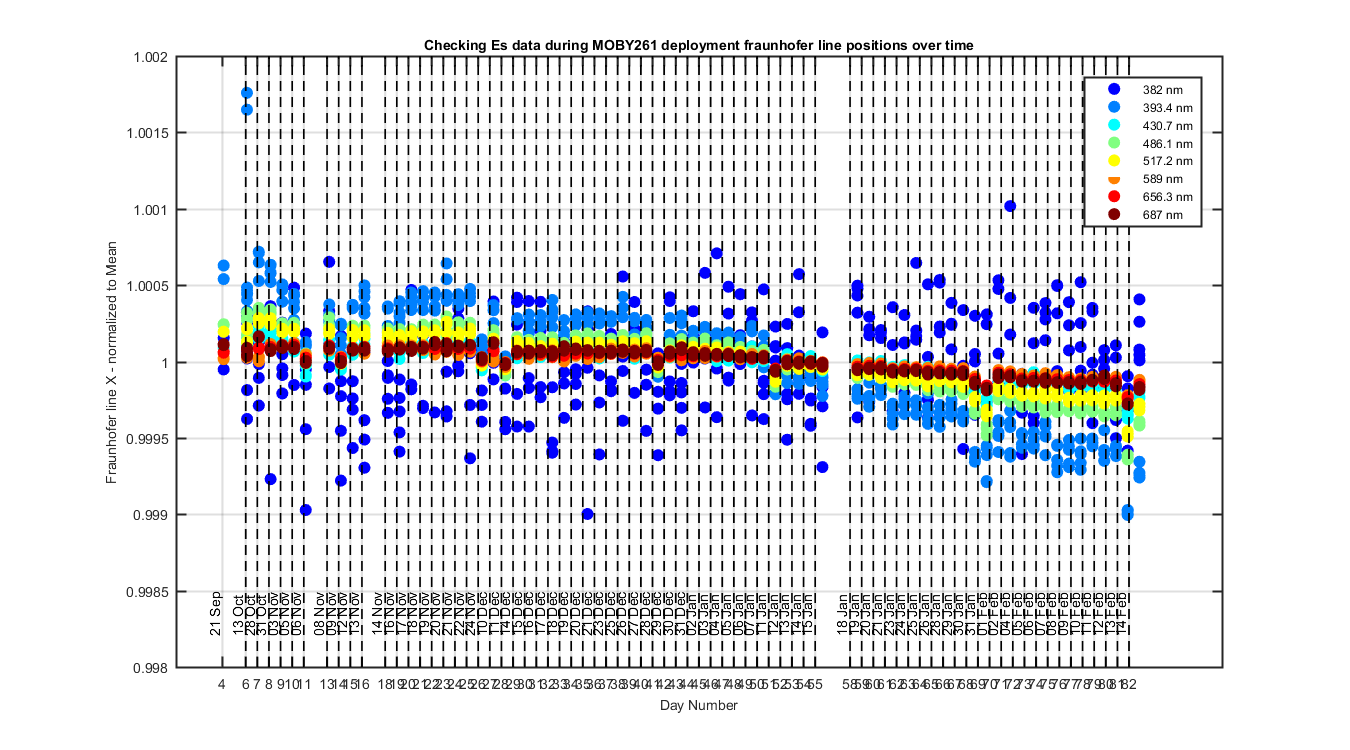
Figure 12