REVISION DATE: 15-Feb-2017 09:51:27
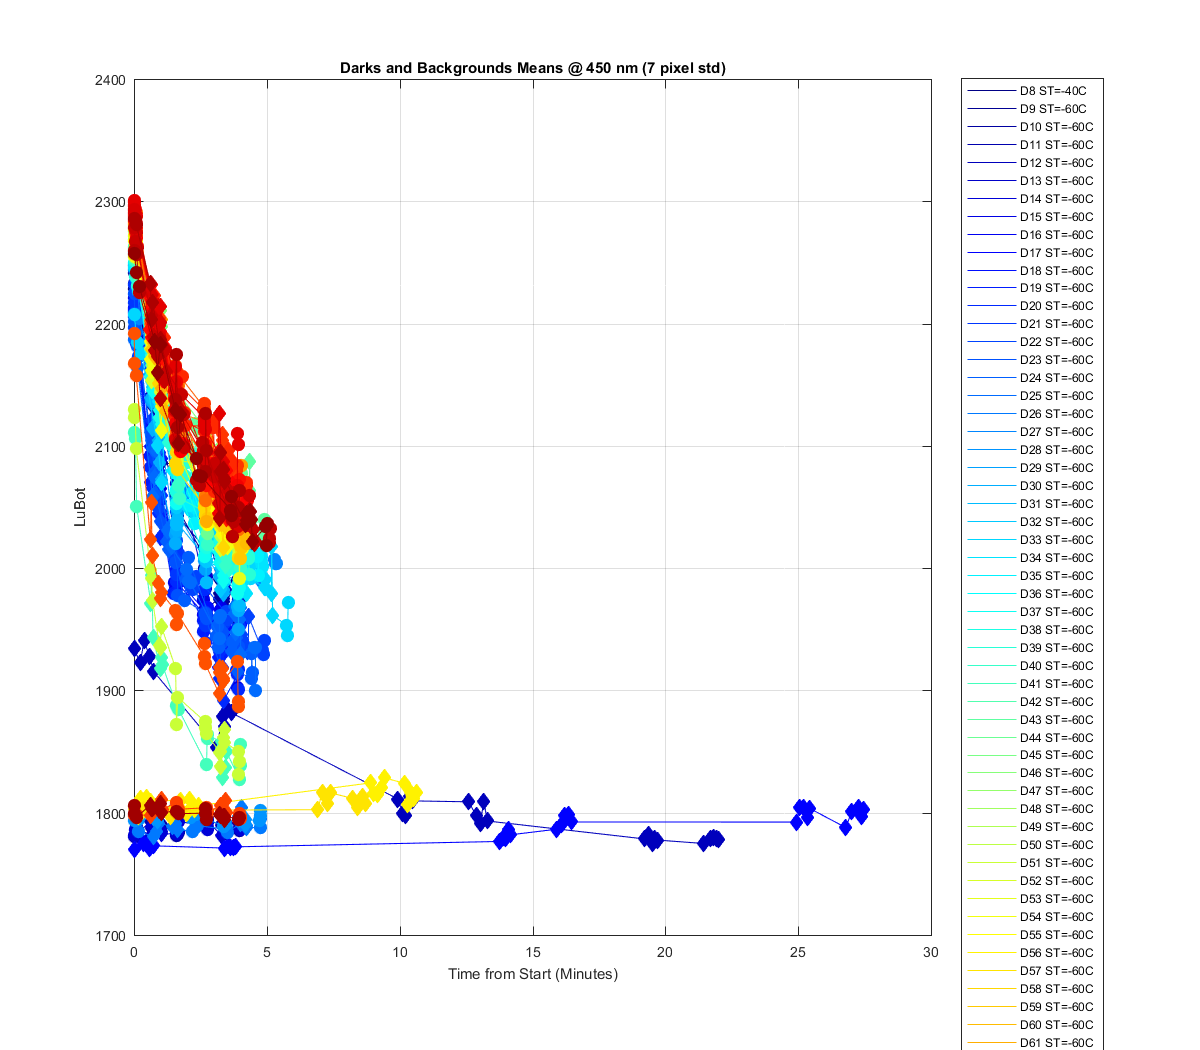
The in-water data time series darks and backgrounds. THis shows all the darks (diamonds) and backgrounds (circles) collected from day 8 to now. Four wavelenghts are using (same as the rsp time series) 400, 450, 550 and 650 nm. A 7 pixels mean was calculated for each dark/background, day, track, and wavelenght. A standard deviation was also calculted. The first graph shows the day 31 darks and backgrounds for track 7, just to give you an idea of the variablity during the 5 minutes it takes to collect a typical in-water data set. And the spectral variability which is not really beinc covered in this page. The first set of 4 graphs shows the dark/background data. Each figure is a different wavelength and each axes is a different track. Rather than showing all 14 tracks I picked the tracks for the in-water sensors. The second set of 4 graphs shows the percent standard deviation for the 7 pixel means. The last set of graphs whos the change in the dark/background over the time it took to data set for that day. The two really long data sets are the divercals (day 12 and 17). The lover orange line is day 41. And the group of shorted blue-green lines are day 11, 14, 26 and 28. These are what the darks at -60 should look like. Stable and not changing much with time.
Figure 1
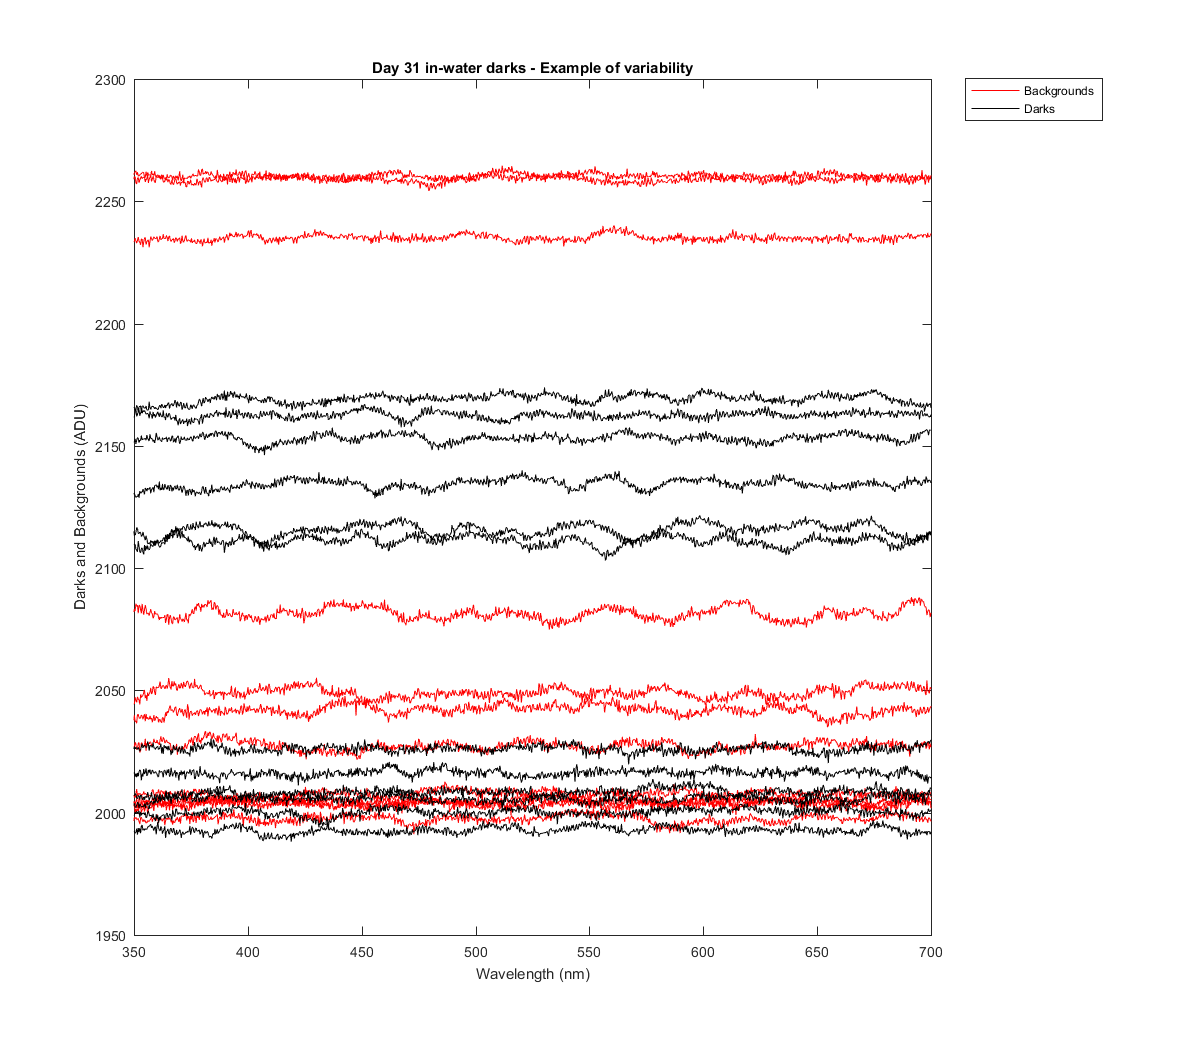
Figure 2

Figure 3

Figure 4

Figure 5
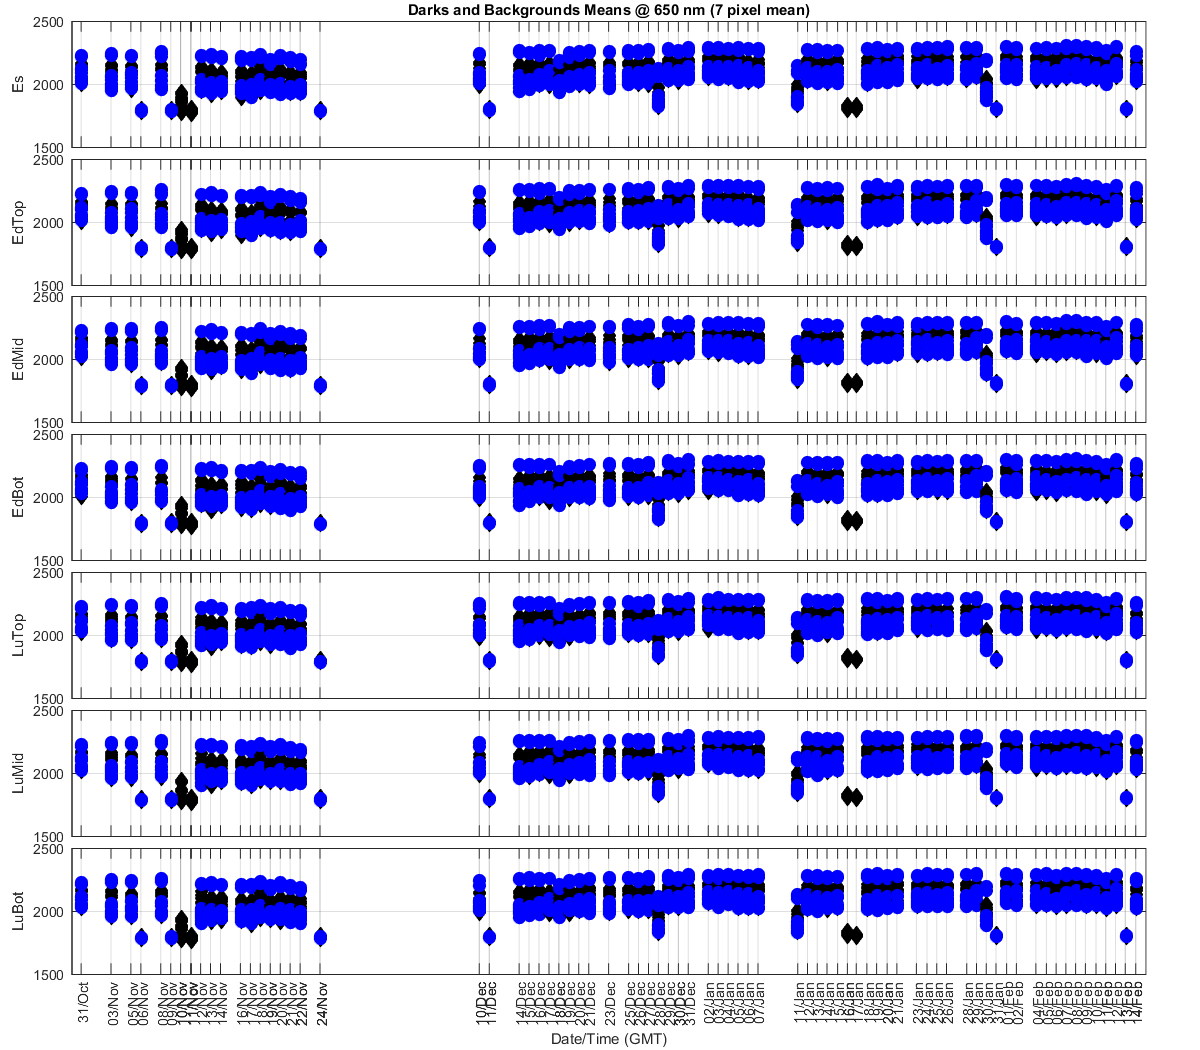
Figure 6
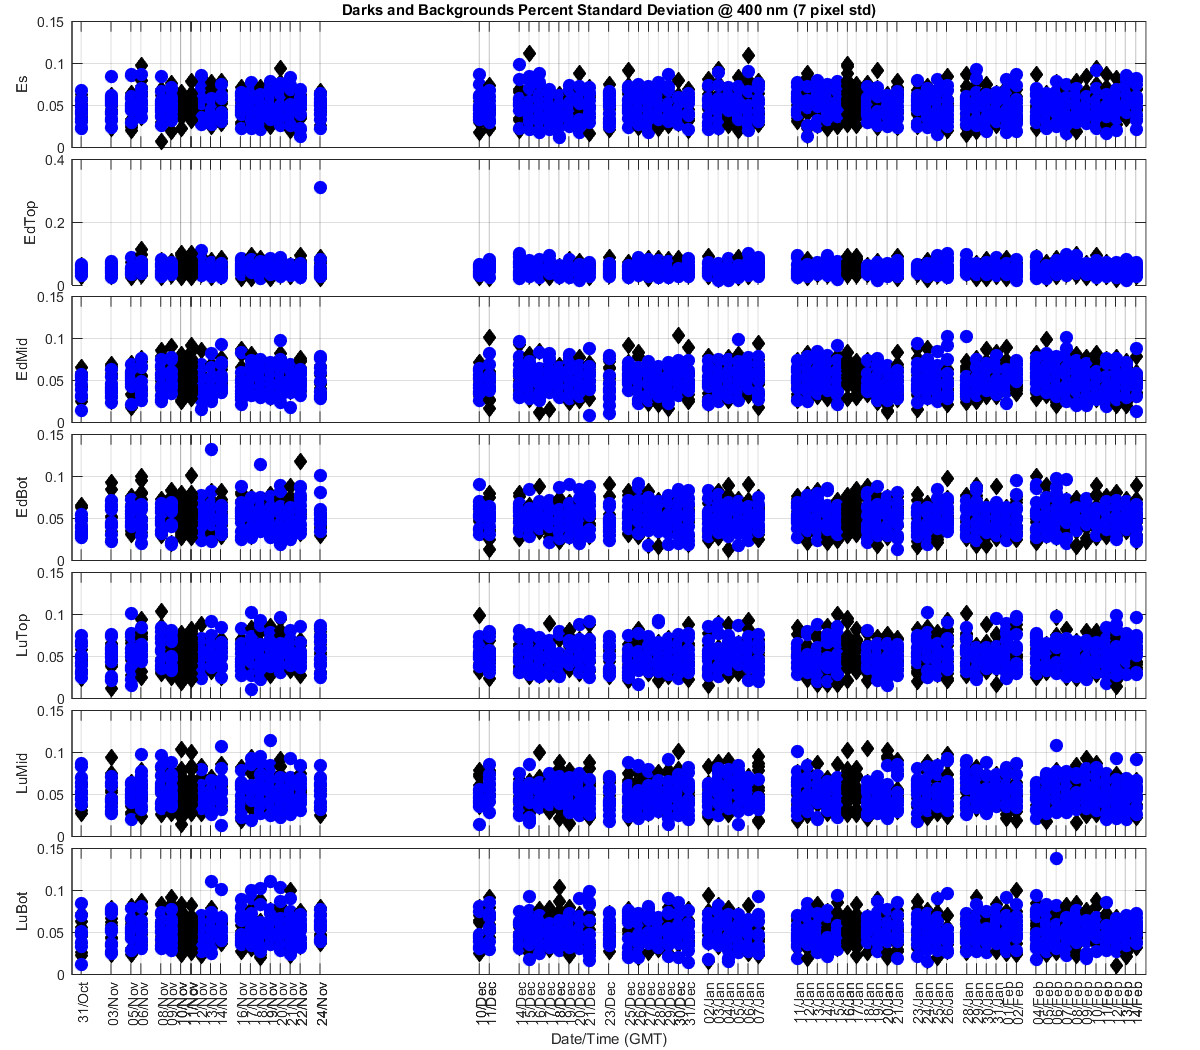
Figure 7
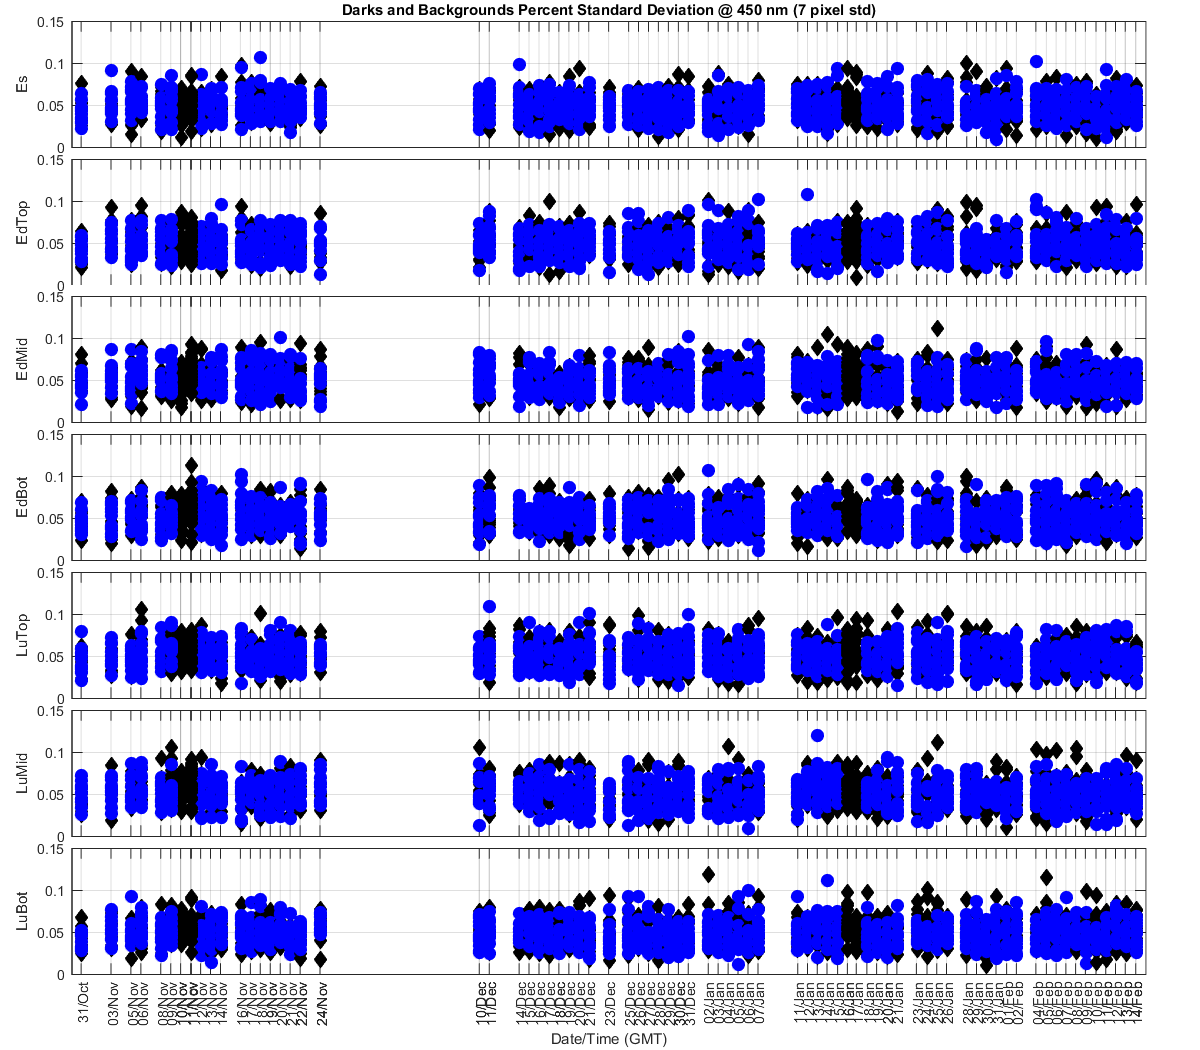
Figure 8
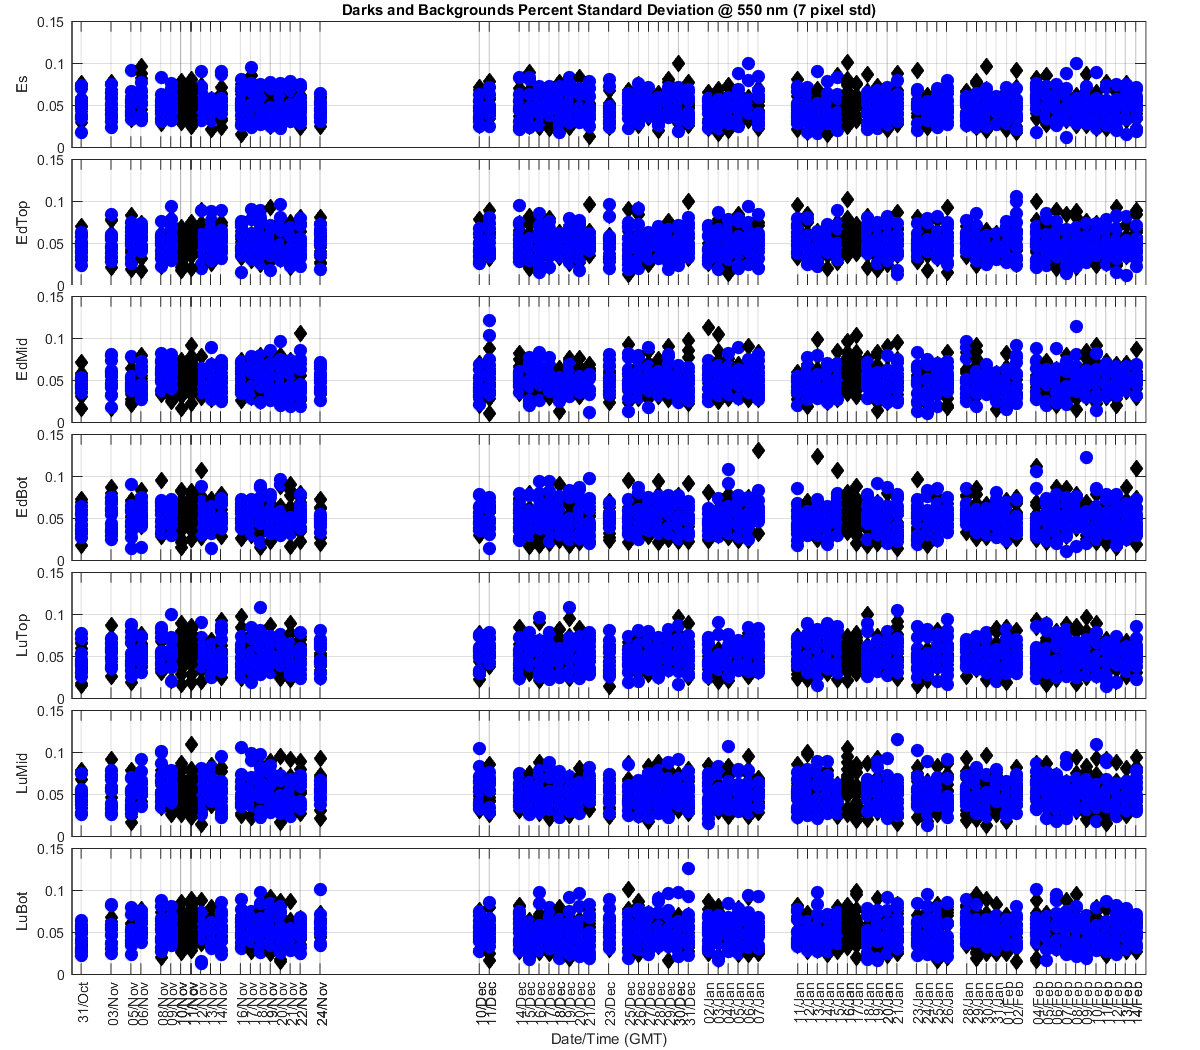
Figure 9
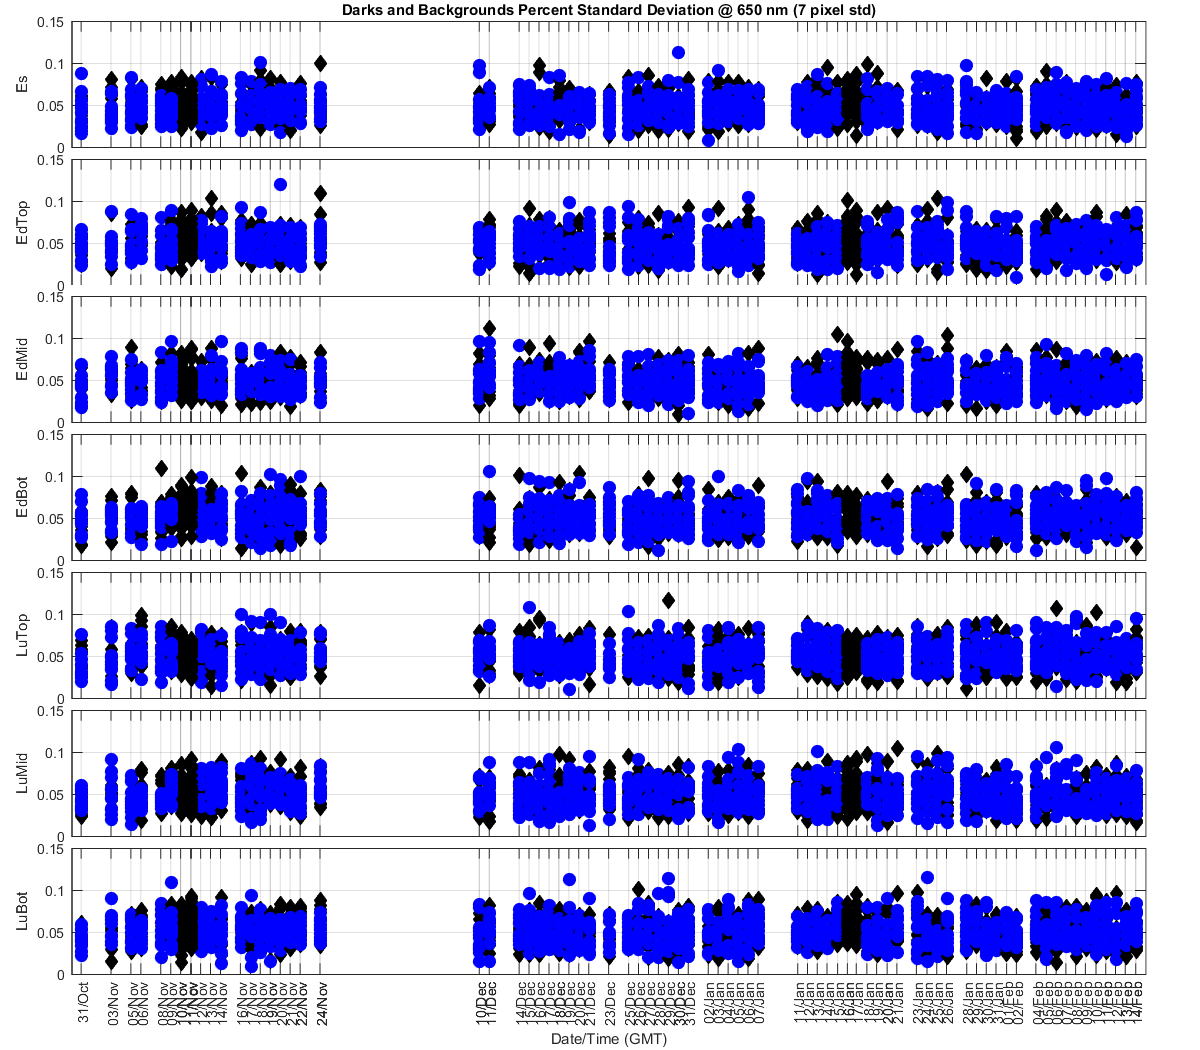
Figure 10
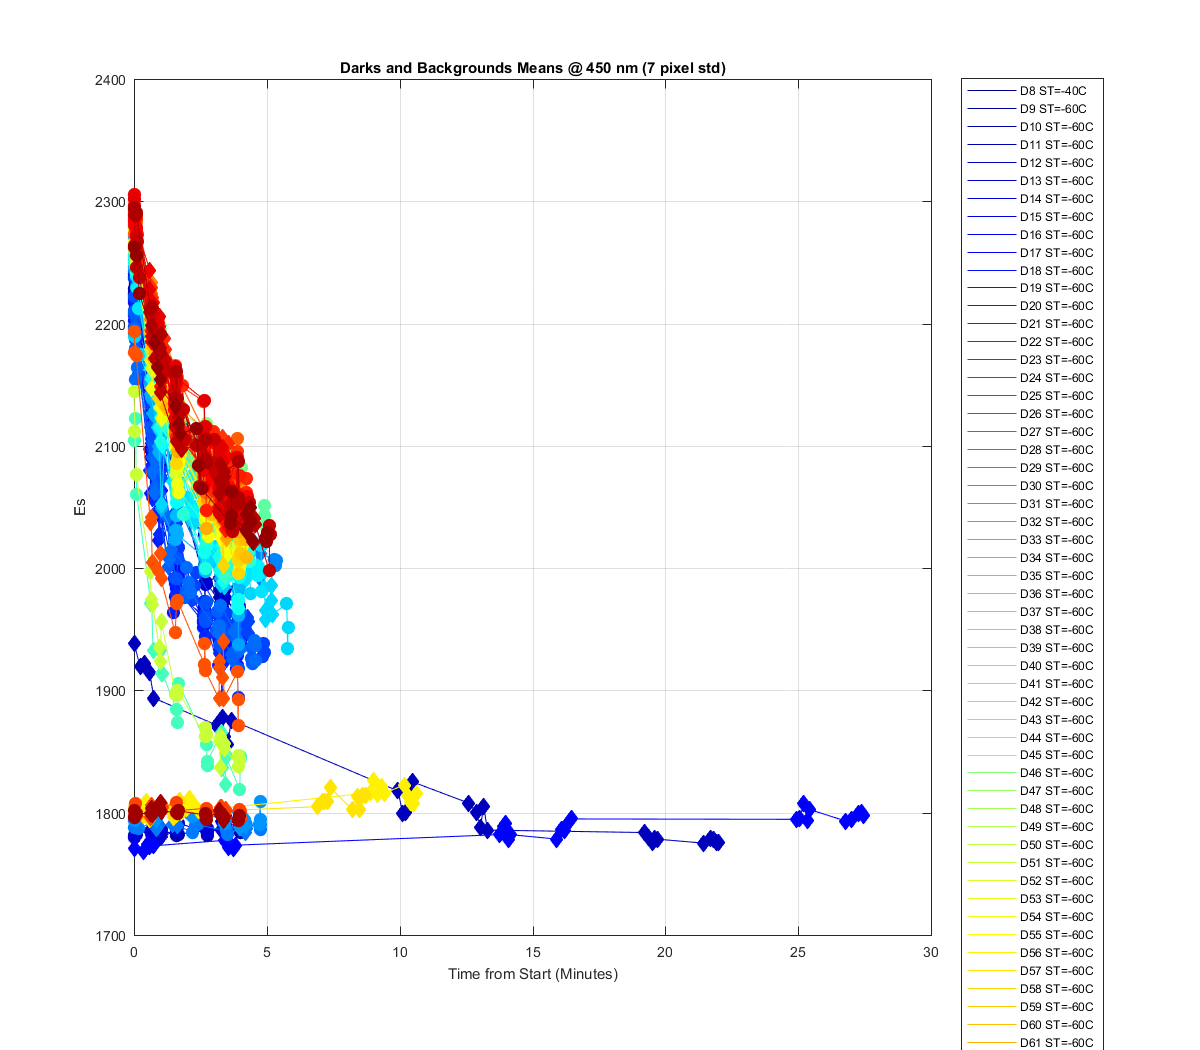
Figure 11
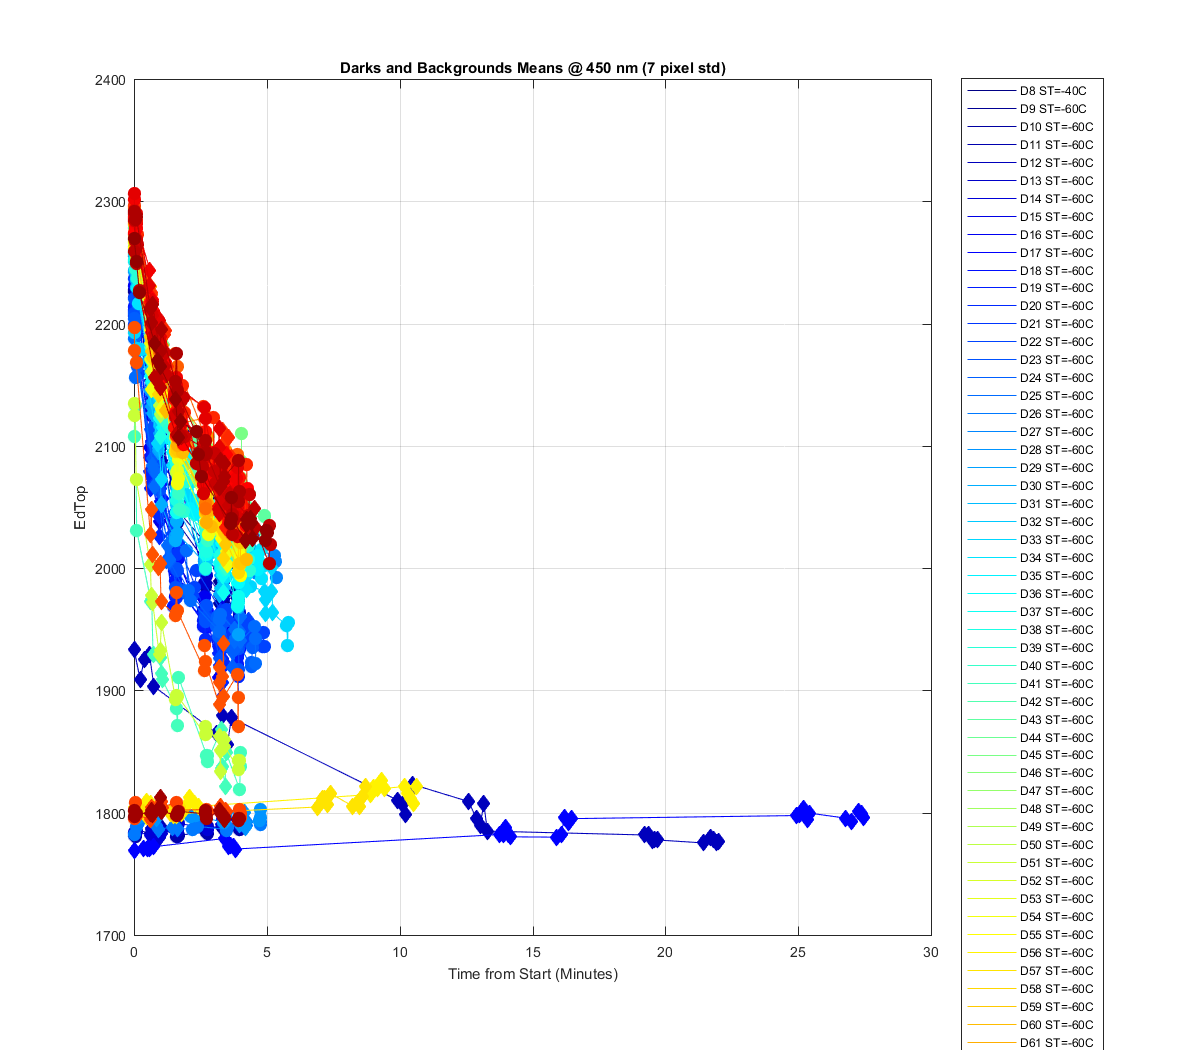
Figure 12

Figure 13
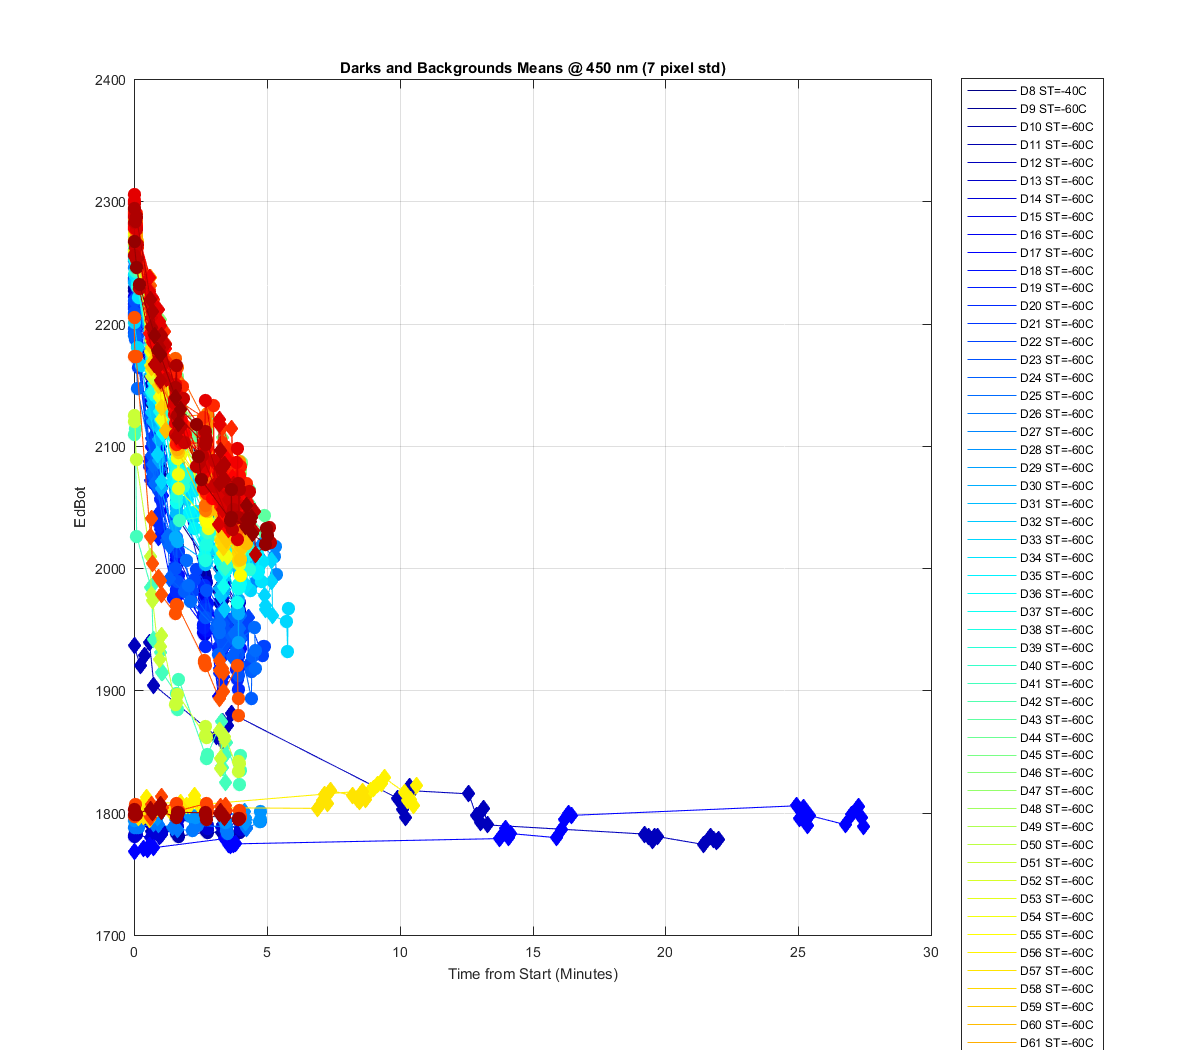
Figure 14

Figure 15
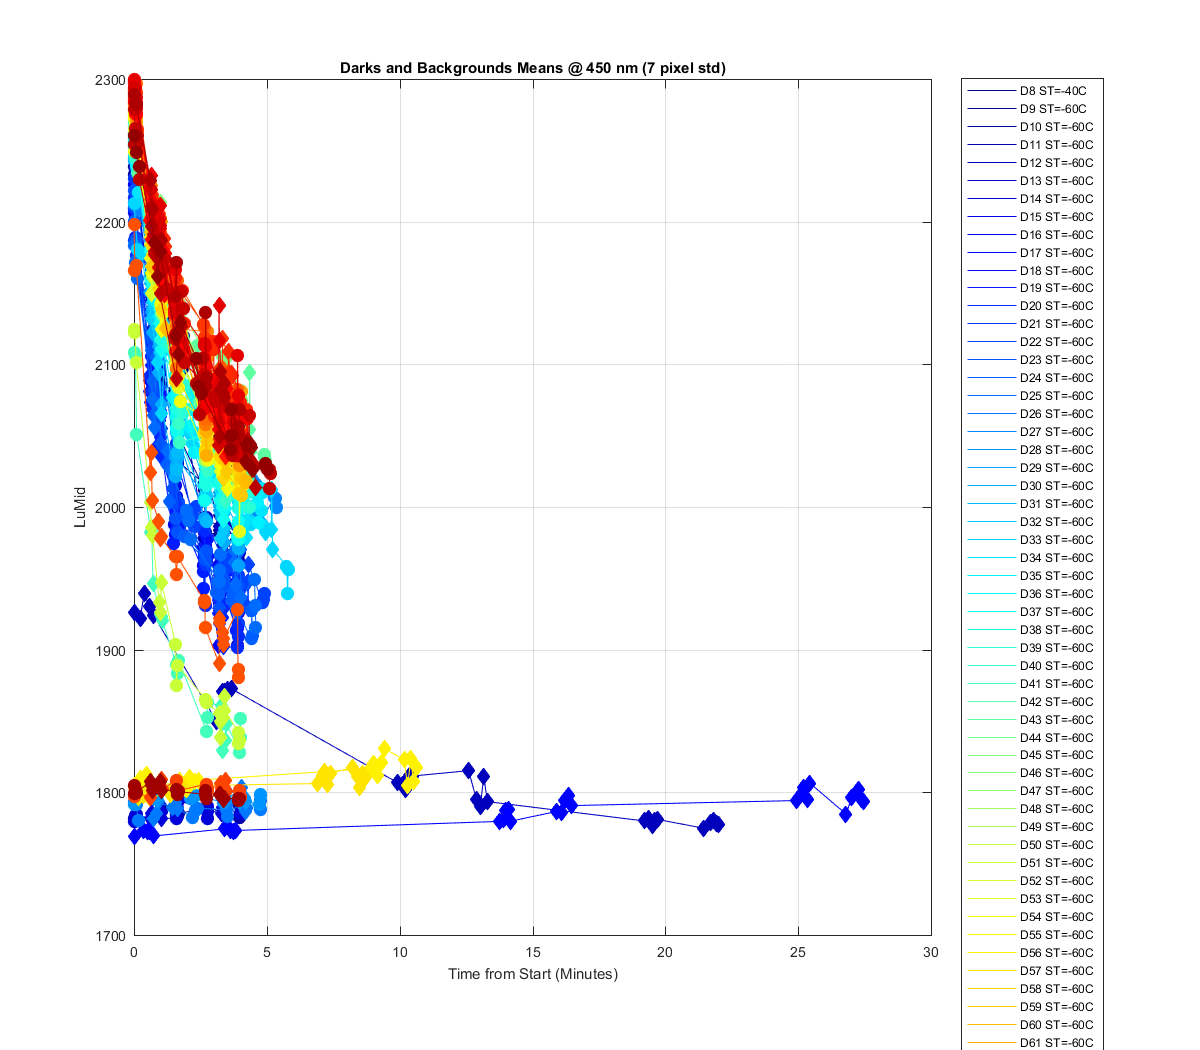
Figure 16